. 2014 Jan;26(1):280-95.
doi: 10.1105/tpc.113.120048. Epub 2014 Jan 14.

AUXIN BINDING PROTEIN1 links cell wall remodeling, auxin signaling, and cell expansion in arabidopsis

Affiliations

AUXIN BINDING PROTEIN1 links cell wall remodeling, auxin signaling, and cell expansion in arabidopsis

Sébastien Paque et al. Plant Cell. 2014 Jan.

Abstract

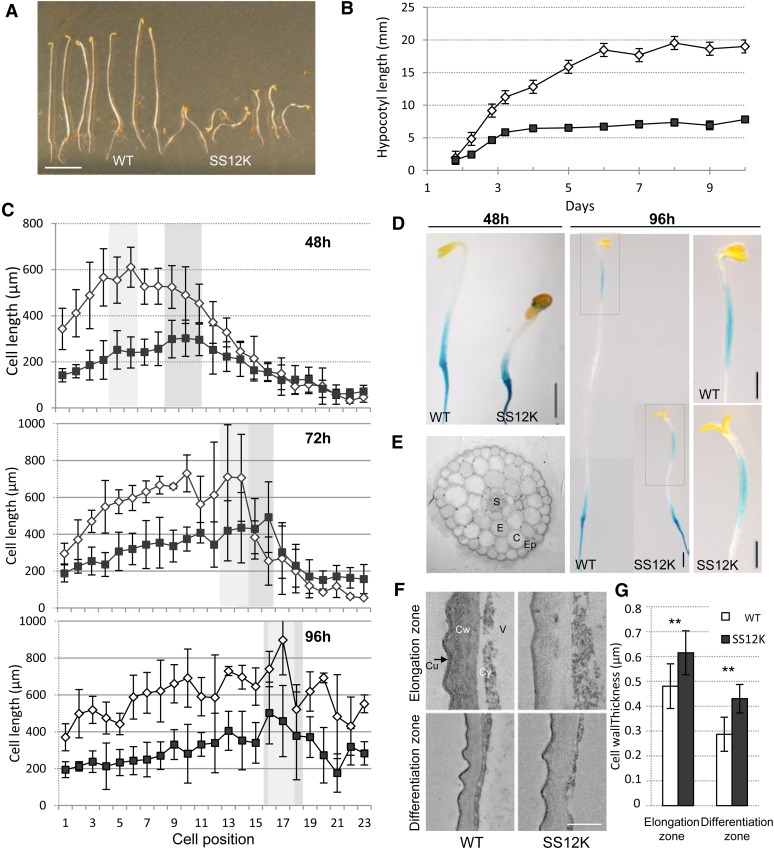
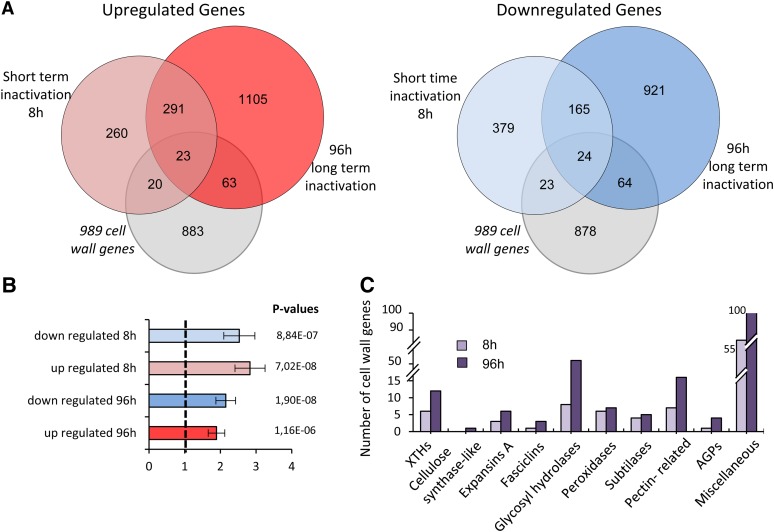
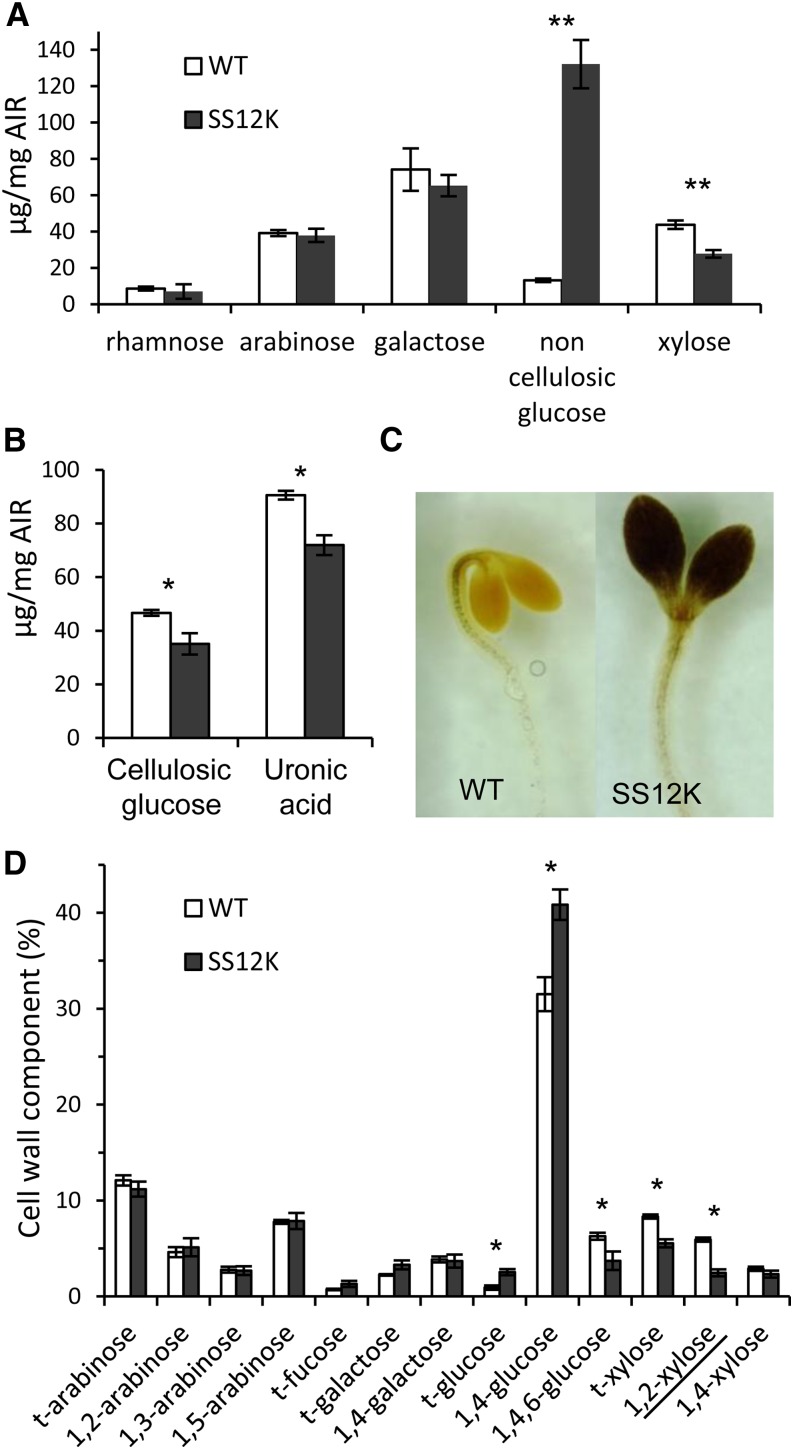
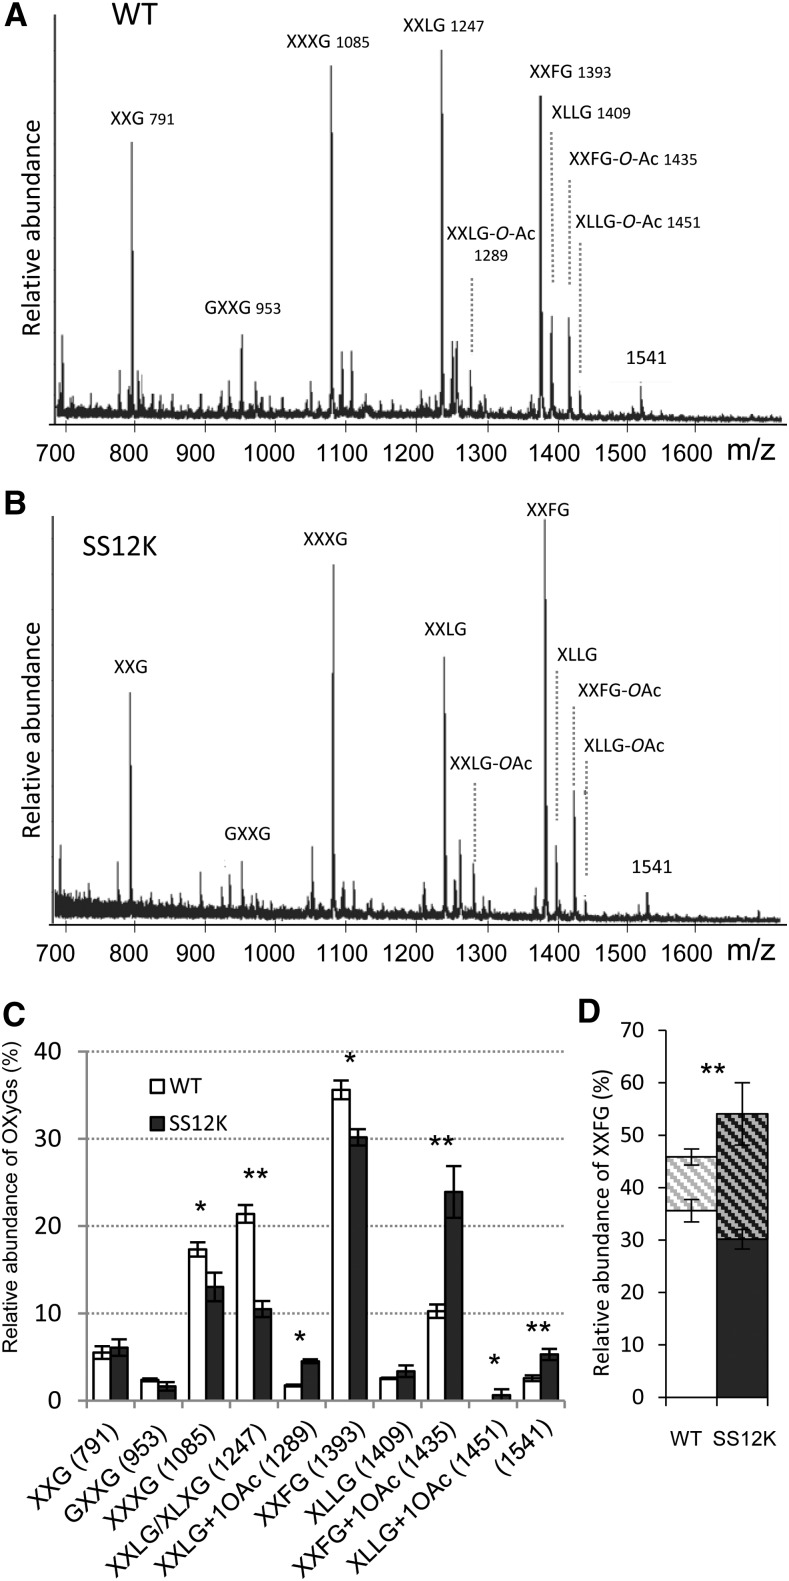
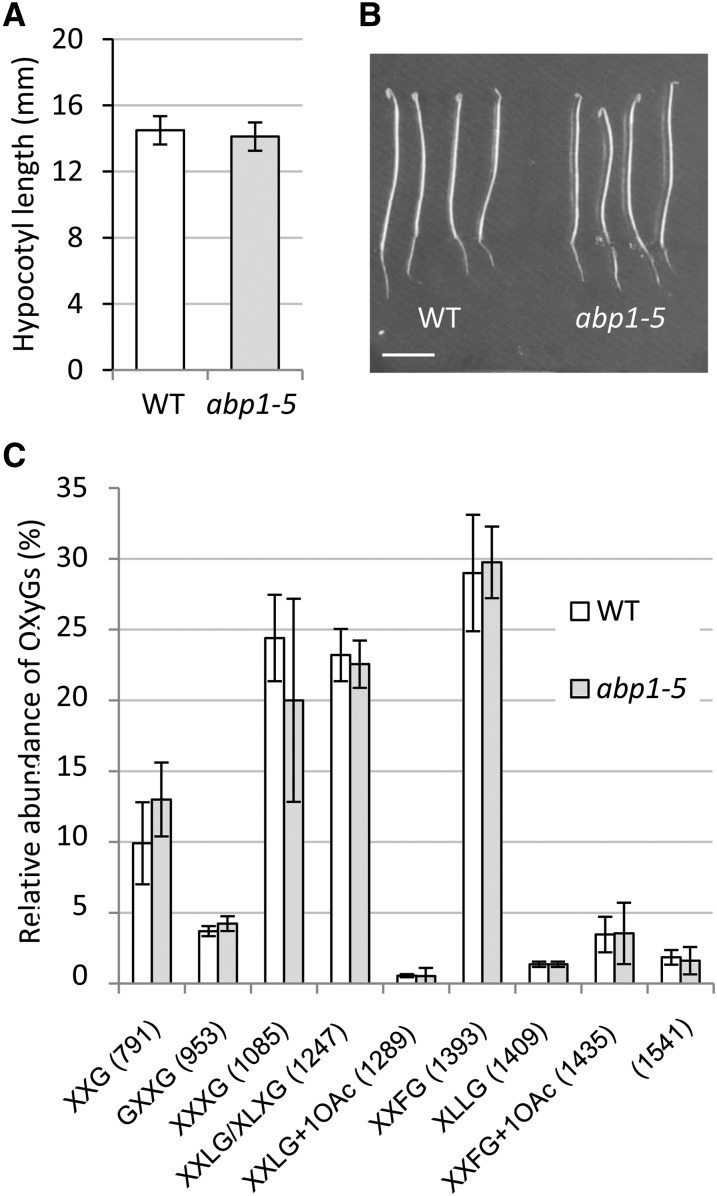
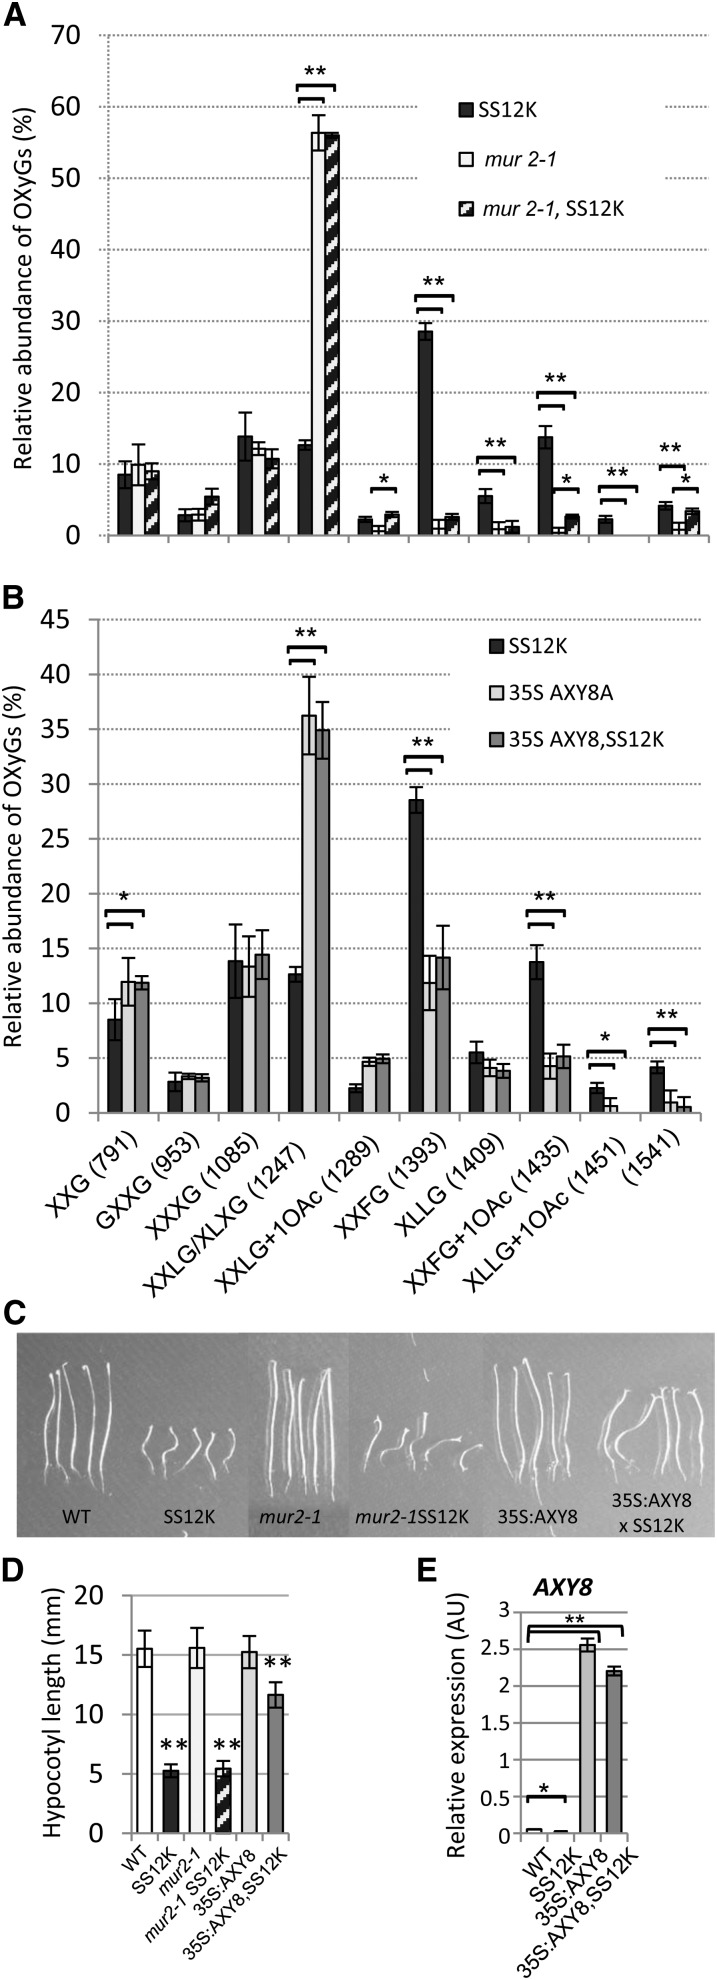
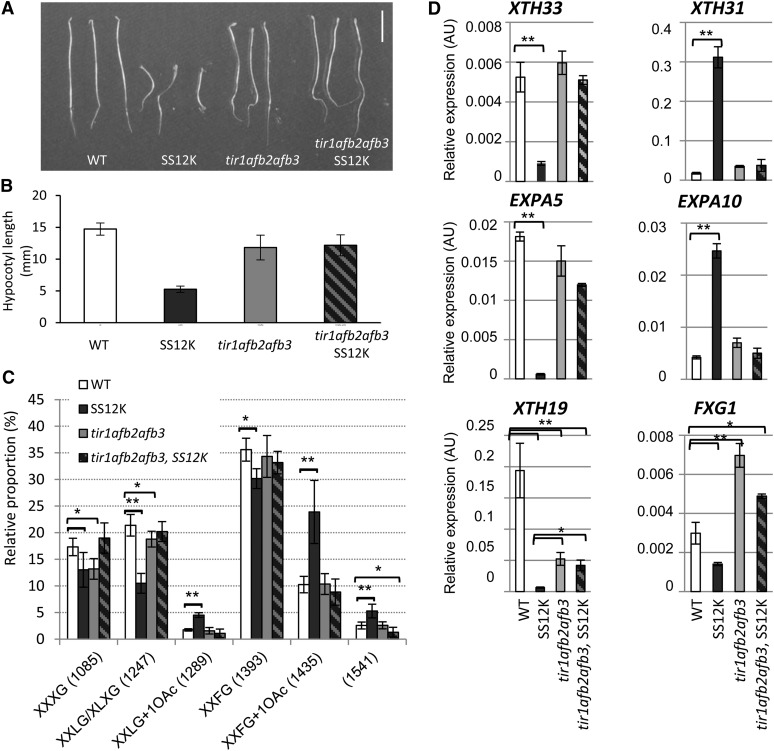
Cell expansion is an increase in cell size and thus plays an essential role in plant growth and development. Phytohormones and the primary plant cell wall play major roles in the complex process of cell expansion. In shoot tissues, cell expansion requires the auxin receptor AUXIN BINDING PROTEIN1 (ABP1), but the mechanism by which ABP1 affects expansion remains unknown. We analyzed the effect of functional inactivation of ABP1 on transcriptomic changes in dark-grown hypocotyls and investigated the consequences of gene expression on cell wall composition and cell expansion. Molecular and genetic evidence indicates that ABP1 affects the expression of a broad range of cell wall-related genes, especially cell wall remodeling genes, mainly via an SCF(TIR/AFB)-dependent pathway. ABP1 also functions in the modulation of hemicellulose xyloglucan structure. Furthermore, fucosidase-mediated defucosylation of xyloglucan, but not biosynthesis of nonfucosylated xyloglucan, rescued dark-grown hypocotyl lengthening of ABP1 knockdown seedlings. In muro remodeling of xyloglucan side chains via an ABP1-dependent pathway appears to be of critical importance for temporal and spatial control of cell expansion.


Figures

Figure 1.
Figure 1.
Characterization of the ABP1 Loss-of-Function Phenotype. (A) Dark-grown phenotype of seedlings of the wild type (left) and SS12K inactivated for ABP1 since germination (right). Bar = 5 mm. (B) Kinetics of hypocotyl elongation of ethanol-induced wild-type and SS12K dark-grown seedlings. Data represent mean ± sd (n = 25) (C) Length of hypocotyl epidermal cells in individual cell files along ethanol-induced wild-type and SS12K dark-grown seedlings at 48, 72, and 96 h from base to apex. Error bars represent sd (n = 8 files from six or seven hypocotyls for SS12K; n = 3 files from three wild-type hypocotyls). Light- and medium-gray backgrounds underline cell elongation maxima in the wild-type and SS12K, respectively. (D) Elongation zone visualized by expression of pCESA6:GUS in ethanol-induced wild-type and SS12K of 2- and 4-d-old dark grown seedlings. Close-up photos on the right correspond to the dotted line frames at 96 h. Bars = 1 mm. (E) Cross sections of 3-d-old dark-grown hypocotyls of SS12K. Ep, epidermis; C, cortical cells; E, endodermis; S, stele (F) Ultrathin transverse section of external epidermal cell wall of wild-type and SS12K dark-grown hypocotyls. Sections were taken at the elongation zone and at the base of 3-d-old hypocotyls. Cu, cuticle; Cy, cytoplasm; Cw, cell wall; V, vacuole. Bar = 500 nm. (G) Cell wall thickness of external epidermal wall as in (F). Data are mean ± sd. Measurements were performed on 16 to 19 cells from three hypocotyls for each. **P value < 0.001.
Figure 2.
Figure 2.
Comparative Analysis of Genes Differentially Expressed between ABP1-Inactivated and Control Dark-Grown Seedlings after Short- and Long-Term Ethanol Induction. Ethanol induction results in ABP1 inactivation in SS12K and expression of GUS reporter in the control line (A) Venn diagram representing the number of overlapping and unique upregulated (left) and downregulated (right) genes after 8 and 96 h of ethanol induction promoting scFv12 expression and resulting inactivation of ABP1. Differentially expressed genes are also compared with cell wall annotated genes (gray circle) in TAIR10 implemented by cell wall genes expressed in dark-grown hypocotyl listed by Jamet et al. (2009). (B) Histograms illustrating the overrepresentation of cell wall–related genes after inactivation of ABP1. The data take into account normalization to the total number of cell wall genes present on the chip. (C) Major classes of cell wall genes differentially expressed after short- and long-term inactivation of ABP1.
Figure 3.
Figure 3.
Cell Wall Analyses of Wild-Type and SS12K Dark-Grown Seedlings (A) Monosaccharide composition analysis of the wild type and SS12K. AIR, alcohol-insoluble residue. Bars represent sd (n = 4 biological replicates); **P value < 0.001. (B) Quantification of cellulosic Glc and uronic acid. Bars represent sd (n = 4 biological replicates); *P value < 0.05. (C) Lugol staining of wild-type and SS12K dark-grown seedlings. (D) Glycosidic linkage analysis of cell wall polysaccharides extracted from ethanol-induced wild-type and SS12K dark-grown hypocotyls. Data are mean ± sd (n = 4 biological replicates); *P value < 0.01
Figure 4.
Figure 4.
Xyloglucan Fingerprinting of Dark-Grown Hypocotyls (A) and (B) Representative spectra of oligosaccharides released by the endoglucanase and analyzed by OLIMP of ethanol-induced wild-type (A) and SS12K (B) 4-d-old dark-grown hypocotyls. (C) Quantitative analysis of OLIMP data for the wild type and SS12K. Data are mean ± sd (n = 4 biological replicates). *P < 0.05 and **P < 0.01 (D) Relative amount of fucosylated OXyG fragments in the wild type and SS12K. Histograms represent the sum of O-acetylated and nonacetylated XXFG for each genotype. **P value < 0.01
Figure 5.
Figure 5.
Xyloglucan Fingerprinting of Dark-Grown abp1-5 Hypocotyls. (A) Hypocotyl length of 4-d-old dark-grown seedlings (B) Phenotypes of dark-grown seedlings (C) Quantitative analysis of OLIMP data for the wild type and abp1-5. Data are mean ± sd (biological replicates n = 4). None of the differences are statistically significant.
Figure 6.
Figure 6.
Partial Restoration of Cell Expansion in ABP1-Inactivated Hypocotyls of SS12K by α-Fucosidase–Mediated Xyloglucan Defucosylation. (A) Comparison of the relative abundance of a selection of OXyGs, quantified from OLIMP spectra, between ethanol-induced hypocotyls of SS12K, mur2-1 null mutant, and SS12K in mur2-1 background. Statistical tests were calculated for SS12K versus mur2-1 or versus mur2-1SS12K; mur2-1 was also compared with mur2-1SS12K. *P < 0.05 and **P < 0.005. (B) Comparison of the relative abundance of a selection of OXyGs, quantified from OLIMP spectra, between ethanol-induced hypocotyls of SS12K, 35S:AXY8 overexpressor, and SS12K 35S:AXY8 double transformants. In (A) and (B), data are mean ± sd (biological repeats n = 4). Statistical tests were calculated for SS12K versus 35S:AXY8 or 35SAX8,SS12K. *P < 0.05 and **P < 0.001. (C) Phenotype of 4-d-old dark-grown seedlings. Statistical tests were calculated by comparing each genotype with and without SS12K. **P < 0.001. (D) Hypocotyl length of 4-d-old dark-grown seedlings. Bars represent sd (n = 4 × 25). (E) mRNA accumulation of AXY8 in dark-grown seedlings exposed to ethanol vapors since germination. Data were normalized with respect to ACTIN2-8 and expressed in relative units. Bars represent sd (three biological repeats and two technical replicates). Statistical tests were calculated by comparing the wild type to other genotypes. *P < 0.05 and **P < 0.001. AU, Actin unit.
Figure 7.
Figure 7.
Suppression of ABP1 Loss-of-Function Phenotype in SS12K tir/afbs Background. (A) Phenotype of 4-d-old dark-grown seedlings as indicated. (B) Hypocotyl length for 4-d-old dark-grown seedlings. (C) Comparison of the relative abundance of a selection of OXyGs, quantified from OLIMP spectra, between ethanol-induced hypocotyls of the wild type, SS12K, tir1-1 afb2-1 afb3-1 triple mutant, and SS12K in the triple F-box mutant background. Data are mean ± sd (biological repeats n = 4). Statistical tests were calculated for the wild type versus each other genotypes. *P < 0.02 and **P < 0.001. (D) RNA accumulation of a selection of XyG-related genes in the distinct genotypes as indicated. All data were normalized with respect to ACTIN2-8 and expressed in relative units. For all graphs, data are mean ± sd (biological repeats n = 3, and two technical repeats for each). Differences between the wild type and SS12K are always significant at P value < 0.01. The wild type versus tir1 afb2 afb3 or tir1 afb2 afb3 SS12K is as indicated (*P < 0.05 and **P < 0.01). AU, Actin unit.

References

    1. Anderson C.T., Carroll A., Akhmetova L., Somerville C. (2010). Real-time imaging of cellulose reorientation during cell wall expansion in Arabidopsis roots. Plant Physiol. 152: 787–796 - PMC - PubMed
    1. Augur C., Benhamou N., Darvill A., Albersheim P. (1993). Purification, characterization, and cell wall localization of an alpha-fucosidase that inactivates a xyloglucan oligosaccharin. Plant J. 3: 415–426 - PubMed
    1. Barbier-Brygoo H., Zimmermann S., Thomine S., White I.R., Millner P., Guern J. (1996). Elementary auxin response chains at the plasma membrane involve external abp1 and multiple electrogenic ion transport proteins. Plant Growth Regul. 18: 23–28
    1. Baumann M.J., Eklöf J.M., Michel G., Kallas A.M., Teeri T.T., Czjzek M., Brumer H.I., III (2007). Structural evidence for the evolution of xyloglucanase activity from xyloglucan endo-transglycosylases: Biological implications for cell wall metabolism. Plant Cell 19: 1947–1963 - PMC - PubMed
    1. Blumenkrantz N., Asboe-Hansen G. (1973). New method for quantitative determination of uronic acids. Anal. Biochem. 54: 484–489 - PubMed

Publication types

MeSH terms