

Temporal trends in phthalate exposures: findings from the National Health and Nutrition Examination Survey, 2001-2010
- PMID: 24425099
- PMCID: PMC3948032
- DOI: 10.1289/ehp.1306681
Temporal trends in phthalate exposures: findings from the National Health and Nutrition Examination Survey, 2001-2010
Abstract
Background: Phthalates are ubiquitous environmental contaminants. Because of potential adverse effects on human health, butylbenzyl phthalate [BBzP; metabolite, monobenzyl phthalate (MBzP)], di-n-butyl phthalate [DnBP; metabolite, mono-n-butyl phthalate (MnBP)], and di(2-ethylhexyl) phthalate (DEHP) are being replaced by substitutes including other phthalates; however, little is known about consequent trends in population-level exposures.
Objective: We examined temporal trends in urinary concentrations of phthalate metabolites in the general U.S. population and whether trends vary by sociodemographic characteristics.
Methods: We combined data on 11 phthalate metabolites for 11,071 participants from five cycles of the National Health and Nutrition Examination Survey (2001-2010). Percent changes and least square geometric means (LSGMs) were calculated from multivariate regression models.
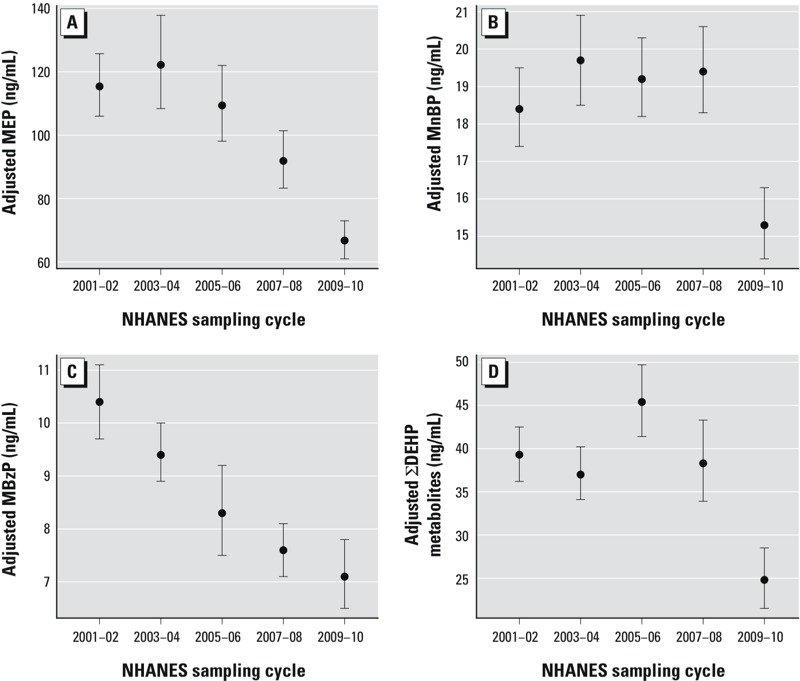
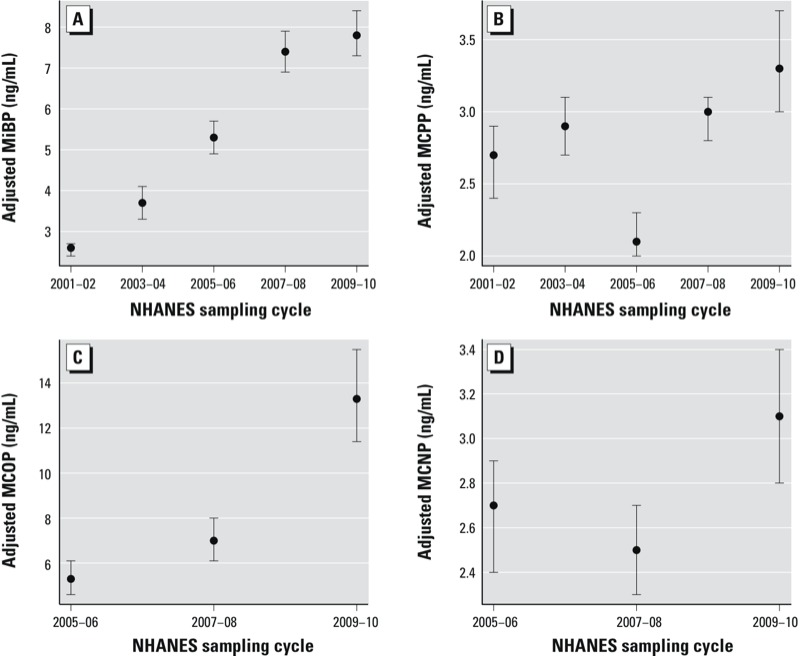
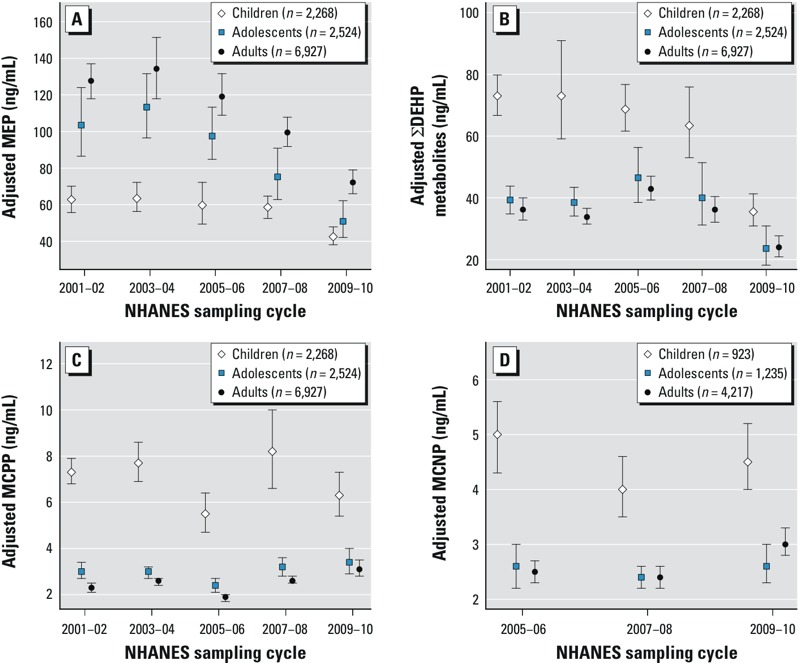
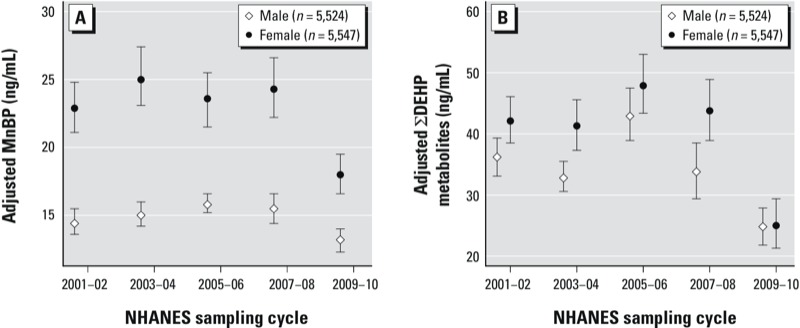
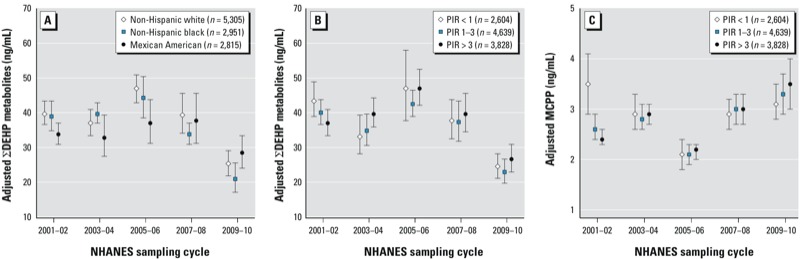
Results: LSGM concentrations of monoethyl phthalate, MnBP, MBzP, and ΣDEHP metabolites decreased between 2001-2002 and 2009-2010 [percent change (95% CI): -42% (-49, -34); -17% (-23, -9); -32% (-39, -23) and -37% (-46, -26), respectively]. In contrast, LSGM concentrations of monoisobutyl phthalate, mono(3-carboxypropyl) phthalate (MCPP), monocarboxyoctyl phthalate, and monocarboxynonyl phthalate (MCNP) increased over the study period [percent change (95% CI): 206% (178, 236); 25% (8, 45); 149% (102, 207); and 15% (1, 30), respectively]. Trends varied by subpopulations for certain phthalates. For example, LSGM concentrations of ΣDEHP metabolites, MCPP, and MCNP were higher in children than adults, but the gap between groups narrowed over time (pinteraction < 0.01).
Conclusions: Exposure of the U.S. population to phthalates has changed in the last decade. Data gaps make it difficult to explain trends, but legislative activity and advocacy campaigns by nongovernmental organizations may play a role in changing trends.
Citation: Zota AZ, Calafat AM, Woodruff TJ. 2014. Temporal trends in phthalate exposures: findings from the National Health and Nutrition Examination Survey, 2001-2010. Environ Health Perspect 122:235-241; http://dx.doi.org/10.1289/ehp.1306681.
Conflict of interest statement
The findings and conclusions in this report are those of the authors and do not necessarily represent the official position of the CDC.
The authors declare they have no actual or potential competing financial interests.
Figures
Comment in
-
Changing trends in phthalate exposures: Zota and Woodruff respond.Environ Health Perspect. 2014 Oct;122(10):A264-5. doi: 10.1289/ehp.1408629R. Environ Health Perspect. 2014. PMID: 25271395 Free PMC article. No abstract available.
-
Changing trends in phthalate exposures.Environ Health Perspect. 2014 Oct;122(10):A264. doi: 10.1289/ehp.1408629. Environ Health Perspect. 2014. PMID: 25272327 Free PMC article. No abstract available.
References
-
- Al-Saleh I, Shinwari N, Alsabbaheen A. Phthalates residues in plastic bottled waters. J Toxicol Sci. 2011;36:469–478. - PubMed
-
- Barlow NJ, Foster PM. Pathogenesis of male reproductive tract lesions from gestation through adulthood following in utero exposure to di (n-butyl) phthalate. Toxicol Pathol. 2003;31:397–410. - PubMed
-
- Becker K, Güen T, Seiwert M, Conrad A, Pick-Fuß H, Müller J, et al. GerES IV: phthalate metabolites and bisphenol A in urine of German children. Int J Hyg Envir Heal. 2009;212:685–692. - PubMed
Publication types
MeSH terms
Substances
Grants and funding
LinkOut - more resources
Full Text Sources
Other Literature Sources
Miscellaneous
