. 2014 Feb 28;289(9):5654-63.
doi: 10.1074/jbc.M113.526152. Epub 2014 Jan 14.

Receptor-interacting protein 1 increases chemoresistance by maintaining inhibitor of apoptosis protein levels and reducing reactive oxygen species through a microRNA-146a-mediated catalase pathway

Affiliations

Receptor-interacting protein 1 increases chemoresistance by maintaining inhibitor of apoptosis protein levels and reducing reactive oxygen species through a microRNA-146a-mediated catalase pathway

Qiong Wang et al. J Biol Chem. .

Abstract

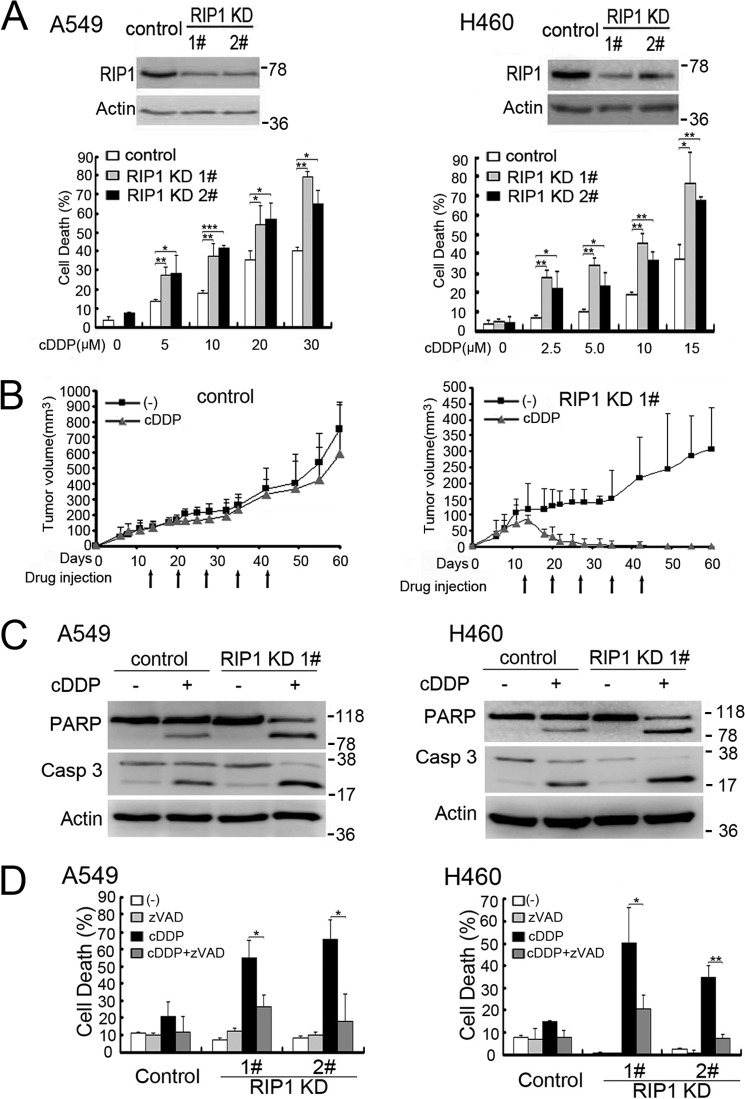
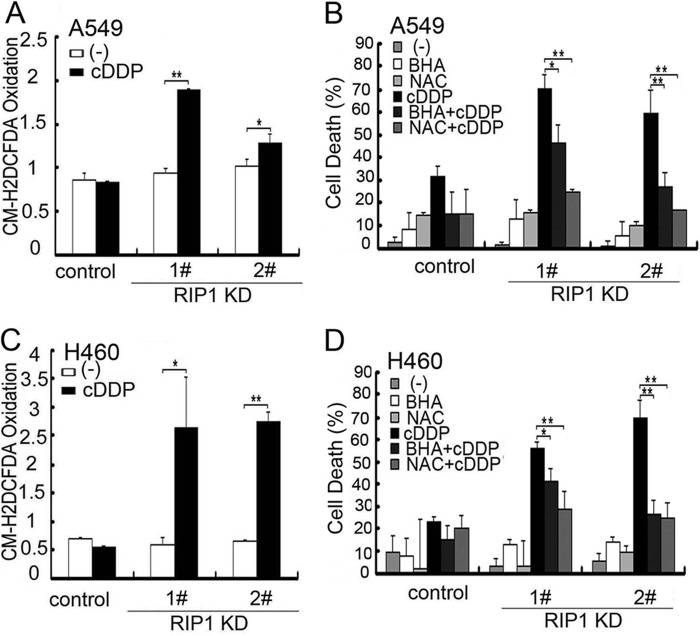
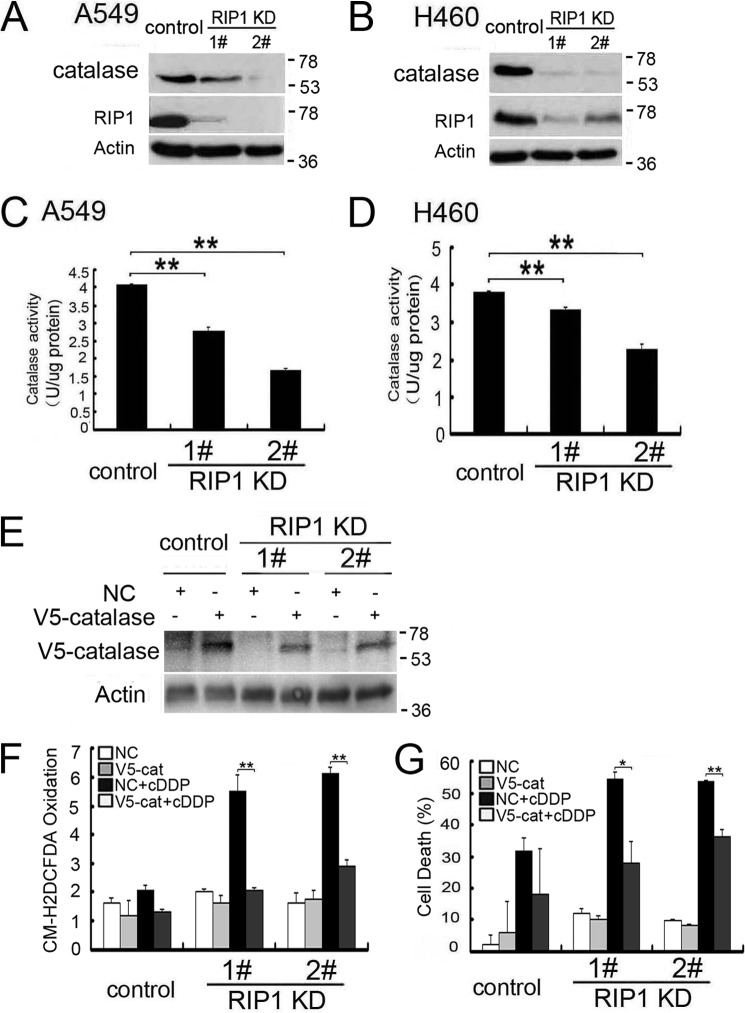
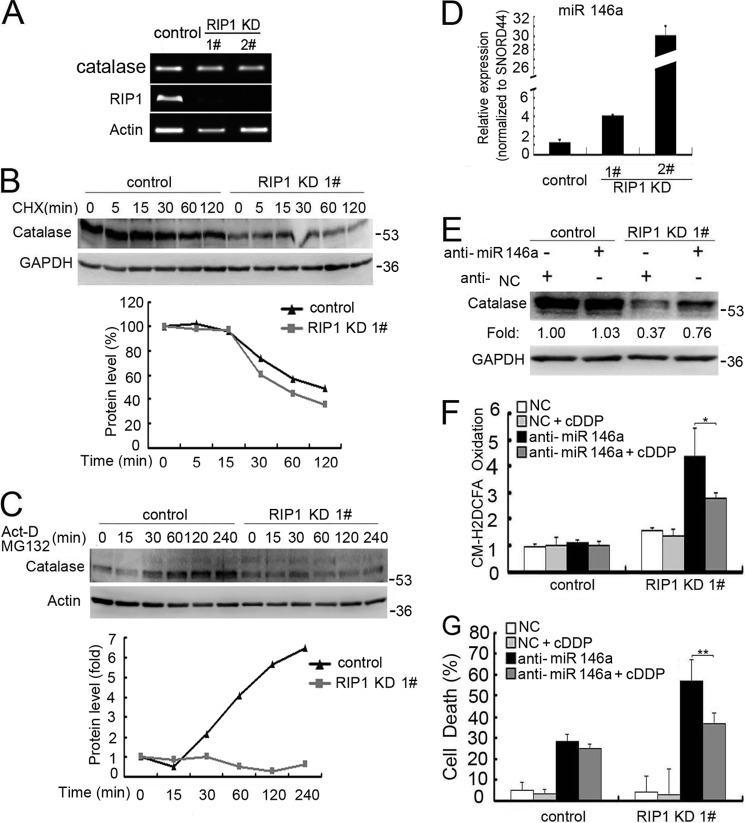
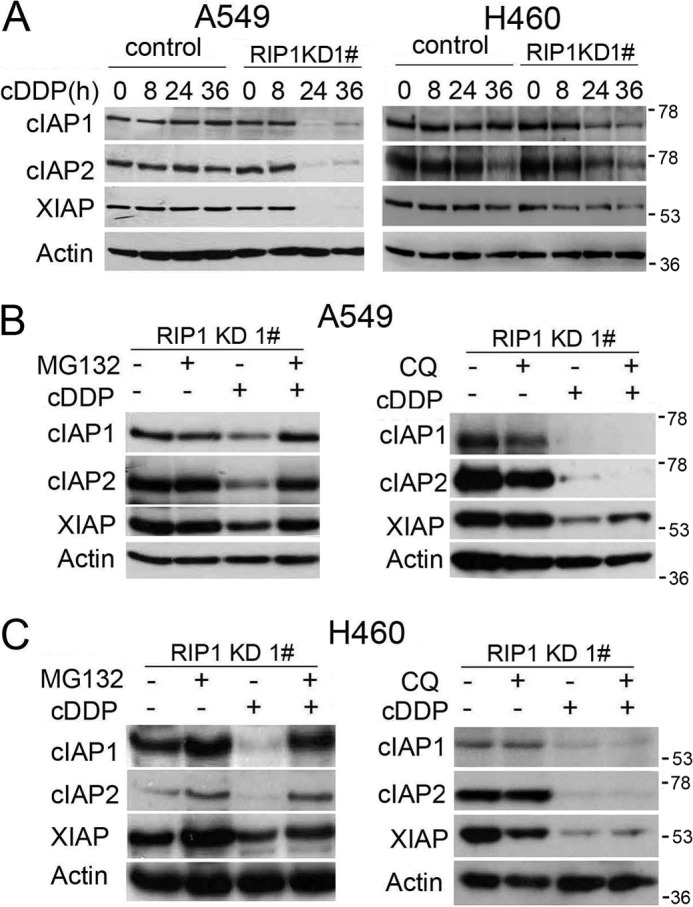
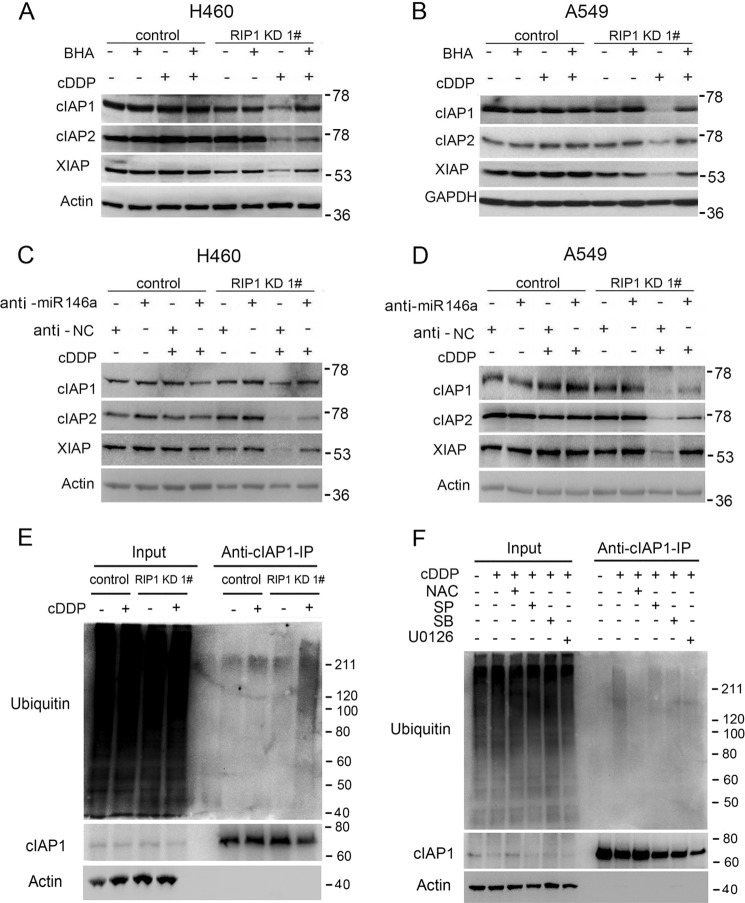
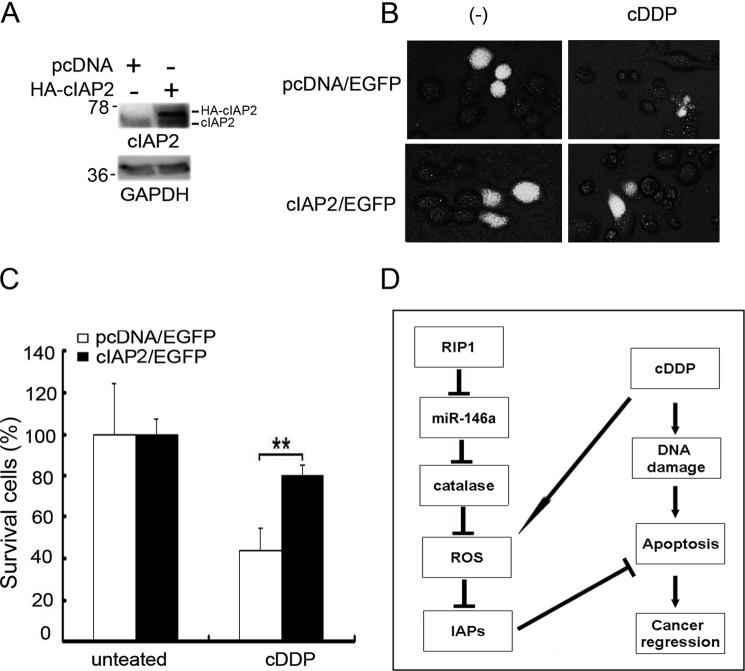
Although receptor-interacting protein 1 (RIP1) is well known as a key mediator in cell survival and death signaling, whether RIP1 directly contributes to chemotherapy response in cancer has not been determined. In this report, we found that, in human lung cancer cells, knockdown of RIP1 substantially increased cytotoxicity induced by the frontline anticancer therapeutic drug cisplatin, which has been associated with robust cellular reactive oxygen species (ROS) accumulation and enhanced apoptosis. Scavenging ROS dramatically protected RIP1 knockdown cells against cisplatin-induced cytotoxicity. Furthermore, we found that, in RIP1 knockdown cells, the expression of the hydrogen peroxide-reducing enzyme catalase was dramatically reduced, which was associated with increased miR-146a expression. Inhibition of microRNA-146a restored catalase expression, suppressed ROS induction, and protected against cytotoxicity in cisplatin-treated RIP1 knockdown cells, suggesting that RIP1 maintains catalase expression to restrain ROS levels in therapy response in cancer cells. Additionally, cisplatin significantly triggered the proteasomal degradation of cellular inhibitor of apoptosis protein 1 and 2 (c-IAP1 and c-IAP2), and X-linked inhibitor of apoptosis (XIAP) in a ROS-dependent manner, and in RIP1 knockdown cells, ectopic expression of c-IAP2 attenuated cisplatin-induced cytotoxicity. Thus, our results establish a chemoresistant role for RIP1 that maintains inhibitor of apoptosis protein (IAP) expression by release of microRNA-146a-mediated catalase suppression, where intervention within this pathway may be exploited for chemosensitization.

Keywords: Apoptosis; Chemoresistance; Lung Cancer; RIP; Reactive Oxygen Species (ROS).


Figures

FIGURE 1.
FIGURE 1.
Down-regulation of RIP1 sensitizes cisplatin-induced cytotoxicity. A, A549 and H460 cells (control and RIP1 stable knockdown) were treated with increasing concentrations of cisplatin (cDDP) for 48 h. Cell death was detected by lactate dehydrogenase release assay. Data are mean ± S.D. *, p < 0.05; **, p < 0.01. Knockdown of RIP1 was confirmed by Western blot analysis, and β-actin was used as an input control. B, A549 control and RIP1 KD1 cells were injected subcutaneously into the flanks of nude mice for the development of xenograft tumors. After tumor development, mice were randomly divided into two groups and subjected to the following treatments by intraperitoneal injection once a week for 5 weeks from day 13: vehicle control, and 6 mg/kg cisplatin. Tumor sizes were measured once or twice a week using calipers and were calculated using the following formula: tumor volume = 0.5 × (length × width2). Tumors were measured from 6–60 days post-injection, and the mean tumor size is shown as mean ± S.D. KD, knockdown. C, cells were untreated or treated with cisplatin (A549, 20 μm; H460, 10 μm for 24 h), and then active caspase 3 (Casp 3) and poly(ADP-ribose) polymerase (PARP) were examined by Western blot analysis. β-Actin was detected as an input control. D, A549 cells (control and RIP1 knockdown) were pretreated with zVAD (10 μm)) for 30 min and then treated with cisplatin (A549, 20 μm; H460 10 μm) for an additional 48 h. Cell death was detected by lactate dehydrogenase assay. Columns shown are mean ± S.D. *, p < 0.05; **, p < 0.01.
FIGURE 2.
FIGURE 2.
Cisplatin-induced intracellular ROS accumulation contributes to potentiated cytotoxicity in RIP1 knockdown cells. A and C, cells were treated with cisplatin (cDDP, 20 μm for A549, 10 μm for H460) for 12 h and incubated with CM-H2DCFDA (5 μm) for 30 min before being collected for ROS detection. Data are mean ± S.D. *, p < 0.05; **, p < 0.01. KD, knockdown. B and D, cells were pretreated with the indicated ROS scavengers (BHA, 100 μm; NAC, 3 mm) for 30 min and then treated with cisplatin (20 μm for A549; 10 μm for H460) for another 48 h. Cytotoxicity was detected by lactate dehydrogenase release assay. Data are mean ± S.D. *, p < 0.05; **, p < 0.01.
FIGURE 3.
FIGURE 3.
Reduced catalase expression and activity is involved in cisplatin-induced cytotoxicity in RIP1 knockdown cells. A and B, catalase expression in the indicated cells was detected by Western blot analysis, and β-actin was detected as an input control. KD, knockdown. C and D, catalase activity of A549 and H460 cells (control and RIP1 knockdown) were detected as described in the text. Data are mean ± S.D. **, p < 0.01. E, cells were infected with control and catalase viruses for 24 h. V5-catalase expression in the indicated cells was detected by Western blot analysis, and β-actin was detected as an input control. F, cells were infected with control and catalase viruses for 24 h, then treated with cisplatin (cDDP, 20 μm) for 12 h, and incubated with CM-H2DCFDA (5 μm) for 30 min before being collected for ROS detection. Data are mean ± S.D. **, p < 0.01. V5-cat, V5-catalase. G, cells were infected with control and catalase viruses for 24 h, treated with cisplatin (20 μm), or left untreated for 48 h. Cell death was detected by lactate dehydrogenase release assay. Data are mean ± S.D. *, p < 0.05; **, p < 0.01.
FIGURE 4.
FIGURE 4.
miR-146a mediates catalase suppression in RIP1 knockdown cells. A, A549 cells (control and RIP1 knockdown (KD)) were collected for RNA isolation with TRIzol reagent. Catalase and RIP1 mRNA levels were detected by PCR, and β-actin was detected as an input control. B, A549 cells (control and RIP1 knockdown) were treated with cycloheximide (CHX, 10 μg/ml) for the indicated time points. Catalase was detected by Western blot analysis. GAPDH was used as the input control. The intensity of the individual bands was quantified by Quantity One® software and normalized to the corresponding input control (GAPDH) bands. C, A549 (control and RIP1 knockdown) cells were pretreated with cycloheximide (10 μg/ml) for 16 h. Then, the culture medium was refreshed, and cells were treated with the proteasome inhibitor MG-132 (10 μm) and actinomycin D (Act-D,5 μg/ml) for the indicated times. Catalase and β-actin were detected by Western blot analysis. The intensity of the individual bands was quantified as described in A. D, A549 cells (control and RIP1 knockdown) were collected for RNA isolation with TRIzol reagent, and miR-146a expression was detected by quantitative real-time PCR. E, A549 RIP1 knockdown cells were transfected with a negative control (NC) or miR-146a siRNA (10 nm) for 48 h, catalase expression was detected by Western blot analysis, and GAPDH was used as an input control. F, A549 cells were transfected with the indicated siRNA (10 nm) for 24h and then treated with cisplatin (cDDP, 20 μm) for 12 h. Before collection for ROS detection, cells were incubated with CM-H2DCFDA (5 μm) for 30 min. Data are mean ± S.D. *, p < 0.05. G, A549 cells transfected with a negative control or an miR-146a miScript miRNA inhibitor for 24 h, and then the cells were left untreated or treated with cisplatin for an additional 48 h. Cell death was detected by lactate dehydrogenase assay. Data are mean ± S.D. **, p < 0.01.
FIGURE 5.
FIGURE 5.
RIP1 suppresses proteasomal degradation of IAPs induced by cisplatin. A, A549 and H460 cells (control and RIP1 knockdown (KD)) were treated with cisplatin (cDDP, 20 μm for A549, 10 μm for H460) or remained untreated for the indicated times. IAPs were detected by Western blot analysis. β-Actin was used as the input control. C, cells were pretreated with the proteasome inhibitor MG-132 (10 μm) or chloroquine (CQ, 20 μm) for 30 min and then treated with cisplatin (cDDP, 20 μm for A549, 10 μm for H460) for 24 h. The indicated proteins were detected by Western blot analysis. β-Actin was used as an input control.
FIGURE 6.
FIGURE 6.
Cisplatin-induced degradation of IAPs in RIP1 knockdown cells is ROS-dependent. A and B, A549 and H460 (control and RIP1 knockdown (KD)) cells were pretreated with the indicated ROS scavengers (BHA, 100 μm; NAC, 3 mm) for 30 min and then treated with cisplatin (cDDP, 20 μm for A549, 10 μm for H460) for another 24 h. The indicated proteins were detected by Western blot analysis, and β-actin and GAPDH were used as input controls. C and D, A549 and H460 (control and RIP1 knockdown) cells were transfected with a negative control (NC) or an miR-146a miScript miRNA inhibitor (10 nm) for 24 h and then treated (20 μm for A549, 10 μm for H460) for another 24 h. The indicated proteins were detected by Western blot analysis, and β-Actin was used as input control. E, A549 (control and RIP1 knockdown) cells were treated with cisplatin (20 μm) for 16 h. The indicated proteins were detected by Western blot analysis after coimmunoprecipitation (IP) with an antibody for cIAP1. β-Actin was used as input control. F, A549 RIP1 knockdown cells were pretreated with the JNK inhibitor SP600125 (SP, 10 μm), the ERK inhibitor U0126 (10 μm), the p38 inhibitor SB203580 (SB, 5 μm), and the ROS scavenger NAC (3 mm) for 30 min and then treated with cisplatin (20 μm) for 16 h. The indicated proteins were detected by Western blot analysis after coimmunoprecipitation with an antibody for cIAP1. β-Actin was detected as an input control.
FIGURE 7.
FIGURE 7.
Ectopic expression of c-IAP2 protects RIP1 knockdown cells from cisplatin-induced cytotoxicity. A, cIAP2 or empty vector pcDNA were coexpressed with the readout marker EGFP inA549 RIP1 knockdown cells by overnight ectopic transfection. Transfection efficiency was confirmed by Western blot analysis with an anti-cIAP2 antibody, and GAPDH was used as an input control. B, cells were treated with cisplatin (cDDP, 20 μm) for 24 h. Photographs were taken under a fluorescence microscope. C, quantification of survival cells with EGFP fluorescence was calculated. Data are mean ± S.D. **, p < 0.01. D, model of the function of RIP1 in cancer cell response to cisplatin.

Similar articles

Cited by

References

    1. Chang A. (2011) Chemotherapy, chemoresistance and the changing treatment landscape for NSCLC. Lung Cancer 71, 3–10 - PubMed
    1. Maione P., Rossi A., Sacco P. C., Bareschino M. A., Schettino C., Gridelli C. (2010) Advances in chemotherapy in advanced non-small-cell lung cancer. Expert Opin. Pharmacother. 11, 2997–3007 - PubMed
    1. Ulahannan S. V., Brahmer J. R. (2011) Antiangiogenic agents in combination with chemotherapy in patients with advanced non-small cell lung cancer. Cancer Invest. 29, 325–337 - PMC - PubMed
    1. Hanahan D., Weinberg R. A. (2011) Hallmarks of cancer. The next generation. Cell 144, 646–674 - PubMed
    1. Lin Y., Bai L., Chen W., Xu S. (2010) The NF-κB activation pathways, emerging molecular targets for cancer prevention and therapy. Expert Opin. Ther. Targets 14, 45–55 - PMC - PubMed

Publication types

MeSH terms