. 2014 Feb 21;289(8):4762-77.
doi: 10.1074/jbc.M113.530998. Epub 2014 Jan 14.

Hepatic gluconeogenesis is enhanced by phosphatidic acid which remains uninhibited by insulin in lipodystrophic Agpat2-/- mice

Affiliations

Hepatic gluconeogenesis is enhanced by phosphatidic acid which remains uninhibited by insulin in lipodystrophic Agpat2-/- mice

Shireesha Sankella et al. J Biol Chem. .

Abstract

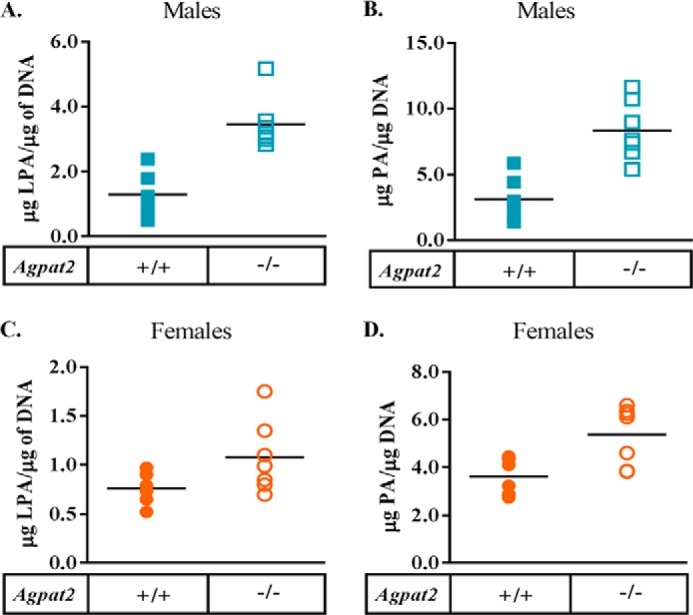
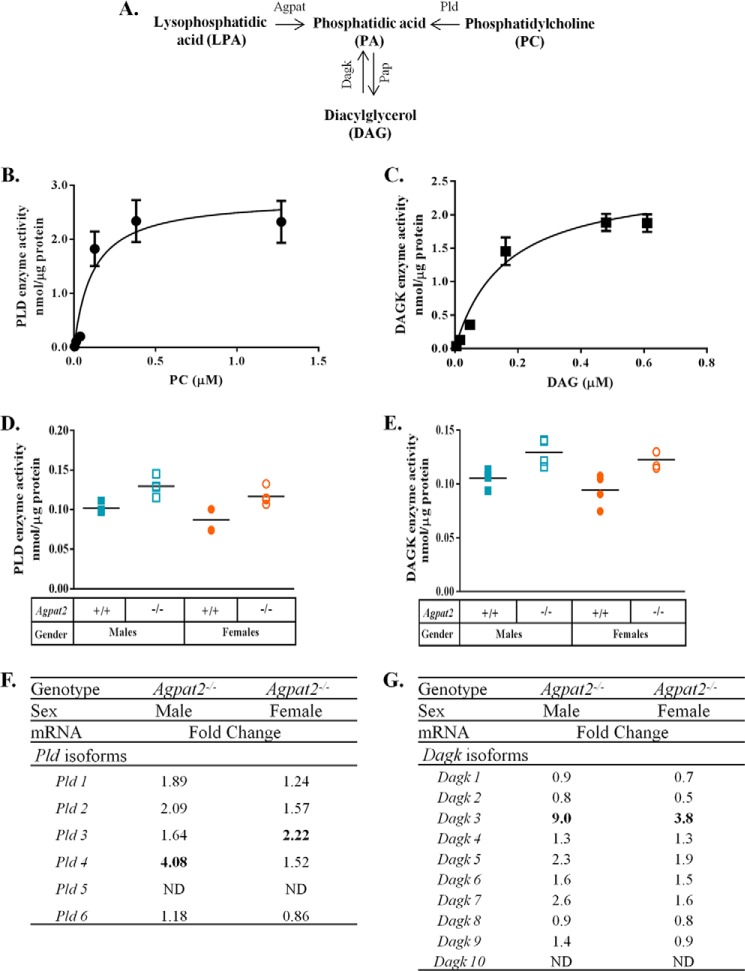
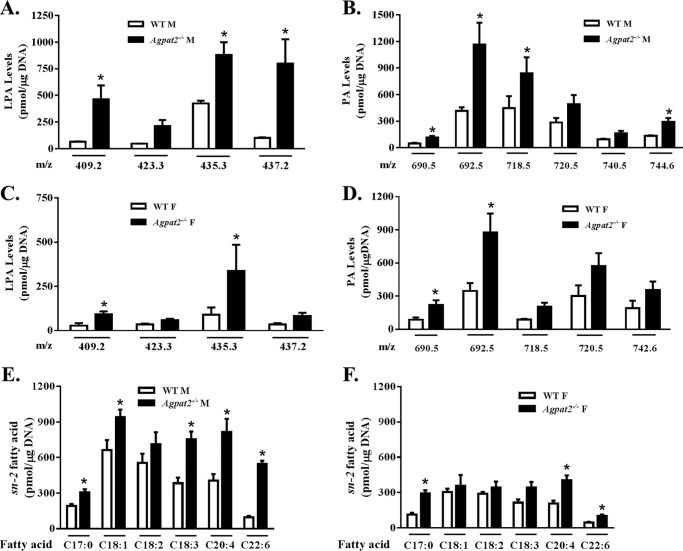
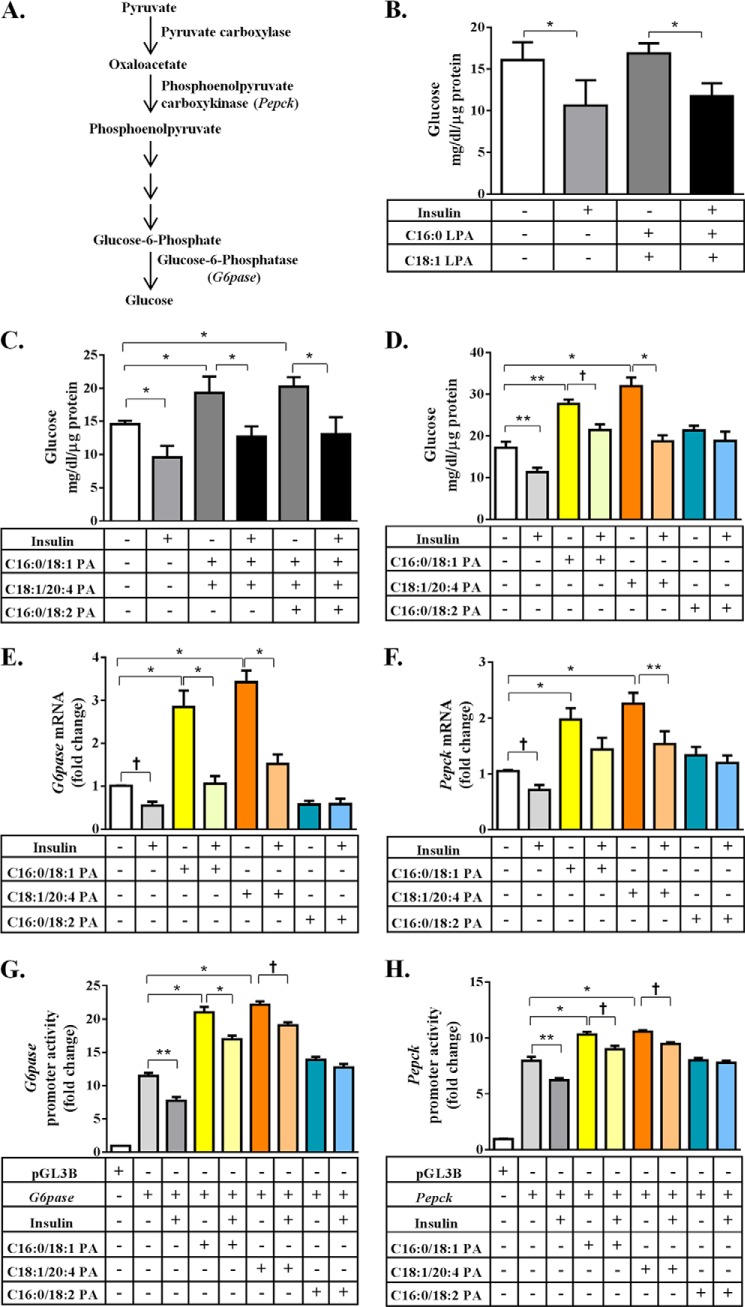
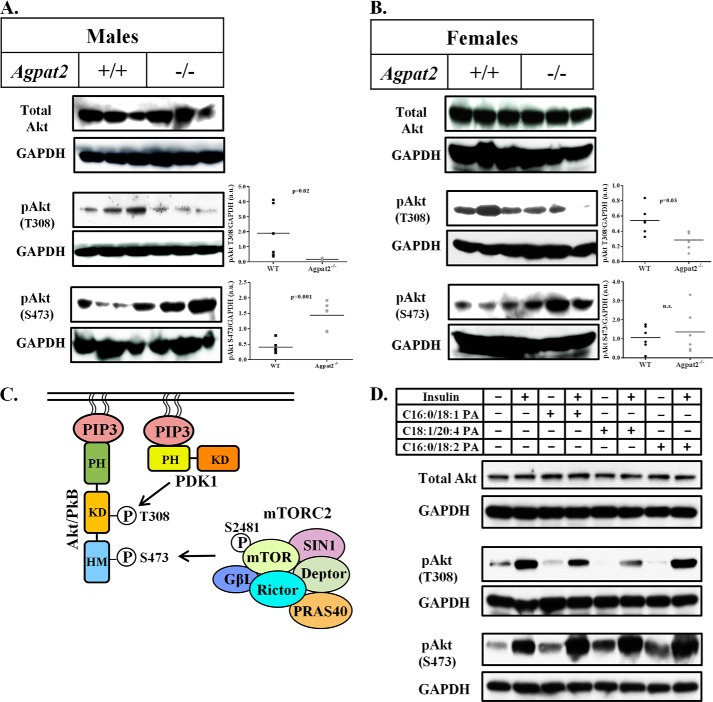
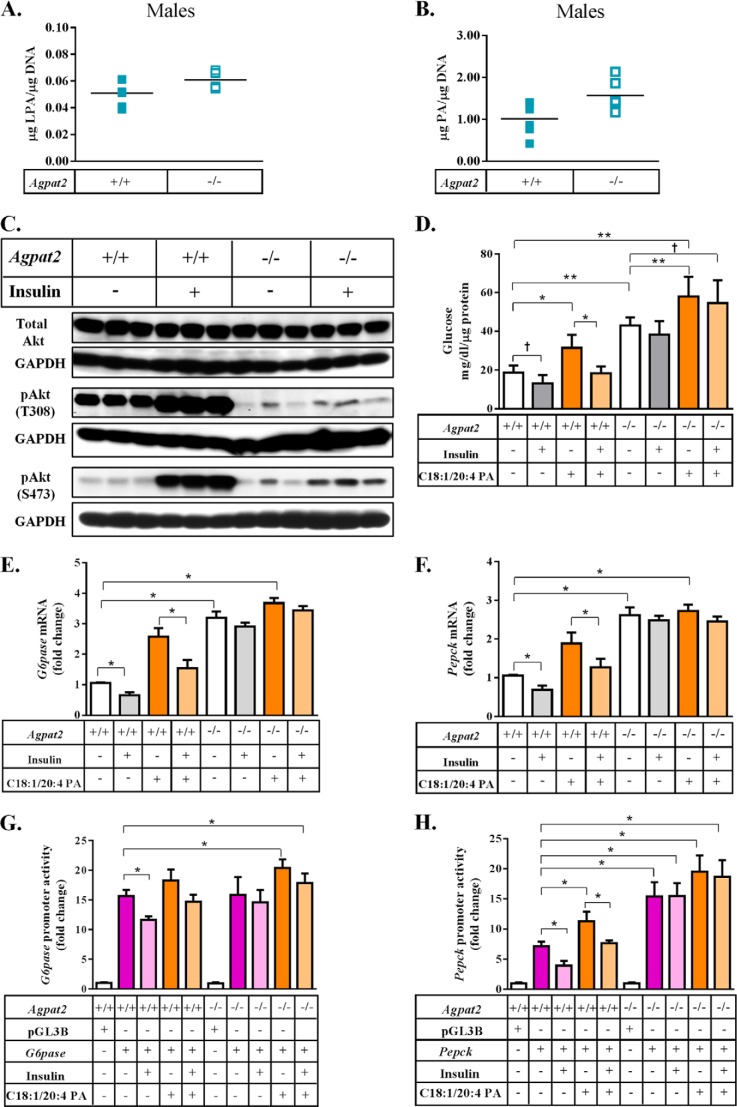
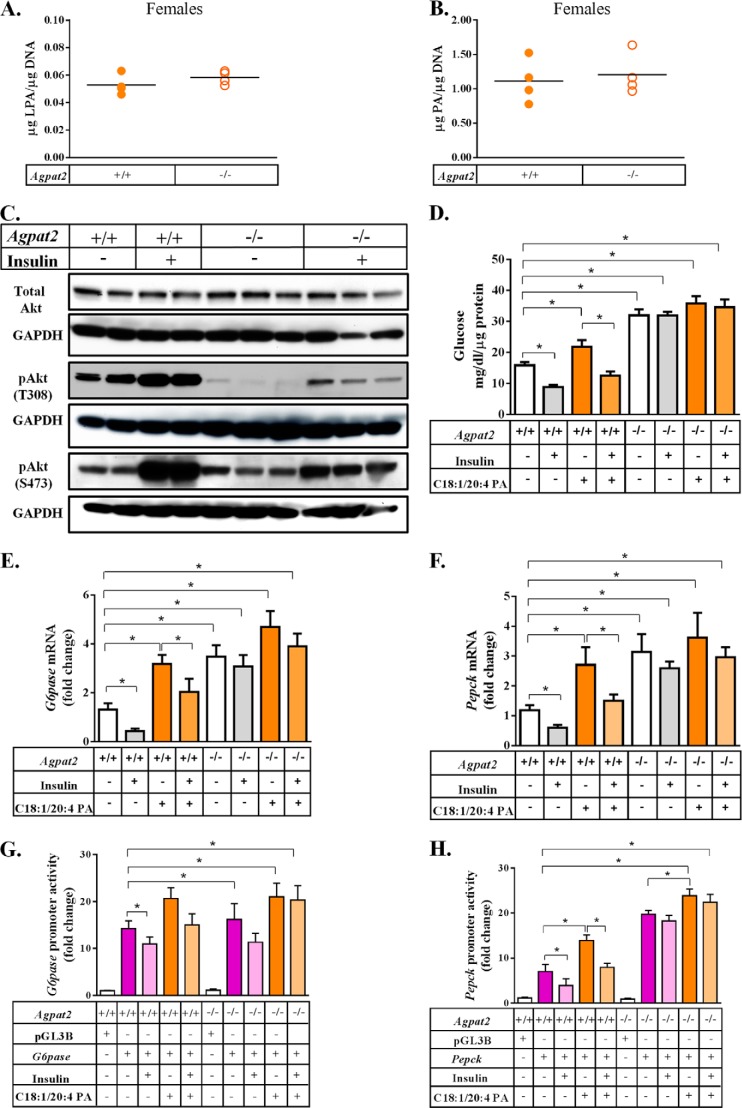
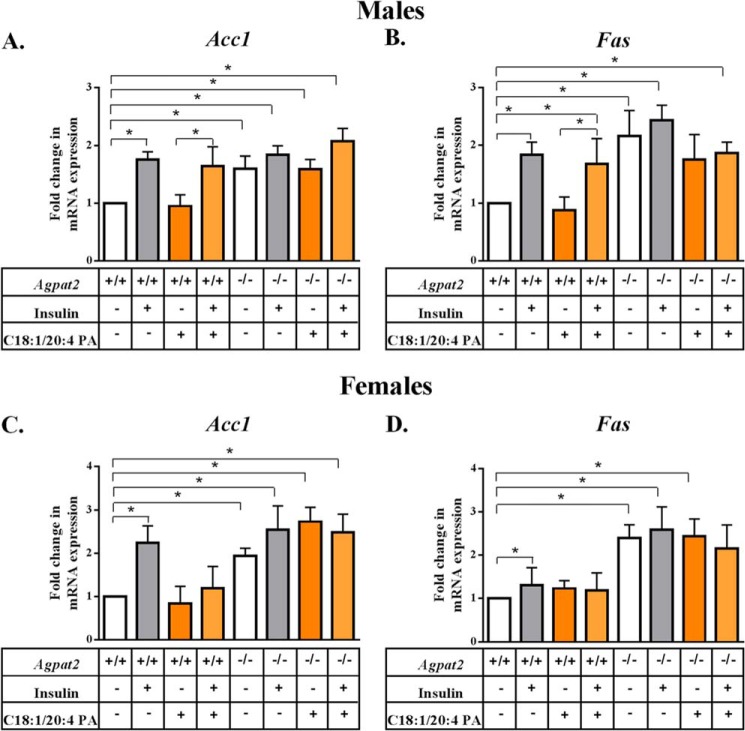
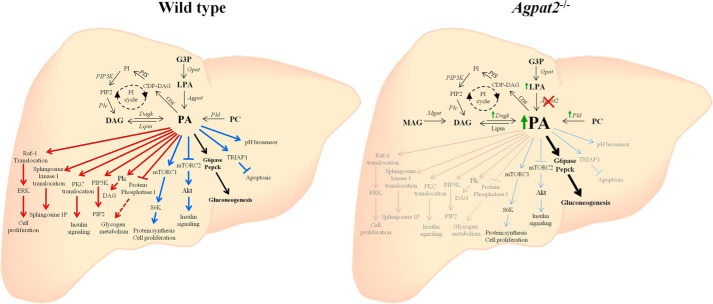
In this study we examined the role of phosphatidic acid (PA) in hepatic glucose production (HGP) and development of hepatic insulin resistance in mice that lack 1-acylglycerol-3-phosphate O-acyltransferase 2 (AGPAT2). Liver lysophosphatidic acid and PA levels were increased ∼2- and ∼5-fold, respectively, in male Agpat2(-/-) mice compared with wild type mice. In the absence of AGPAT2, the liver can synthesize PAs by activating diacylglycerol kinase or phospholipase D, both of which were elevated in the livers of Agpat2(-/-) mice. We found that PAs C16:0/18:1 and C18:1/20:4 enhanced HGP in primary WT hepatocytes, an effect that was further enhanced in primary hepatocytes from Agpat2(-/-) mice. Lysophosphatidic acids C16:0 and C18:1 failed to increase HGP in primary hepatocytes. The activation of HGP was accompanied by an up-regulation of the key gluconeogenic enzymes glucose-6-phosphatase and phosphoenolpyruvate carboxykinase. This activation was suppressed by insulin in the WT primary hepatocytes but not in the Agpat2(-/-) primary hepatocytes. Thus, the lack of normal insulin signaling in Agpat2(-/-) livers allows unrestricted PA-induced gluconeogenesis significantly contributing to the development of hyperglycemia in these mice.

Keywords: Gluconeogenesis; Insulin Resistance; Lipids; Lipodystrophy; Phosphatidic Acid.


Figures

FIGURE 1.
FIGURE 1.
Quantification of LPA and PA in the livers of wild type (WT) and Agpat2−/− mice. LPA and PA were extracted from the livers of 4-month-old WT and Agpat2−/− male and female livers. A and B, LPA and PA levels in WT and Agpat2−/− male livers normalized to DNA. Shown are individual LPA and PA values, n = 6. The p value for LPA and PA was <0.01. C and D, LPA and PA levels in WT and Agpat2−/− female livers normalized to DNA. Shown are individual LPA and PA values, n = 6. p value for PA = 0.01.
FIGURE 2.
FIGURE 2.
Increased levels of PA in the livers of male and female Agpat2−/− mice may be due to alternate pathways. A, schematic representation of the various pathways resulting in the synthesis of PA. PA can be generated by enzymes 1-acylglycerol-3-phosphate-O-acyltransferase (AGPAT), phospholipase D (PLD), and diacylglycerol kinase (DAGK). B, saturation curve for PLD enzyme. The apparent rate constants (Vmax) and the apparent affinity constant (Michaelis-Menten, Km) for PLD were determined from three individual livers and performed in triplicates (n = 3). Vmax was expressed as nanomole/μg of protein and Km was expressed as micromolar. C, saturation curve for DAGK enzyme. Vmax and Km for DAGK enzyme were determined from three individual livers and performed in triplicates (n = 3). Vmax was expressed as nanomole/μg of protein and Km was expressed as micromolar. D, PLD enzyme activity determined by the conversion of [3H]phosphatidylcholine to [3H]PA and expressed as nanomole of PA/μg of protein from liver lysates. Assays were performed with individual livers in duplicates (n = 4). The data indicate a statistically significant increase in PLD activity in the livers of Agpat2−/− mice compared with the WT of both genders with a p value of 0.012 in males and 0.023 in females. E, DAGK enzyme activity was determined by the conversion of 1,2-dioleoylglycerol to [32P]PA in the presence of [γ-32P] ATP and expressed as nanomole of PA/μg of protein from liver lysates. Assays were performed with individual livers in duplicates (n = 4). The data indicate a statistically significant increase in DAGK activity in the livers of Agpat2−/− mice compared with the WT of both genders with a p value of 0.03 in males and 0.024 in females. F and G, Q-PCR of various isoforms of Pld and Dagk analyzed in pooled samples (n = 6) from the livers of both genders of Agpat2−/− mice normalized to cyclophilin and expressed as a fold-change relative to WT mice. Pld3 was up-regulated in females, whereas Pld4 was up-regulated in males. Dagk3 was significantly up-regulated in the livers of both the genders. ND, not detected.
FIGURE 3.
FIGURE 3.
Determination of molecular species of LPA and PA in the livers of wild type and Agpat2−/− mice. A–D, charge-to-mass ratio (m/z) of various LPAs and PAs obtained from mass spectrometry (MS/MS) analysis. LPA and PA fractionated by HPLC were used for MS/MS analysis. LPA and PA levels are expressed as picomole/μg of DNA normalized to C13:0-LPA and C14:0, 17:1-PA (mean ± S.E.; n = 4 in each group). Although no distinct molecular species of PA were detected in the livers of Agpat2−/− mice, PA species 34:2, 34:2, 36:4, 36:3, 36:2, and 38:3 were found to be significantly increased in the livers compared with WT. E and F, levels of various fatty acids released upon digestion of extracted PA with PLA2. The released fatty acids were extracted with methanol/hexane (1:2, v/v). The dried lipid extract was resolved on TLC and the released fatty acid was methylated and resolved using gas chromatography. Fatty acids are expressed as picomole of free fatty acid/μg of DNA. All fatty acids were normalized to C19:0 fatty acid as the internal control (mean ± S.E.; n = 4 in each group). Based on m/z and sn-2 fatty acids four PAs, C16:0/18:2 PA, C16:0/18:1 PA, C18:0/20:3 PA, and C18:1/20:4 PA, were statistically significant. *, p value ≤ 0.05.
FIGURE 4.
FIGURE 4.
Enhanced gluconeogenesis in primary mouse hepatocytes in the presence of PA. A, schematic representation of the gluconeogenesis pathway. B, glucose output was measured in the culture medium from the WT primary mouse hepatocytes when tested with two LPAs: C16:0-LPA and 18:1-LPA in the ratio of 1:2. C, glucose output was measured in culture medium from the WT primary mouse hepatocytes when tested with two PAs: C16:0/18:1 PA and C18:1/20:4 PA, or three PAs: C16:0/18:1 PA, C18:1/20:4 PA, and C16:0/18:2 PA, in molar ratios of 1:0.5:0.5. D, glucose output was measured in culture medium from the WT primary mouse hepatocytes when transfected with C16:0/18:1 PA, C18:1/20:4 PA, and C16:0/18:2 PA individually and expressed as milligrams/dl/μg of protein. Shown are the mean ± S.E. from six independent experiments performed in duplicate. E and F, expression of mRNA for G6pase and Pepck analyzed by Q-PCR and normalized to cyclophilin. Shown is the fold-change compared with untransfected WT primary mouse hepatocytes (expressed as mean ± S.E., n = 4). The expression of both G6pase and Pepck increased in the presence of C16:0/18:1 PA and C18:1/20:4 PA but this effect was nullified by insulin. G and H, change in the promoter activities of G6pase and Pepck as measured by a dual luciferase assay and expressed as fold-changes compared with pGL3 basic in primary mouse hepatocytes (expressed as mean ± S.E.). Only the PAs that activated mRNA expression of G6pase and Pepck also activated their respective promoters (G6pase; n = 6 and Pepck; n = 5). The p values are shown above the bars: *, <0.001; **, <0.01; †, <0.05.
FIGURE 5.
FIGURE 5.
Decreased phosphorylation of Akt at Thr-308 in the livers of Agpat2−/− mice suggests that PA may have a specific effect on the different phosphorylated forms of Akt. A and B, immunoblotting of Akt and its phosphorylated forms, Akt-Thr-308 and Akt-Ser-473, in the livers of male and female WT and Agpat2−/− mice. Shown are representative immunoblots for total Akt, Akt-Thr-308, and Akt-Ser-473. The protein bands were normalized to GAPDH (n = 6). Phosphorylation of Akt at Thr-308 by PDK1 was significantly decreased in Agpat2−/− mice livers compared with those of WT livers. Interestingly, phosphorylation of Akt at Ser-473 by mTORC2 was increased in the livers of Agpat2−/− mice compared with WT mice. C, schematic representation of the PI3K-Akt pathway. PI3K catalyzes the conversion of membrane-bound PIP2 (phosphatidylinositol 4,5-biphosphate) to PIP3 (phosphatidylinositol 3,4,5-triphosphate). PIP3 binds to the pleckstrin homology domain of Akt, which results in activation through dimerization and exposure of its catalytic site. PIP3 also activates PDK1, which in turn phosphorylates Akt at Thr-308. D, immunoblot analysis of total Akt, pAkt-Thr-308, and pAkt-Ser-473, in the WT primary mouse hepatocytes transfected with C16:0/18:2 PA, C16:0/18:1 PA, and C18:1/20:4 PA. Total Akt remained unchanged in the presence of all three PAs. pAKT-Ser-473, a downstream target for mTORC2 remained unchanged in the presence of all three PAs but increased in the presence of insulin. Although pAkt-Thr-308 decreased in the presence of all three PAs, the phosphorylation was increased by insulin. As a loading control GAPDH was determined for each blot. Shown are representative immunoblots for total Akt, Akt-Thr-308, and Akt-Ser-473 from three independent experiments.
FIGURE 6.
FIGURE 6.
Primary mouse hepatocytes from Agpat2−/− male mice are insulin resistant. A and B, quantification of LPA and PA in primary mouse hepatocytes isolated from WT and Agpat2−/− male mice. The LPA remained unchanged in Agpat2−/− primary mouse hepatocytes when compared with WT hepatocytes. The PA levels showed a significant increase. Shown are means for LPA and PA. p value for PA levels = 0.03, n = 6. C, immunoblotting of Akt and its phosphorylated forms, Akt-Thr-308 and Akt-Ser-473, in primary mouse hepatocytes. Shown are representative immunoblots of total Akt and pAkt-Thr-308 and pAkt-Ser-473 from three independent mice. D, glucose output in primary hepatocytes from Agpat2−/− male mice. Shown are the mean ± S.E. (n = 6) performed in duplicate. C18:1/20:4 PA increased the glucose output in primary hepatocytes from Agpat2−/− male mice, and insulin was unable to suppress gluconeogenesis. E and F, fold-change (expressed as mean ± S.E., n = 4) of G6pase and Pepck normalized to cyclophilin. The expression of both gluconeogenic genes was increased in the presence of C18:1/20:4 PA. Insulin failed to suppress gluconeogenesis. G and H, change in promoter activity of G6pase and Pepck as measured by dual luciferase assay and expressed as fold-change compared with pGL3 basic in primary mouse hepatocytes from Agpat2−/− male mice (expressed as mean ± S.E., n = 4). The p values are shown above the bars (*, <0.001; **, <0.01; †, <0.05).
FIGURE 7.
FIGURE 7.
Primary hepatocytes from Agpat2−/− female mice are insulin resistant. A and B, quantification of LPA and PA in primary hepatocytes isolated from WT and Agpat2−/− female mice. The LPA and PA levels remained unchanged in Agpat2−/− hepatocytes when compared with WT hepatocytes, n = 4. C, immunoblot analysis of total Akt and its phosphorylated forms, pAkt-Thr-308 and pAkt-Ser-473. D, glucose output in primary hepatocytes isolated from Agpat2−/− female mice. C18:1/20:4 PA increased glucose output in primary hepatocytes and insulin was unable to suppress the gluconeogenesis, n = 4. E and F, expression of G6pase and Pepck was analyzed by Q-PCR and normalized to cyclophilin. The expression of both gluconeogenic genes was increased in the presence of PA. Insulin failed to suppress gluconeogenesis (n = 4). G and H, change in promoter activity of G6pase and Pepck as measured by the dual luciferase assay and expressed as fold-change compared with pGL3 basic in primary hepatocytes from Agpat2−/− female mice (expressed as mean ± S.E., n = 4). The p values are shown above the bars (*, <0.001; **, <0.01; †, <0.05).
FIGURE 8.
FIGURE 8.
Hepatic lipogenesis is independent of PA induction. A and B, expression of mRNA for Acc1 and Fas in primary hepatocytes from wild type (WT) and Agpat2−/− male mice. Acc1 and Fas were analyzed by Q-PCR and normalized to cyclophilin. Shown are the fold-changes compared with untransfected WT primary mouse hepatocytes (expressed as mean ± S.E., n = 4). The expression of both Acc1 and Fas remained unchanged in the presence of C18:1/20:4 PA. C and D, expression of mRNA for Acc1 and Fas in hepatocytes isolated from WT and Agpat2−/− female mice. Acc1 and Fas were analyzed similar to the male mice. The expression of both Acc1 and Fas remained unchanged in the presence of C18:1/20:4 PA. The p values are shown above the bars (*, <0.05).
FIGURE 9.
FIGURE 9.
Schematic of the various pathways, both known and speculative, leading to synthesis of PA and its function in liver. PA can be formed in four different ways: 1) glycerol-3-phosphate (G3P) is acylated by glycerol-3-phosphate acyltransferase (Gpat) to form LPA with further acylation of LPA to PA by 1-acylglycerol-3-phosphate-O-acyltransferase (Agpats); 2) hydrolysis of phosphatidylcholine (PC) to PA by phospholipase D (PLD); 3) phosphorylation of DAG to PA by diacylglycerol kinase (Dagk); and 4) by the PI cycle. In PI cycle, PA is converted to cytidine diphosphate-diacylglycerol (CDP-DAG) an intermediate for the synthesis of PI in the presence of cytidine diphosphate-diacylglycerol synthase (CDS). CDP-DAG is converted to PI by PI synthase (PIS). The conversion of PI to PI-4,5-bisphosphate (PIP2) is carried out by PI 4-phosphate 5-kinase (PIP5K). DAG can be formed by hydrolysis of PIP2 by phospholipase C (Plc). This is a speculative PA synthesis cycle that awaits experimental confirmation. In certain pathological conditions as in the Agpat2−/− lipodystrophic mouse, DAG can be synthesized by acylation of monacylglycerol (MAG) by monoacylglycerol acyltransferase (MGAT1) (7) or by de-phosphorylation of PA by lipin. Mgat1 is not expressed in the livers of adult wild type mouse. PA is a lipid signaling molecule and modulates multiple pathways occurring at various subcellular sites in the cell. The role of PA at the membrane level is shown in red arrows, in the cytoplasm in blue arrows, and at the lysosomal level in green arrows. The most important and novel finding of our study is regulation of gluconeogenesis by PA, which is shown in black arrows. The role of PAs as a cellular pH sensor is shown in pink. These various pathways shown are compiled from the published literature. Raf-1, rapidly accelerated fibrosarcoma proto-oncogene serine/threonine-protein kinase (39); ERK, extracellular signal-regulated kinase; PKC, protein kinase C (40); mTORC1, mammalian target of rapamycin complex 1 (9); S6K, ribosomal protein S6 kinase; mTORC2, mammalian target of rapamycin complex 2 (35); Akt, protein kinase B; G6pase, glucose-6-phosphatase; Pepck, phosphoenolpyruvate carboxykinase (this study); TRIAP1, tumor protein p53 regulated inhibitor of apoptosis 1 (41); pH biosensor (42); sphingosine kinase (43); PIP5K, phosphatidylinositol 4-phosphate 5-kinase (44); Plc, phospholipase C (45); and Pp1, protein phosphatase 1 (26).

Similar articles

Cited by

References

    1. Agarwal A. K., Garg A. (2003) Congenital generalized lipodystrophy. Significance of triglyceride biosynthetic pathways. Trends Endocrinol. Metab. 14, 214–221 - PubMed
    1. Coleman R. A., Lee D. P. (2004) Enzymes of triacylglycerol synthesis and their regulation. Prog Lipid Res. 43, 134–176 - PubMed
    1. Agarwal A. K. (2012) Lysophospholipid acyltransferases. 1-Acylglycerol-3-phosphate O-acyltransferases. From discovery to disease. Curr. Opin Lipidol. 23, 290–302 - PubMed
    1. Agarwal A. K., Arioglu E., De Almeida S., Akkoc N., Taylor S. I., Bowcock A. M., Barnes R. I., Garg A. (2002) AGPAT2 is mutated in congenital generalized lipodystrophy linked to chromosome 9q34. Nat. Genet. 31, 21–23 - PubMed
    1. Vantyghem M. C., Balavoine A. S., Douillard C., Defrance F., Dieudonne L., Mouton F., Lemaire C., Bertrand-Escouflaire N., Bourdelle-Hego M. F., Devemy F., Evrard A., Gheerbrand D., Girardot C., Gumuche S., Hober C., Topolinski H., Lamblin B., Mycinski B., Ryndak A., Karrouz W., Duvivier E., Merlen E., Cortet C., Weill J., Lacroix D., Wemeau J. L. (2012) How to diagnose a lipodystrophy syndrome. Ann. Endocrinol. 73, 170–189 - PubMed

Publication types

MeSH terms