Monitoring sound to quantify snoring and sleep apnea severity using a smartphone: proof of concept
- PMID: 24426823
- PMCID: PMC3869073
- DOI: 10.5664/jcsm.3364
Monitoring sound to quantify snoring and sleep apnea severity using a smartphone: proof of concept
Abstract
Study objectives: Habitual snoring is a prevalent condition that is not only a marker of obstructive sleep apnea (OSA) but can also lead to vascular risk. However, it is not easy to check snoring status at home. We attempted to develop a snoring sound monitor consisting of a smartphone alone, which is aimed to quantify snoring and OSA severity.
Methods: The subjects included 50 patients who underwent diagnostic polysomnography (PSG), of which the data of 10 patients were used for developing the program and that of 40 patients were used for validating the program. A smartphone was attached to the anterior chest wall over the sternum. It acquired ambient sound from the built-in microphone and analyzed it using a fast Fourier transform on a real-time basis.
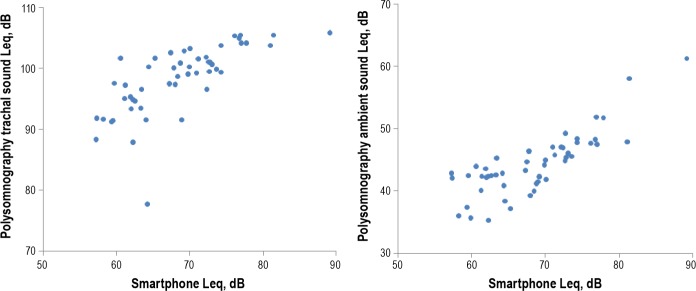
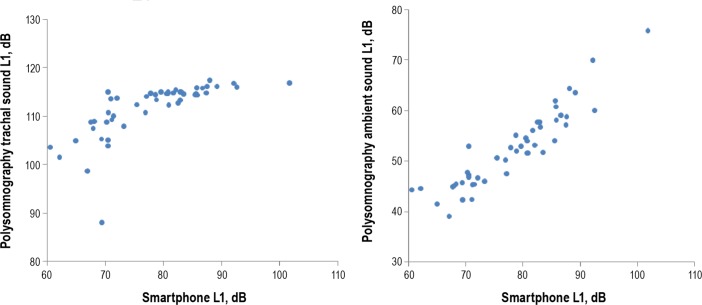
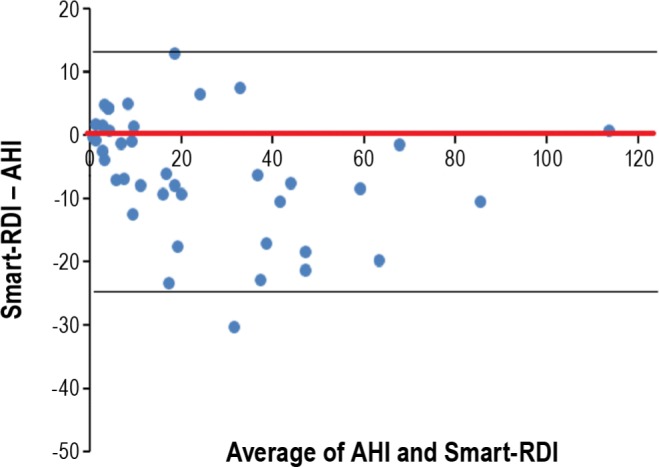
Results: Snoring time measured by the smartphone highly correlated with snoring time measured by PSG (r = 0.93). The top 1 percentile value of sound pressure level (L1) determined by the smartphone correlated with the ambient sound L1 during sleep determined by PSG (r = 0.92). Moreover, the respiratory disturbance index estimated by the smartphone (smart-RDI) highly correlated with the apnea-hypopnea index (AHI) obtained by PSG (r = 0.94). The diagnostic sensitivity and specificity of the smart-RDI for diagnosing OSA (AHI ≥ 15) were 0.70 and 0.94, respectively.
Conclusions: A smartphone can be used for effectively monitoring snoring and OSA in a controlled laboratory setting. Use of this technology in a noisy home environment remains unproven, and further investigation is needed.
Keywords: Snoring; home monitoring; obstructive sleep apnea; smartphone.
Figures


Comment on
-
Does my bed partner have OSA? There's an app for that!J Clin Sleep Med. 2014 Jan 15;10(1):79-80. doi: 10.5664/jcsm.3366. J Clin Sleep Med. 2014. PMID: 24426824 Free PMC article. No abstract available.
References
-
- Young T, Palta M, Dempsey J, Skatrud J, Weber S, Badr S. The occurrence of sleep-disordered breathing among middle-aged adults. N Engl J Med. 1993;328:1230–5. - PubMed
-
- Kim J, In K, Kim J, et al. Prevalence of sleep-disordered breathing in middle-aged Korean men and women. Am J Respir Crit Care Med. 2004;170:1108–13. - PubMed
-
- Cano-Pumarega I, Dura'n-Cantolla J, Aizpuru F, et al. Obstructive sleep apnea and systemic hypertension. Am J Respir Crit Care Med. 2011;184:1299–304. - PubMed
Publication types
MeSH terms
LinkOut - more resources
Full Text Sources
Other Literature Sources