

Synchronization of neuron population subject to steady DC electric field induced by magnetic stimulation
- PMID: 24427204
- PMCID: PMC3654152
- DOI: 10.1007/s11571-012-9233-x
Synchronization of neuron population subject to steady DC electric field induced by magnetic stimulation
Abstract
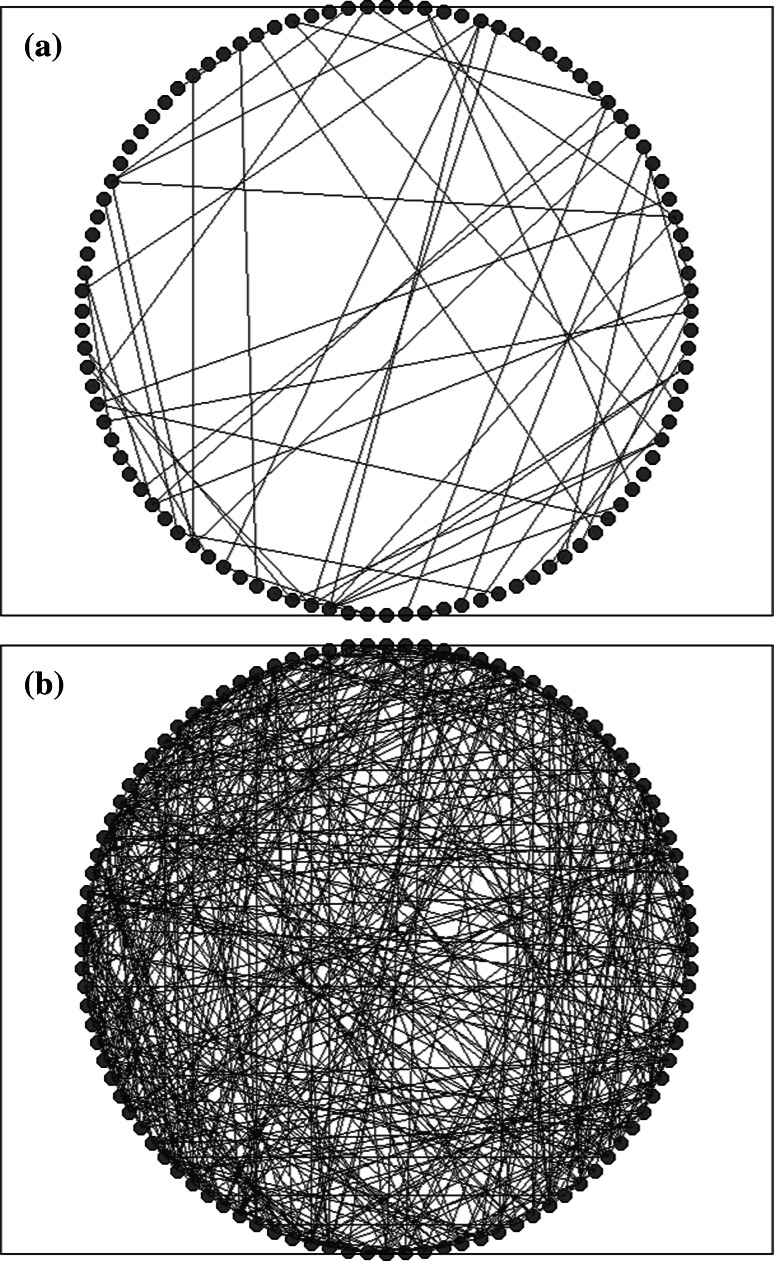
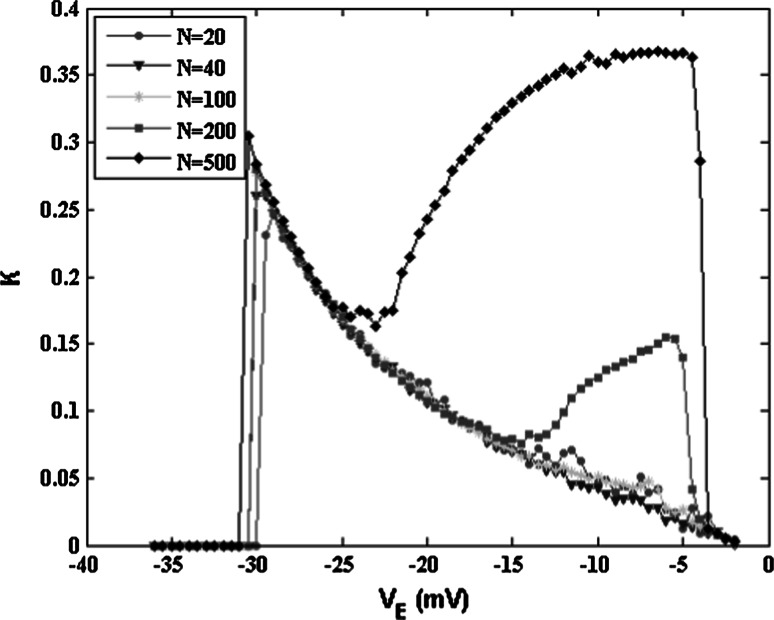
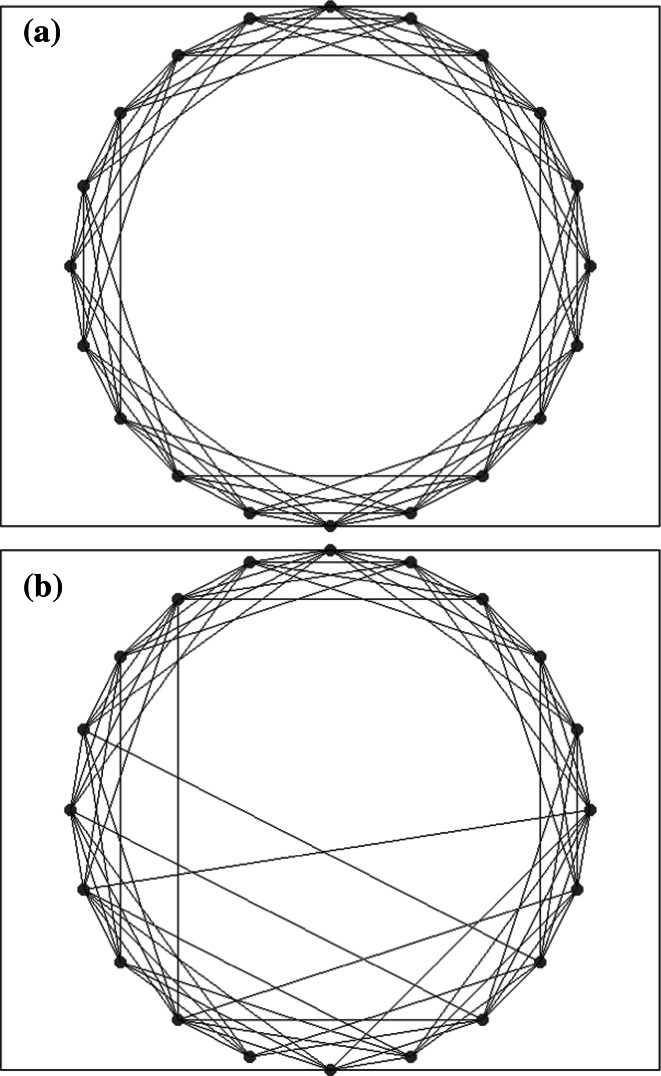
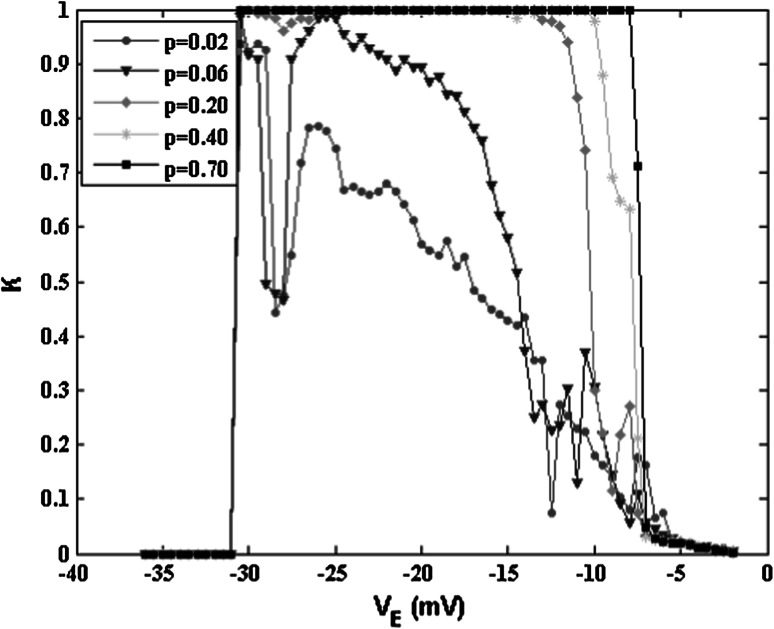
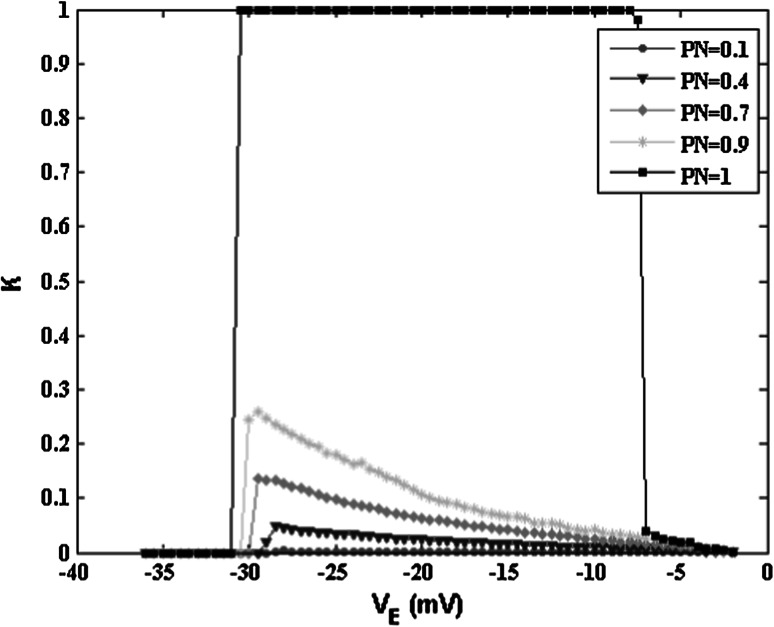
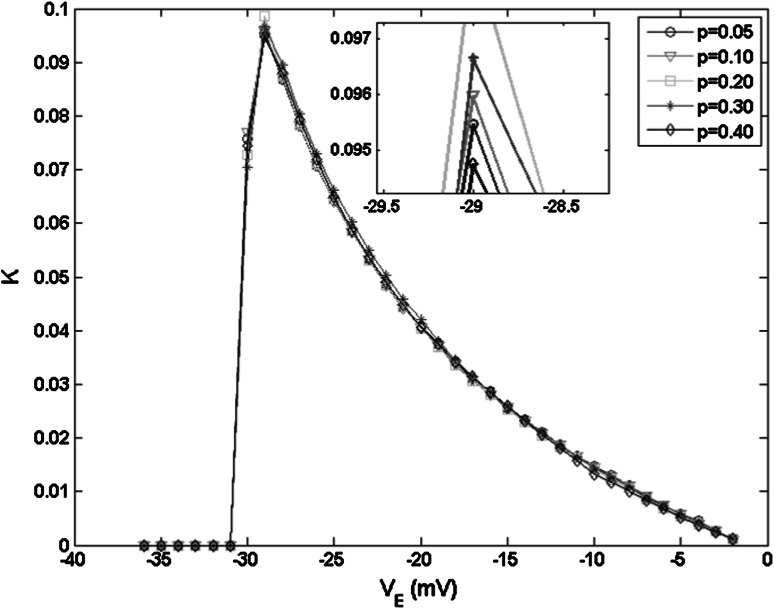
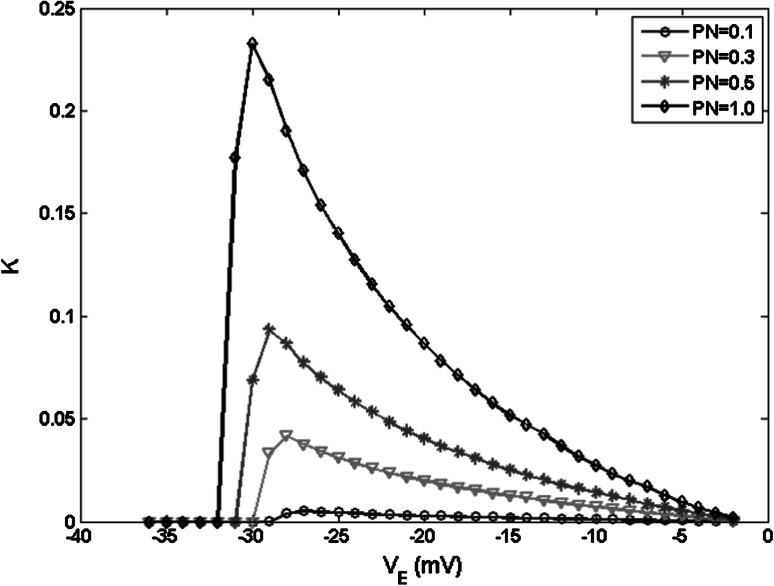
Electric fields, which are ubiquitous in the context of neurons, are induced either by external electromagnetic fields or by endogenous electric activities. Clinical evidences point out that magnetic stimulation can induce an electric field that modulates rhythmic activity of special brain tissue, which are associated with most brain functions, including normal and pathological physiological mechanisms. Recently, the studies about the relationship between clinical treatment for psychiatric disorders and magnetic stimulation have been investigated extensively. However, further development of these techniques is limited due to the lack of understanding of the underlying mechanisms supporting the interaction between the electric field induced by magnetic stimulus and brain tissue. In this paper, the effects of steady DC electric field induced by magnetic stimulation on the coherence of an interneuronal network are investigated. Different behaviors have been observed in the network with different topologies (i.e., random and small-world network, modular network). It is found that the coherence displays a peak or a plateau when the induced electric field varies between the parameter range we defined. The coherence of the neuronal systems depends extensively on the network structure and parameters. All these parameters play a key role in determining the range for the induced electric field to synchronize network activities. The presented results could have important implications for the scientific theoretical studies regarding the effects of magnetic stimulation on human brain.
Keywords: Magnetic stimulation; Steady DC electric field; Synchronization; Topology.
Figures


Similar articles
-
Exploring how extracellular electric field modulates neuron activity through dynamical analysis of a two-compartment neuron model.J Comput Neurosci. 2014 Jun;36(3):383-99. doi: 10.1007/s10827-013-0479-z. Epub 2013 Sep 22. J Comput Neurosci. 2014. PMID: 24057225
-
Ih interacts with somato-dendritic structure to determine frequency response to weak alternating electric field stimulation.J Neurophysiol. 2018 Mar 1;119(3):1029-1036. doi: 10.1152/jn.00541.2017. Epub 2017 Nov 29. J Neurophysiol. 2018. PMID: 29187553 Free PMC article.
-
Electric field-induced effects on neuronal cell biology accompanying dielectrophoretic trapping.Adv Anat Embryol Cell Biol. 2003;173:III-IX, 1-77. doi: 10.1007/978-3-642-55469-8. Adv Anat Embryol Cell Biol. 2003. PMID: 12901336 Review.
-
Neuron matters: electric activation of neuronal tissue is dependent on the interaction between the neuron and the electric field.J Neuroeng Rehabil. 2015 Aug 12;12:65. doi: 10.1186/s12984-015-0061-1. J Neuroeng Rehabil. 2015. PMID: 26265444 Free PMC article. Review.
-
Relation between the electric field and activation of cortical neurons in transcranial electrical stimulation.Brain Stimul. 2019 Mar-Apr;12(2):275-289. doi: 10.1016/j.brs.2018.11.004. Epub 2018 Nov 10. Brain Stimul. 2019. PMID: 30449635
Cited by
-
Collective responses in electrical activities of neurons under field coupling.Sci Rep. 2018 Jan 22;8(1):1349. doi: 10.1038/s41598-018-19858-1. Sci Rep. 2018. PMID: 29358677 Free PMC article.
-
An ephaptic transmission model of CA3 pyramidal cells: an investigation into electric field effects.Cogn Neurodyn. 2014 Jun;8(3):177-97. doi: 10.1007/s11571-013-9269-6. Epub 2013 Oct 5. Cogn Neurodyn. 2014. PMID: 24808928 Free PMC article.
-
Topology of eeg wave fronts.Cogn Neurodyn. 2021 Oct;15(5):887-896. doi: 10.1007/s11571-021-09668-z. Epub 2021 Feb 17. Cogn Neurodyn. 2021. PMID: 34603549 Free PMC article.
-
A linear model for characterization of synchronization frequencies of neural networks.Cogn Neurodyn. 2014 Feb;8(1):55-69. doi: 10.1007/s11571-013-9263-z. Epub 2013 Jul 23. Cogn Neurodyn. 2014. PMID: 24465286 Free PMC article.
-
The Effects of Medium Spiny Neuron Morphologcial Changes on Basal Ganglia Network under External Electric Field: A Computational Modeling Study.Front Comput Neurosci. 2017 Oct 26;11:91. doi: 10.3389/fncom.2017.00091. eCollection 2017. Front Comput Neurosci. 2017. PMID: 29123477 Free PMC article.
References
-
- Andrews-Zwilling Y, Gillespie AK, Kravitz AV, Nelson AB, Devidze N, Lo I, Yoon SY, Bien-Ly N, Ring K, Zwilling D, Potter GB, Rubenstein JL, Kreitzer AC, Huang Y. Hilar GABAergic interneuron activity controls spatial learning and memory retrieval. PLoS ONE. 2012;7(7):e40555. doi: 10.1371/journal.pone.0040555. - DOI - PMC - PubMed
LinkOut - more resources
Full Text Sources
