. 2014 Jan 10;9(1):e79055.
doi: 10.1371/journal.pone.0079055. eCollection 2014.

Frontal-subcortical volumetric deficits in single episode, medication-naïve depressed patients and the effects of 8 weeks fluoxetine treatment: a VBM-DARTEL study

Affiliations

Frontal-subcortical volumetric deficits in single episode, medication-naïve depressed patients and the effects of 8 weeks fluoxetine treatment: a VBM-DARTEL study

Lingtao Kong et al. PLoS One. .

Abstract

Background: Convergent studies suggest that morphological abnormalities of frontal-subcortical circuits which involved with emotional and cognitive processing may contribute to the pathophysiology of major depressive disorder (MDD). Antidepressant treatment which has been reported to reverse the functional abnormalities of frontal-subcortical circuits in MDD may have treating effects to related brain morphological abnormalities. In this study, we used voxel-based morphometry method to investigate whole brain structural abnormalities in single episode, medication-naïve MDD patients. Furthermore, we investigated the effects of an 8 weeks pharmacotherapy with fluoxetine.

Methods: 28 single episode, medication-naïve MDD participants and 28 healthy controls (HC) acquired the baseline high-resolution structural magnetic resonance imaging (sMRI) scan. 24 MDD participants acquired a follow-up sMRI scan after 8 weeks antidepressant treatment. Gray matter volumetric (GMV) difference between groups was examined.

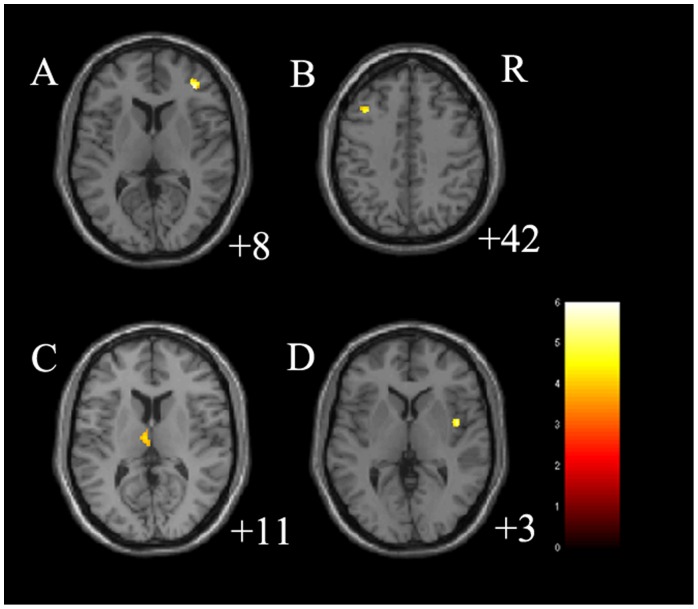
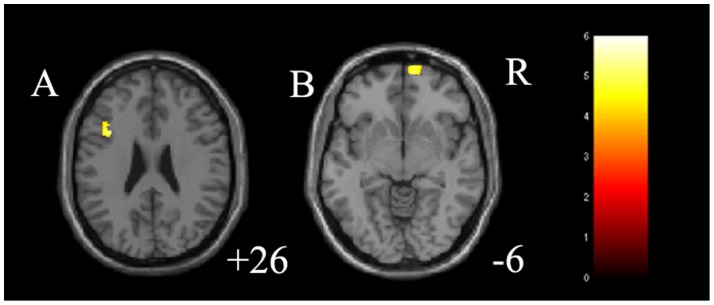
Results: Medication-naïve MDD had significantly decreased GMV in the right dorsolateral prefrontal cortex and left middle frontal gyrus as well as increased GMV in the left thalamus and right insula compared to HC (P<0.05, corrected). Moreover, treated MDD had significantly increased GMV in the left middle frontal gyrus and right orbitofrontal cortex compared to HC (P<0.05, corrected). No difference on GMV was detected between medication-naïve MDD group and treated MDD group.

Conclusions: This study of single episode, medication-naïve MDD subjects demonstrated structural abnormalities of frontal-subcortical circuitsin the early stage of MDD and the effects of 8 weeks successful antidepressant treatment, suggesting these abnormalities may play an important role in the neuropathophysiology of MDD at its onset.


Conflict of interest statement

Competing Interests: The authors have declared that no competing interests exist.

Figures

Figure 1
Figure 1. Regions of differences in gray matter volume in medication-naïve participants with major depressive disorder.
A: the axial image (z = 8 mm Montreal Neurological Institute coordinate plane) shows the regions of significantly decreased gray matter volume in right dorsolateral prefrontal cortex in medication-naïve participants with major depressive disorder, compared to healthy controls (p<0.05, corrected). B: the axial image (z = 42 mm Montreal Neurological Institute coordinate plane) shows the regions of significantly decreased gray matter volume in left middle frontal gyrus in medication-naïve participants with major depressive disorder, compared to healthy controls (p<0.05, corrected). C: the axial image (z = 11 mm Montreal Neurological Institute coordinate plane) shows the regions of significantly increased gray matter volume in left thalamus in medication-naïve participants with major depressive disorder, compared to healthy controls (p<0.05, corrected). D: the axial image (z = 3 mm Montreal Neurological Institute coordinate plane) shows the regions of significantly increased gray matter volume in right insula in medication-naïve participants with major depressive disorder, compared to healthy controls (p<0.05, corrected). The color bar represents the range of T values. R =  right.
Figure 2
Figure 2. Regions of differences in gray matter volume in treated participants with major depressive disorder.
A: the axial image (z = 26 mm Montreal Neurological Institute coordinate plane) shows the regions of significantly increased gray matter volume in left thalamus in treated participants with major depressive disorder, compared to healthy controls (p<0.05, corrected). B: the axial image (z = −6 mm Montreal Neurological Institute coordinate plane) shows the regions of significantly increased gray matter volume in right orbitofrontal cortex in treated participants with major depressive disorder, compared to healthy controls (p<0.05, corrected). The color bar represents the range of T values. R =  right.

References

    1. Anand A, Li Y, Wang Y, Lowe MJ, Dzemidzic M (2009) Resting state corticolimbic connectivity abnormalities in unmedicated bipolar disorder and unipolar depression. Psychiatry Res 171: 189–198. - PMC - PubMed
    1. Marchand WR, Lee JN, Suchy Y, Johnson S, Thatcher J, et al. (2012) Aberrant functional connectivity of cortico-basal ganglia circuits in major depression. Neuroscience letters 514: 86–90. - PubMed
    1. Gutman DA, Holtzheimer PE, Behrens TE, Johansen-Berg H, Mayberg HS (2009) A tractography analysis of two deep brain stimulation white matter targets for depression. Biological psychiatry 65: 276–282. - PMC - PubMed
    1. Drevets WC, Videen TO, Price JL, Preskorn SH, Carmichael ST, et al. (1992) A functional anatomical study of unipolar depression. The Journal of neuroscience: the official journal of the Society for Neuroscience 12: 3628–3641. - PMC - PubMed
    1. Cummings JL (1993) Frontal-subcortical circuits and human behavior. Archives of neurology 50: 873–880. - PubMed

Publication types

Substances

LinkOut - more resources