

100% classification accuracy considered harmful: the normalized information transfer factor explains the accuracy paradox
- PMID: 24427282
- PMCID: PMC3888391
- DOI: 10.1371/journal.pone.0084217
100% classification accuracy considered harmful: the normalized information transfer factor explains the accuracy paradox
Abstract
The most widely spread measure of performance, accuracy, suffers from a paradox: predictive models with a given level of accuracy may have greater predictive power than models with higher accuracy. Despite optimizing classification error rate, high accuracy models may fail to capture crucial information transfer in the classification task. We present evidence of this behavior by means of a combinatorial analysis where every possible contingency matrix of 2, 3 and 4 classes classifiers are depicted on the entropy triangle, a more reliable information-theoretic tool for classification assessment. Motivated by this, we develop from first principles a measure of classification performance that takes into consideration the information learned by classifiers. We are then able to obtain the entropy-modulated accuracy (EMA), a pessimistic estimate of the expected accuracy with the influence of the input distribution factored out, and the normalized information transfer factor (NIT), a measure of how efficient is the transmission of information from the input to the output set of classes. The EMA is a more natural measure of classification performance than accuracy when the heuristic to maximize is the transfer of information through the classifier instead of classification error count. The NIT factor measures the effectiveness of the learning process in classifiers and also makes it harder for them to "cheat" using techniques like specialization, while also promoting the interpretability of results. Their use is demonstrated in a mind reading task competition that aims at decoding the identity of a video stimulus based on magnetoencephalography recordings. We show how the EMA and the NIT factor reject rankings based in accuracy, choosing more meaningful and interpretable classifiers.
Conflict of interest statement
Figures
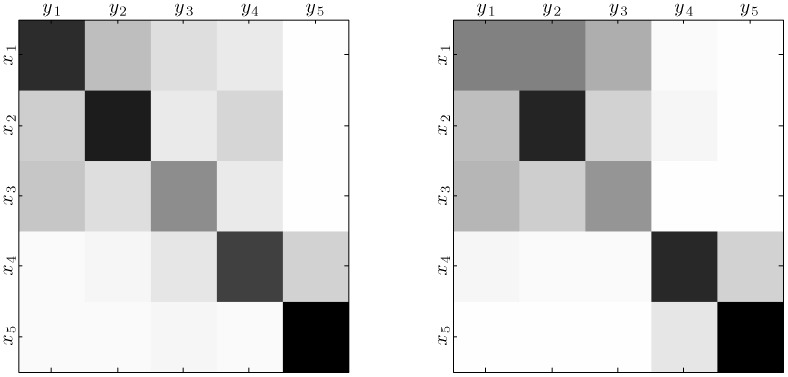
 and columns to the decision
  or response. Darker hues correlate with higher joint probability
  . The heat map on the left reveals that the best classifier according to accuracy does not capture the fact that stimuli
  ,
,  and
and  belong to a particular category whilst
  and
and  belong to another. A
 B
B C
C
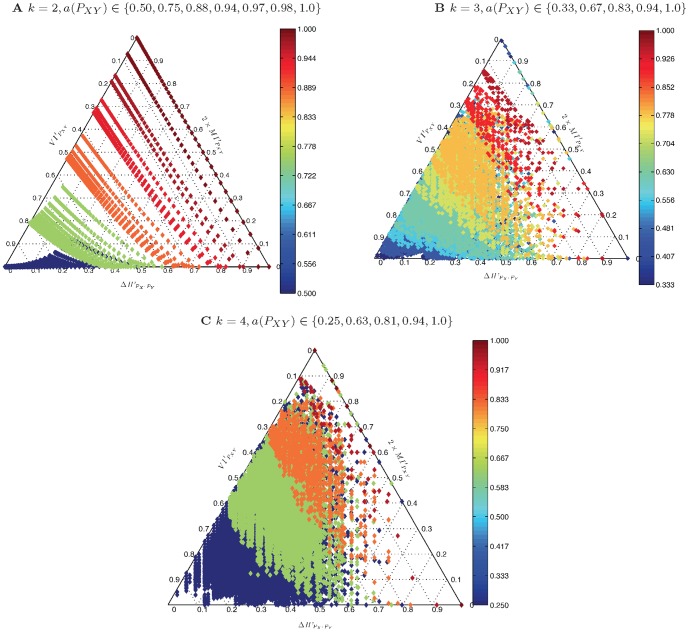
 and
and  but only for lower levels of accuracy for
  . This entails that accuracy is not a good criterion to judge the flow of information from the input labels to the output labels of a classifier (see text).
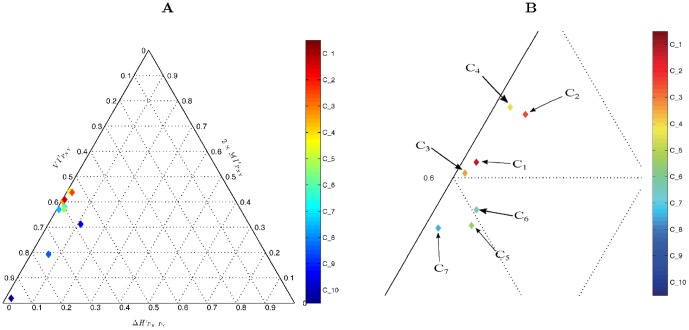
 , closely followed by
  should have been ranked first after this criterion.
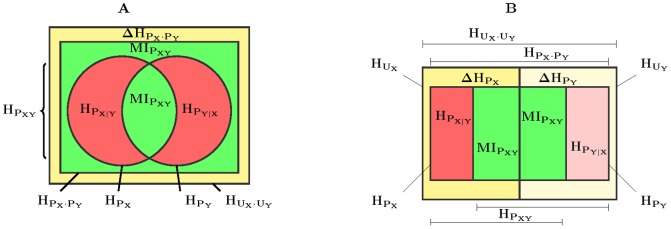
 and
and  of the same cardinality as
  and
and  . The expected mutual information
  appears twice in (A) and this makes the diagram split for each variable symmetrically in (B).
Similar articles
-
Multi-objective evolutionary algorithms for fuzzy classification in survival prediction.Artif Intell Med. 2014 Mar;60(3):197-219. doi: 10.1016/j.artmed.2013.12.006. Epub 2014 Jan 9. Artif Intell Med. 2014. PMID: 24525210
-
Improving data retrieval quality: Evidence based medicine perspective.Int J Risk Saf Med. 2015;27 Suppl 1:S106-7. doi: 10.3233/JRS-150710. Int J Risk Saf Med. 2015. PMID: 26639684
-
Instance transfer learning with multisource dynamic TrAdaBoost.ScientificWorldJournal. 2014;2014:282747. doi: 10.1155/2014/282747. Epub 2014 Jul 24. ScientificWorldJournal. 2014. PMID: 25152906 Free PMC article.
-
Assessing the accuracy of prediction algorithms for classification: an overview.Bioinformatics. 2000 May;16(5):412-24. doi: 10.1093/bioinformatics/16.5.412. Bioinformatics. 2000. PMID: 10871264 Review.
-
Fuzzy Classification Methods Based Diagnosis of Parkinson's disease from Speech Test Cases.Curr Aging Sci. 2019;12(2):100-120. doi: 10.2174/1874609812666190625140311. Curr Aging Sci. 2019. PMID: 31241024 Review.
Cited by
-
Aberrant MEG multi-frequency phase temporal synchronization predicts conversion from mild cognitive impairment-to-Alzheimer's disease.Neuroimage Clin. 2019;24:101972. doi: 10.1016/j.nicl.2019.101972. Epub 2019 Aug 8. Neuroimage Clin. 2019. PMID: 31522127 Free PMC article.
-
Machine Learning Analysis Reveals Novel Neuroimaging and Clinical Signatures of Frailty in HIV.J Acquir Immune Defic Syndr. 2020 Aug 1;84(4):414-421. doi: 10.1097/QAI.0000000000002360. J Acquir Immune Defic Syndr. 2020. PMID: 32251142 Free PMC article.
-
The prognostic value of gastroesophageal reflux disorder in interstitial lung disease related hospitalizations.Respir Res. 2023 Mar 30;24(1):97. doi: 10.1186/s12931-023-02407-4. Respir Res. 2023. PMID: 36998050 Free PMC article.
-
Machine learning approaches for risk prediction after percutaneous coronary intervention: a systematic review and meta-analysis.Eur Heart J Digit Health. 2024 Oct 14;6(1):23-44. doi: 10.1093/ehjdh/ztae074. eCollection 2025 Jan. Eur Heart J Digit Health. 2024. PMID: 39846069 Free PMC article.
-
Machine learning models for 180-day mortality prediction of patients with advanced cancer using patient-reported symptom data.Qual Life Res. 2023 Mar;32(3):713-727. doi: 10.1007/s11136-022-03284-y. Epub 2022 Oct 29. Qual Life Res. 2023. PMID: 36308591 Free PMC article.
References
-
- Sokal RR (1974) Classification: Purposes, principles, progress, prospects. Science 185: 1115–1123. - PubMed
-
- Miller GA, Nicely PE (1955) An analysis of perceptual confusions among some English consonants. Journal of the Acoustical Society of America 27: 338–352.
Publication types
MeSH terms
LinkOut - more resources
Full Text Sources
Other Literature Sources
Research Materials
