

Impact of blood rheology on wall shear stress in a model of the middle cerebral artery
- PMID: 24427534
- PMCID: PMC3638489
- DOI: 10.1098/rsfs.2012.0094
Impact of blood rheology on wall shear stress in a model of the middle cerebral artery
Abstract
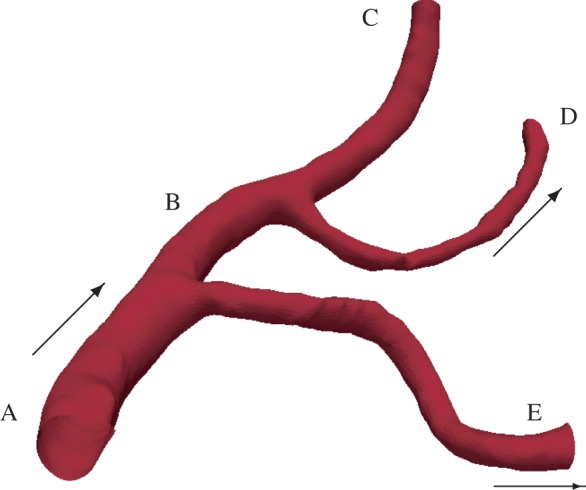
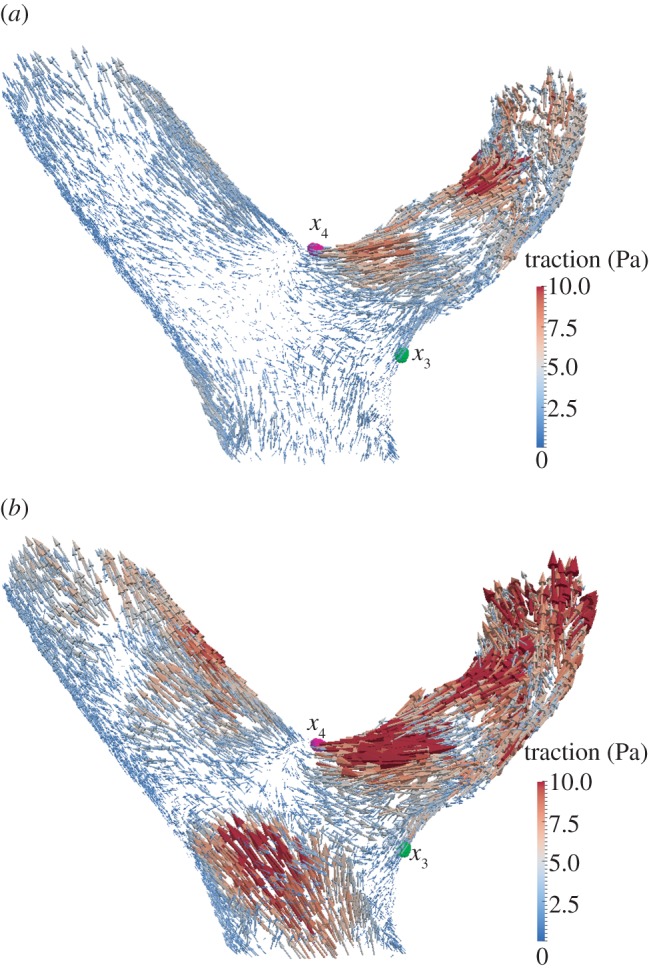
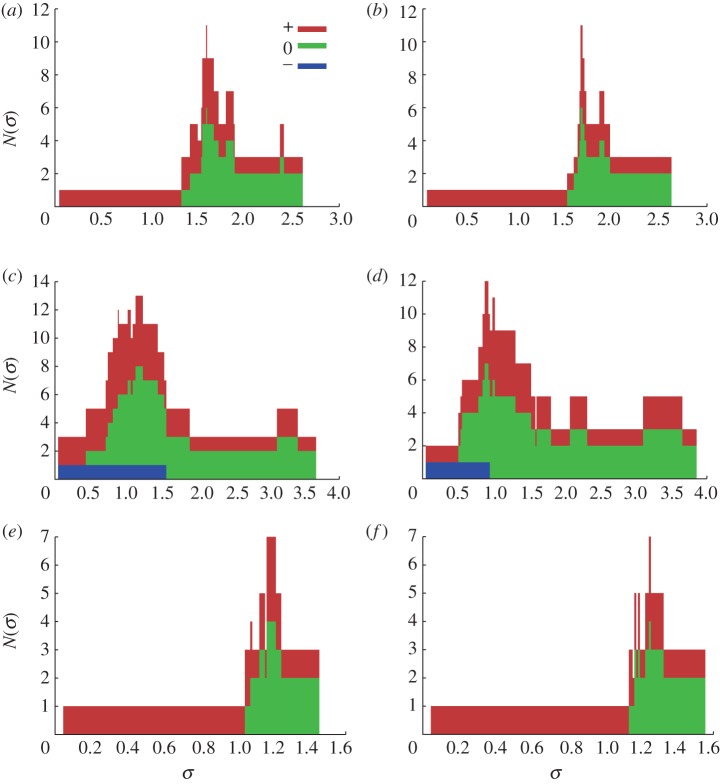
Perturbations to the homeostatic distribution of mechanical forces exerted by blood on the endothelial layer have been correlated with vascular pathologies, including intracranial aneurysms and atherosclerosis. Recent computational work suggests that, in order to correctly characterize such forces, the shear-thinning properties of blood must be taken into account. To the best of our knowledge, these findings have never been compared against experimentally observed pathological thresholds. In this work, we apply the three-band diagram (TBD) analysis due to Gizzi et al. (Gizzi et al. 2011 Three-band decomposition analysis of wall shear stress in pulsatile flows. Phys. Rev. E 83, 031902. (doi:10.1103/PhysRevE.83.031902)) to assess the impact of the choice of blood rheology model on a computational model of the right middle cerebral artery. Our results show that, in the model under study, the differences between the wall shear stress predicted by a Newtonian model and the well-known Carreau-Yasuda generalized Newtonian model are only significant if the vascular pathology under study is associated with a pathological threshold in the range 0.94-1.56 Pa, where the results of the TBD analysis of the rheology models considered differs. Otherwise, we observe no significant differences.
Keywords: blood flow modelling; lattice Boltzmann; multi-scale modelling; rheology; three-band diagram analysis.
Figures
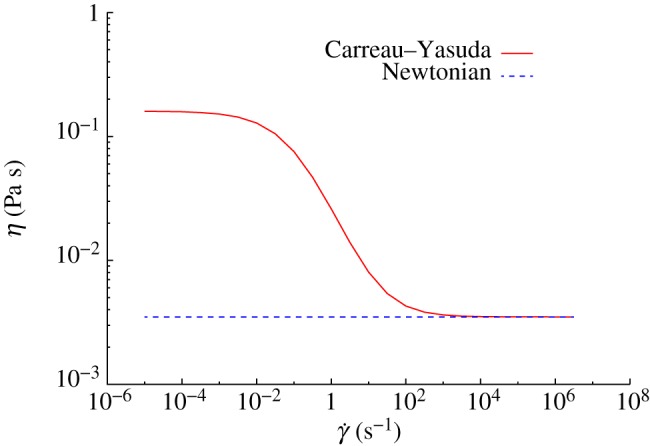
 for the CY and the Newtonian models. (Online version in colour.)
References
-
- Rivero-Arias O, Gray A, Wolstenholme J. 2010. Burden of disease and costs of aneurysmal subarachnoid haemorrhage (aSAH) in the United Kingdom. Cost Effectiveness Resour. Allocation 8, 6.10.1186/1478-7547-8-6 (doi:10.1186/1478-7547-8-6) - DOI - DOI - PMC - PubMed
-
- Stehbens WE. 1989. Etiology of intracranial berry aneurysms. J. Neurosurg. 70, 823–83110.3171/jns.1989.70.6.0823 (doi:10.3171/jns.1989.70.6.0823) - DOI - DOI - PubMed
-
- Shojima M, Oshima M, Takagi K, Torii R, Hayakawa M, Katada K, Morita A, Kirino T. 2004. Magnitude and role of wall shear stress on cerebral aneurysm. Stroke 35, 2500–250510.1161/01.STR.0000144648.89172.0f (doi:10.1161/01.STR.0000144648.89172.0f) - DOI - DOI - PubMed
-
- Chatzizisis YS, et al. 2008. Prediction of the localization of high-risk coronary atherosclerotic plaques on the basis of low endothelial shear stress. Circulation 117, 993–100210.1161/CIRCULATIONAHA.107.695254 (doi:10.1161/CIRCULATIONAHA.107.695254) - DOI - DOI - PubMed
-
- Mejia J, Mongrain R, Bertrand OF. 2011. Accurate prediction of wall shear stress in a stented artery: Newtonian versus non-Newtonian models. J. Biomech. Eng. 133, 074501.10.1115/1.4004408 (doi:10.1115/1.4004408) - DOI - DOI - PubMed
Grants and funding
LinkOut - more resources
Full Text Sources
Other Literature Sources