

Reactions of 5-methylcytosine cation radicals in DNA and model systems: thermal deprotonation from the 5-methyl group vs. excited state deprotonation from sugar
- PMID: 24428230
- PMCID: PMC4266391
- DOI: 10.3109/09553002.2014.884293
Reactions of 5-methylcytosine cation radicals in DNA and model systems: thermal deprotonation from the 5-methyl group vs. excited state deprotonation from sugar
Abstract
Purpose: To study the formation and subsequent reactions of the 5-methyl-2'-deoxycytidine cation radical (5-Me-2'-dC•(+)) in nucleosides and DNA-oligomers and compare to one-electron oxidized thymidine.
Materials and methods: Employing electron spin resonance (ESR), cation radical formation and its reactions were investigated in 5-Me-2'-dC, thymidine (Thd) and their derivatives, in fully double-stranded (ds) d[GC*GC*GC*GC*](2) and in the 5-Me-C/A mismatched, d[GGAC*AAGC:CCTAATCG], where C* = 5-Me-C.
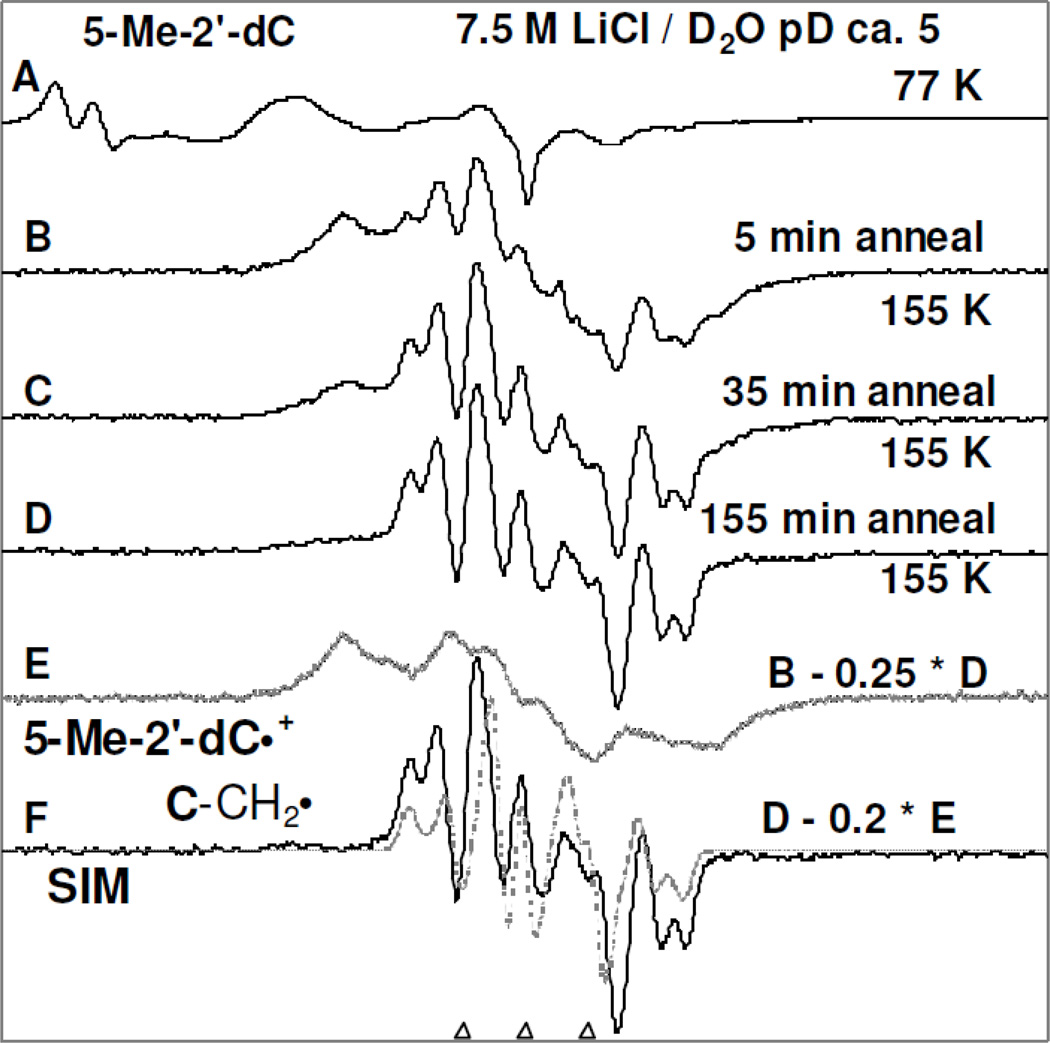
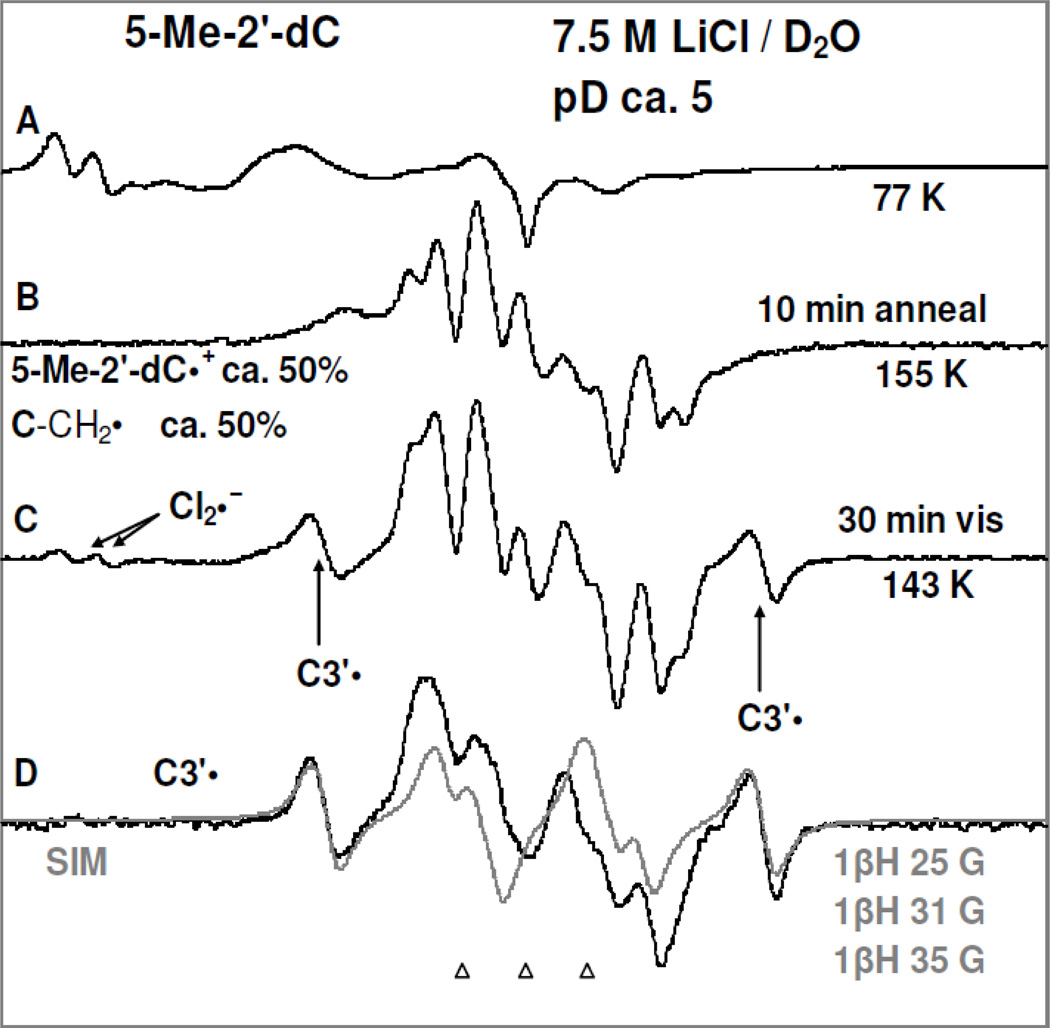
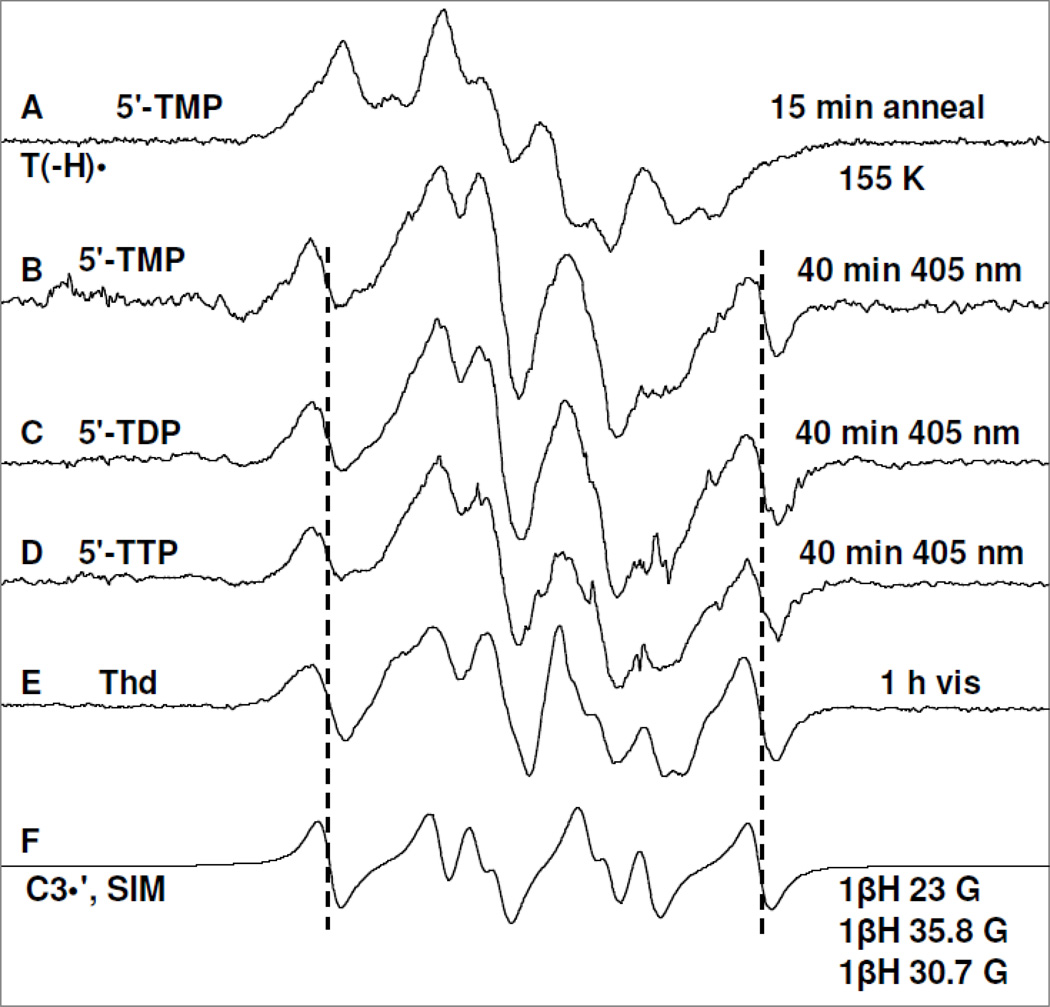
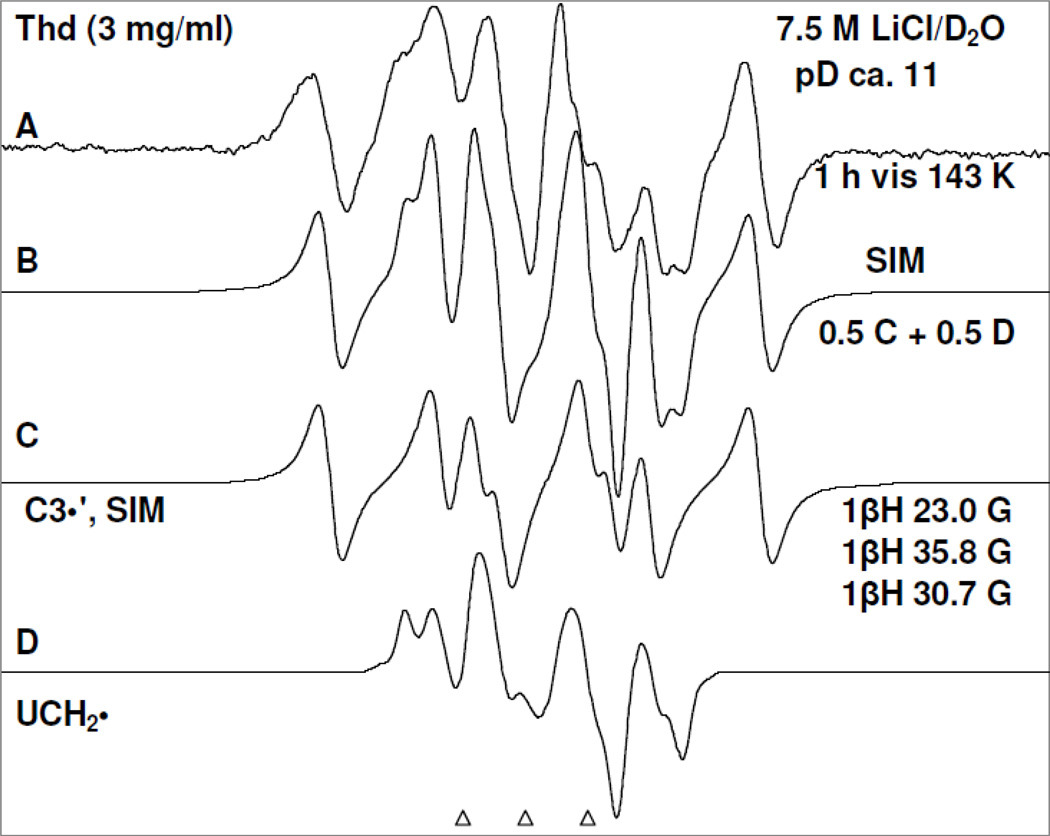
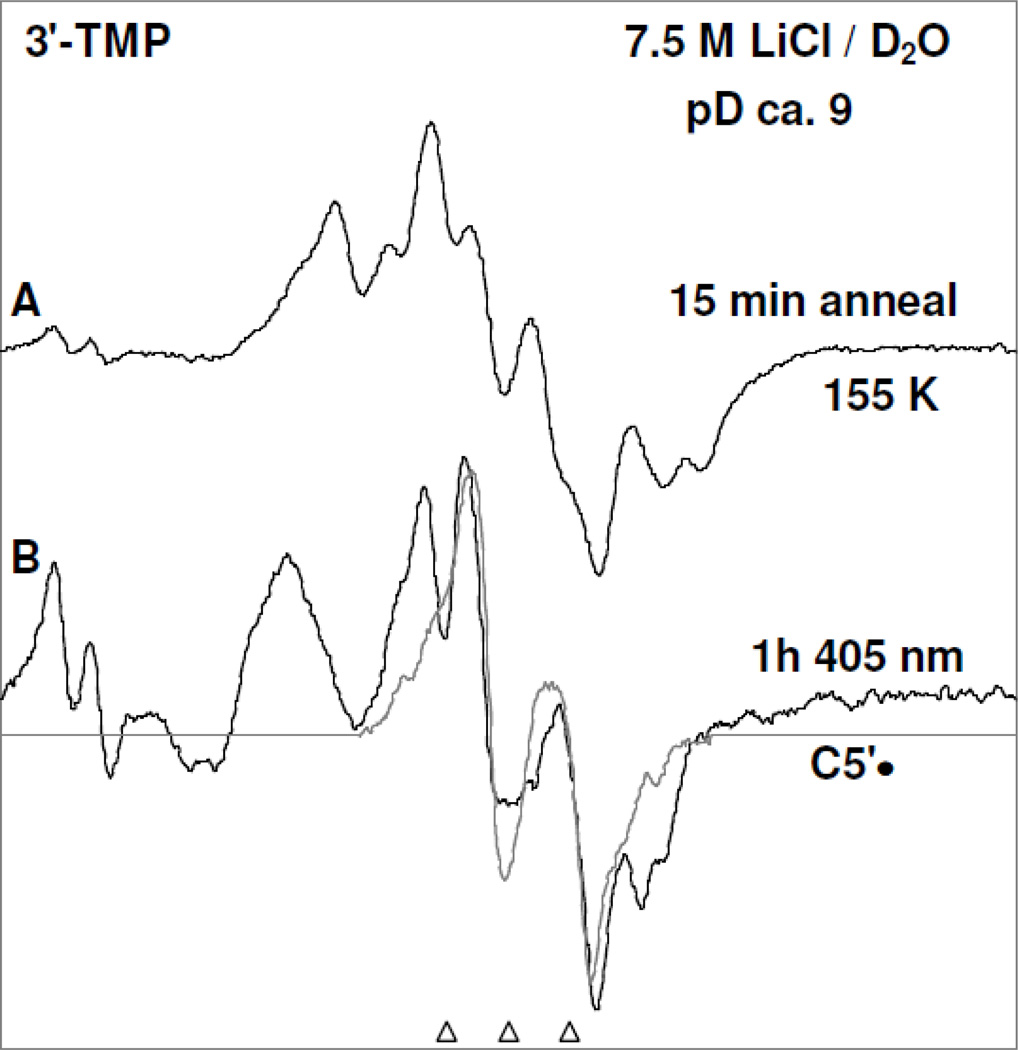
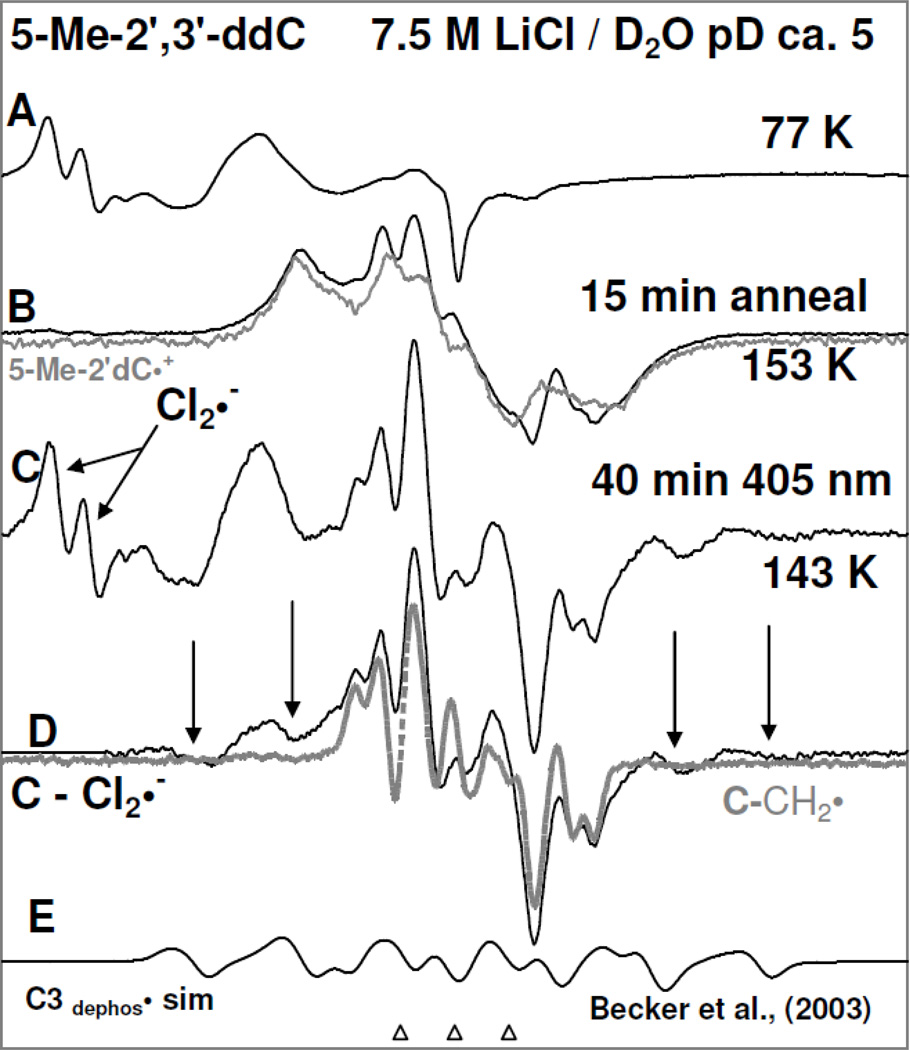
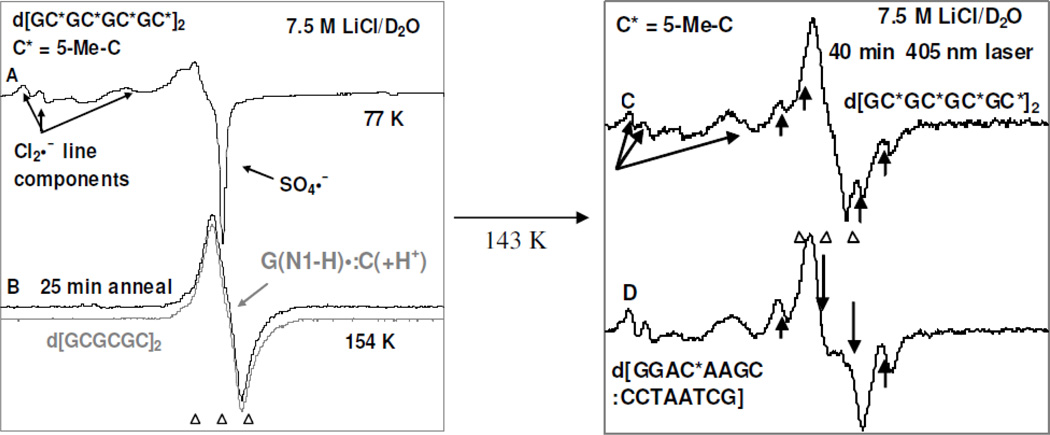
Results: We report 5-Me-2'-dC•(+) production by one-electron oxidation of 5-Me-2'-dC by Cl(2)•- via annealing in the dark at 155 K. Progressive annealing of 5-Me-2'-dC•(+) at 155 K produces the allylic radical (C-CH(2)•). However, photoexcitation of 5-Me-2'-dC•(+) by 405 nm laser or by photoflood lamp leads to only C3'• formation. Photoexcitation of N3-deprotonated thyminyl radical in Thd and its 5'-nucleotides leads to C3'• formation but not in 3'-TMP which resulted in the allylic radical (U-CH(2)•) and C5'• production. For excited 5-Me-2',3'-ddC•(+), absence of the 3'-OH group does not prevent C3'• formation. For d[GC*GC*GC*GC*](2) and d[GGAC*AAGC:CCTAATCG], intra-base paired proton transferred form of G cation radical (G(N1-H)•: C(+ H(+))) is found with no observable 5-Me-2'-dC•(+) formation. Photoexcitation of (G(N1-H)•:C(+ H(+))) in d[GC*GC*GC*GC*](2) produced only C1'• and not the expected photoproducts from 5-Me-2'-dC•(+). However, photoexcitation of (G(N1-H)•:C(+ H(+))) in d[GGAC*AAGC:CCTAATCG] led to C5'• and C1'• formation.
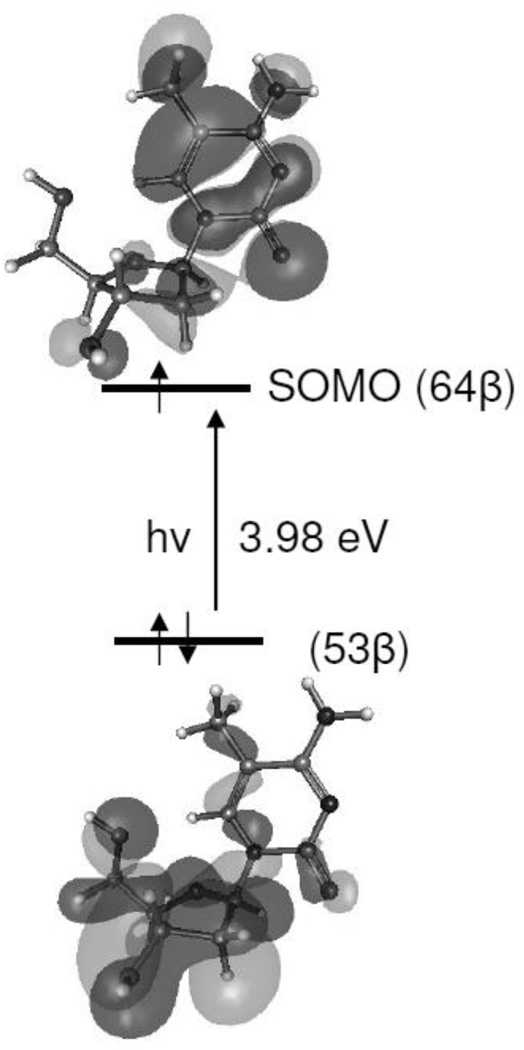
Conclusions: C-CH(2)• formation from 5-Me-2'-dC•(+) occurs via ground state deprotonation from C5-methyl group on the base. In the excited 5-Me-2'-dC•(+) and 5-Me-2',3'-ddC•(+), spin and charge localization at C3' followed by deprotonation leads to C3'• formation. Thus, deprotonation from C3' in the excited cation radical is kinetically controlled and sugar C-H bond energies are not the only controlling factors in these deprotonations.
Keywords: 5-Methylcytosine; DNA-oligomers; ESR; HFCC values; TD-DFT calculations; cation radical; one-electron oxidation; thymidine.
Conflict of interest statement
Figures
Similar articles
-
Formation of sugar radicals in RNA model systems and oligomers via excitation of guanine cation radical.J Phys Chem B. 2008 Feb 21;112(7):2168-78. doi: 10.1021/jp077429y. Epub 2008 Jan 29. J Phys Chem B. 2008. PMID: 18225886
-
The formation of DNA sugar radicals from photoexcitation of guanine cation radicals.Radiat Res. 2004 May;161(5):582-90. doi: 10.1667/rr3167. Radiat Res. 2004. PMID: 15161365
-
Photoexcitation of adenine cation radical [A*+] in the near UV-vis region produces sugar radicals in adenosine and in its nucleotides.J Phys Chem B. 2008 Dec 11;112(49):15844-55. doi: 10.1021/jp808139e. J Phys Chem B. 2008. PMID: 19367991 Free PMC article.
-
One-electron oxidation reactions of purine and pyrimidine bases in cellular DNA.Int J Radiat Biol. 2014 Jun;90(6):423-32. doi: 10.3109/09553002.2013.877176. Epub 2014 Apr 3. Int J Radiat Biol. 2014. PMID: 24369822 Free PMC article. Review.
-
The Two Faces of the Guanyl Radical: Molecular Context and Behavior.Molecules. 2021 Jun 9;26(12):3511. doi: 10.3390/molecules26123511. Molecules. 2021. PMID: 34207639 Free PMC article. Review.
Cited by
-
5-Thiocyanato-2'-deoxyuridine as a possible radiosensitizer: electron-induced formation of uracil-C5-thiyl radical and its dimerization.Phys Chem Chem Phys. 2015 Jul 14;17(26):16907-16. doi: 10.1039/c5cp02081f. Phys Chem Chem Phys. 2015. PMID: 26059609 Free PMC article.
-
Reaction of Electrons with DNA: Radiation Damage to Radiosensitization.Int J Mol Sci. 2019 Aug 16;20(16):3998. doi: 10.3390/ijms20163998. Int J Mol Sci. 2019. PMID: 31426385 Free PMC article. Review.
-
π-Radical to σ-Radical Tautomerization in One-Electron-Oxidized 1-Methylcytosine and Its Analogs.J Phys Chem B. 2015 Sep 3;119(35):11496-505. doi: 10.1021/acs.jpcb.5b05162. Epub 2015 Aug 13. J Phys Chem B. 2015. PMID: 26237072 Free PMC article.
-
Modulating the Catalytic Activity of Cerium Oxide Nanoparticles with the Anion of the Precursor Salt.J Phys Chem C Nanomater Interfaces. 2017 Sep 14;121(36):20039-20050. doi: 10.1021/acs.jpcc.7b05725. Epub 2017 Aug 21. J Phys Chem C Nanomater Interfaces. 2017. PMID: 28936278 Free PMC article.
-
Gamma and Ion-Beam Irradiation of DNA: Free Radical Mechanisms, Electron Effects, and Radiation Chemical Track Structure.Radiat Phys Chem Oxf Engl 1993. 2016 Nov;128:60-74. doi: 10.1016/j.radphyschem.2016.04.022. Epub 2016 Apr 30. Radiat Phys Chem Oxf Engl 1993. 2016. PMID: 27695205 Free PMC article.
References
-
- Adhikary A, Kumar A, Becker D, Sevilla MD. Theory and ESR spectral studies of DNA-radicals. In: Chatgilialoglu C, Struder A, editors. Encyclopedia of Radicals in Chemistry, Biology and Materials. Chichester, UK: John Wiley & Sons Ltd.; 2012. pp. 1371–1396.
Publication types
MeSH terms
Substances
Grants and funding
LinkOut - more resources
Full Text Sources
Other Literature Sources
Miscellaneous