Review
. 2014 Jan-Feb;34(1):217-33.
doi: 10.1148/rg.341135130.

Fat-suppression techniques for 3-T MR imaging of the musculoskeletal system

Affiliations
Review

Fat-suppression techniques for 3-T MR imaging of the musculoskeletal system

Filippo Del Grande et al. Radiographics. 2014 Jan-Feb.

Abstract

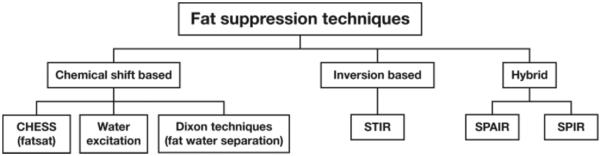
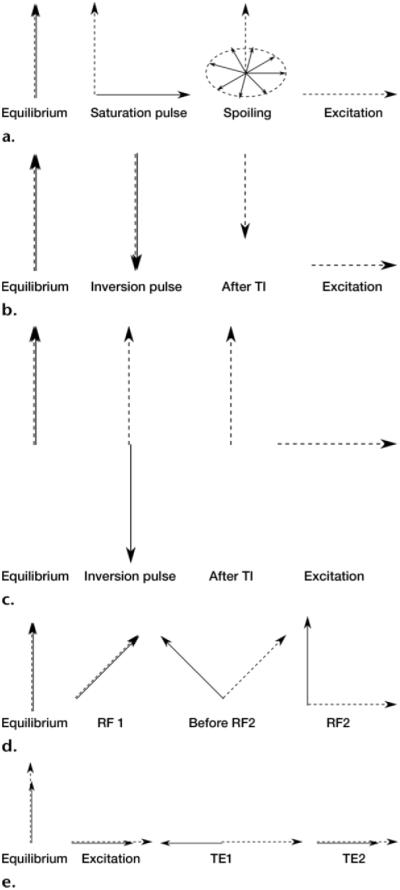
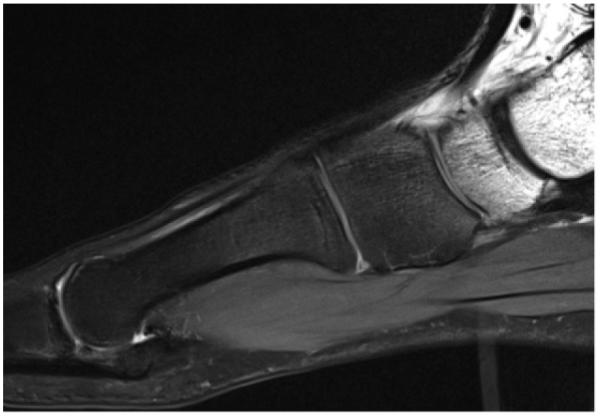
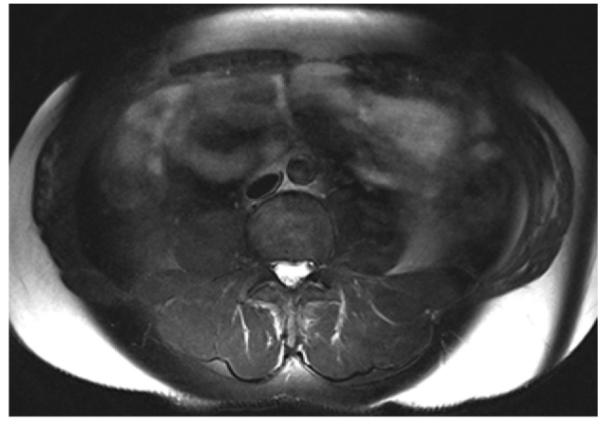
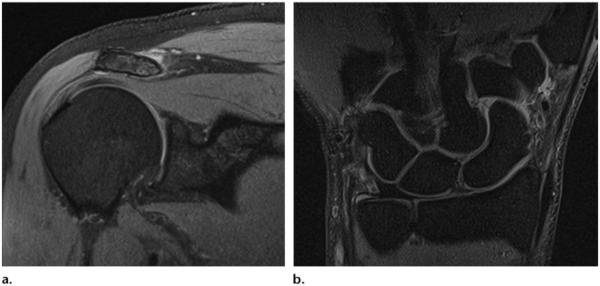
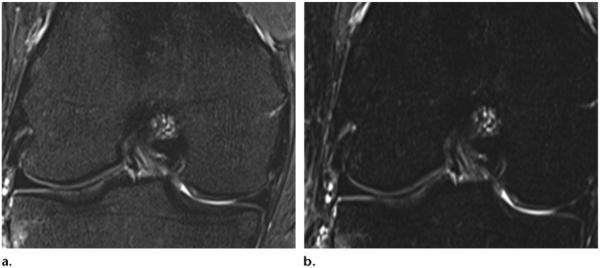
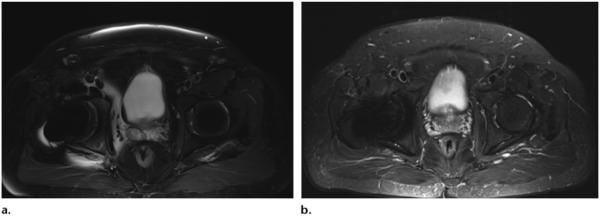
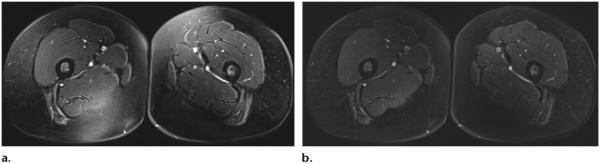
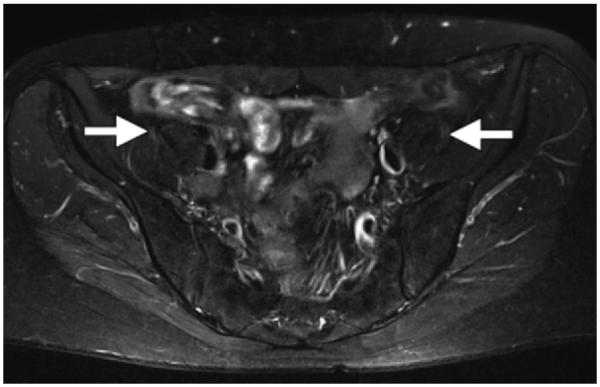
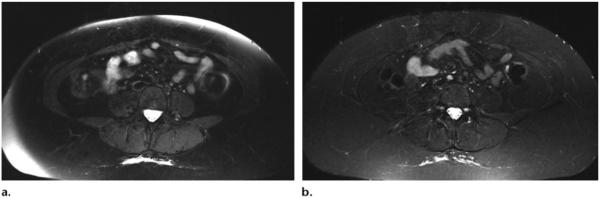
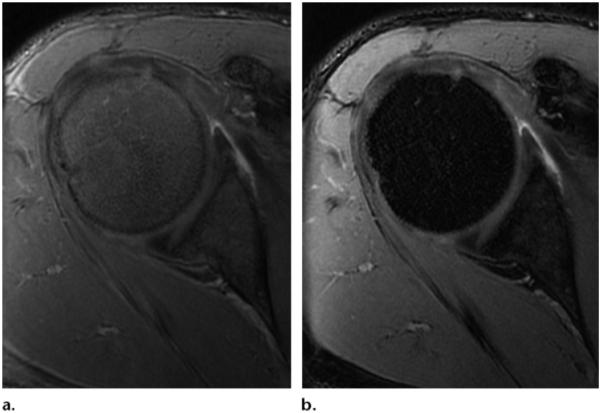
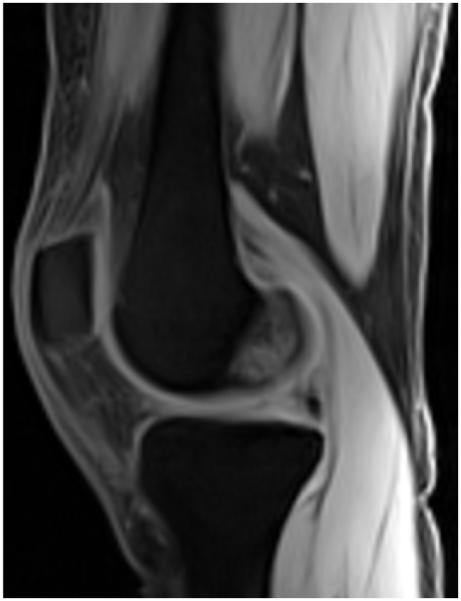
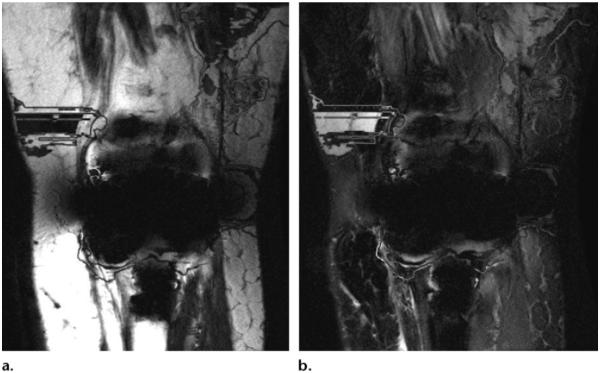
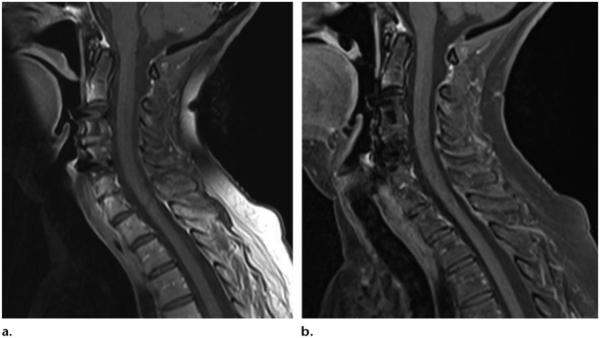
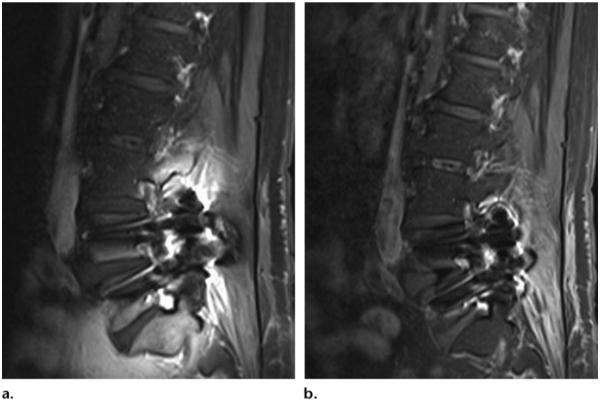
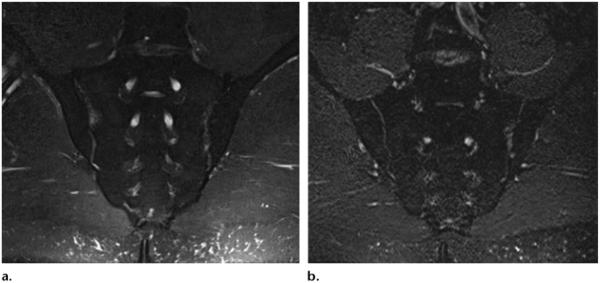
Fat suppression is an important technique in musculoskeletal imaging to improve the visibility of bone-marrow lesions; evaluate fat in soft-tissue masses; optimize the contrast-to-noise ratio in magnetic resonance (MR) arthrography; better define lesions after administration of contrast material; and avoid chemical shift artifacts, primarily at 3-T MR imaging. High-field-strength (eg, 3-T) MR imaging has specific technical characteristics compared with lower-field-strength MR imaging that influence the use and outcome of various fat-suppression techniques. The most commonly used fat-suppression techniques for musculoskeletal 3-T MR imaging include chemical shift (spectral) selective (CHESS) fat saturation, inversion recovery pulse sequences (eg, short inversion time inversion recovery [STIR]), hybrid pulse sequences with spectral and inversion-recovery (eg, spectral adiabatic inversion recovery and spectral attenuated inversion recovery [SPAIR]), spatial-spectral pulse sequences (ie, water excitation), and the Dixon techniques. Understanding the different fat-suppression options allows radiologists to adopt the most appropriate technique for their clinical practice.


Figures

Figure 1
Figure 1
Chart shows the major types of fat suppression—chemical shift–based, inversion-based, and hybrid—used in 3-T musculoskeletal MR imaging.
Figure 2
Figure 2
Fat suppression techniques. Dashed arrow = water, solid arrow = fat. (a) Diagram shows the mechanism of CHESS fat suppression, in which fat is selectively excited by an RF pulse, and a gradient pulse is applied to disperse the magnetization in the transverse plane. (b) Diagram shows the mechanism of coronal STIR fat suppression, in which the fat signal is inverted with a non-selective 180° pulse, and acquisition is begun after the inversion time (TI) that nulls the fat signal, resulting in a water signal with reduced magnitude. (c) Diagram shows the mechanism of spectral adiabatic inversion-recovery (SPAIR) fat suppression, in which the fat signal is inverted with an adiabatic spectrally selective pulse, and acquisition is begun after the inversion time that nulls the fat signal. (d) Diagram shows the mechanism of water excitation, in which an excitation pulse with an FA that equals one-half the desired FA is applied, and a delay is introduced to allow the water and fat magnetization to fall out of phase. At this point, a second excitation pulse is applied, which brings the fat magnetization back to the longitudinal axis and finishes flipping the water magnetization onto the transverse plane. (e) Diagram shows the mechanism of the Dixon technique, in which both water and fat are excited, and the first echo (TE1) is acquired when the two magnetization vectors in the transverse plane are out of phase, creating destructive interference. The second echo (TE2) is acquired when the two vectors are in phase, creating constructive addition.
Figure 3
Figure 3
Sagittal T2-weighted MR image (repetition time [TR], 3000 msec; echo time [TE], 44 msec) of the foot shows heterogeneous fat suppression with CHESS fat saturation, a result of the challenging anatomic geometry.
Figure 4
Figure 4
Axial T2-weighted CHESS MR image (TR, 4590 msec; TE, 75 msec) of the abdomen shows that subcutaneous fat was not suppressed, a result of strong B0 inhomogeneity in a large field of view.
Figure 5
Figure 5
Multisection off-resonance fat-suppression technique (MSOFT). Coronal unenhanced fat-saturated proton density–weighted MR images of a normal right shoulder (TR, 3000 msec; TE, 24 msec; FA, 90°) (a) and a normal right wrist (TR, 2150 msec; TE, 18 msec; FA, 90°) (b) show the effects of MSOFT.
Figure 6
Figure 6
Effects of STIR imaging in the knee. (a) STIR MR image (TR, 4500 msec; TE, 27 msec; TI, 205 msec) shows weak fat suppression of bone marrow. (b) STIR MR image (TR, 4500 msec; TE, 27 msec; TI, 220 msec) shows stronger fat suppression. (Images courtesy of Rory Johnson, RT, Siemens Medical Solutions, and Peter Cazares, Senior MR Education Specialist, Siemens Medical Solutions.)
Figure 7
Figure 7
Axial T2-weighted SPAIR fat-suppressed (TR, 4000 msec; TE, 74 msec) (a) and STIR (TR, 3970 msec; TE, 54 msec; TI, 220 msec) (b) MR images show that susceptibility artifacts from metal hip implants are more pronounced on SPAIR images, which are B0 sensitive, than they are on STIR images, which are not.
Figure 8
Figure 8
(a) Axial T2-weighted CHESS MR image (TR, 5550 msec; TE, 10 msec) shows heterogeneity of the fat suppression signal in the posteromedial aspect of the right thigh and the anteromedial aspect of the left thigh. (b) Axial T2-weighted SPAIR MR image (TR, 5550 msec; TE, 10 msec) shows more homogeneous fat suppression.
Figure 9
Figure 9
Axial T2-weighted (TR, 5000 msec; TE, 80 msec) SPAIR MR neurographic image of the pelvis shows homogeneous, SNR-efficient fat suppression and normal femoral nerves (arrows), which are slightly hyperintense.
Figure 10
Figure 10
(a) Axial T2-weighted SPAIR MR image (TR, 4590 msec; TE, 75 msec) shows heterogeneous suppression of subcutaneous fat, a result of B0 inhomogeneity at the edge of the large field of view. (b) STIR MR image (TR, 3960 msec; TE, 47 msec; TI, 220 msec) shows homogeneous suppression of subcutaneous fat.
Figure 11
Figure 11
Comparison of coherent oscillatory state acquisition for the manipulation of image contrast (COSMIC) and SPECIAL sequences. Three-dimensional (3D) COSMIC (GE, Milwaukee, Wis) MR image of the shoulder with chemical fat saturation (TR, 5.3 msec; TE, 1.5 msec; FA, 45°) (a) and SPECIAL (GE, Milwaukee, Wis) MR image with fat saturation (TR, 5.5 msec; TE, 1.3 msec; FA, 45°) (b) show stronger fat saturation with the SPECIAL technique.
Figure 12
Figure 12
Water excitation technique. Sagittal VIBE (Siemens, Erlangen, Germany) MR image (TR, 20 msec; TE, 2.8 msec; FA, 15°) obtained with the water excitation technique shows a normal knee.
Figure 13
Figure 13
Fat-water swapping in a patient with total knee replacement. Iterative decomposition of water and fat with echo asymmetry and least-squares estimation (IDEAL; GE, Milwaukee, Wis) MR images (TR, 3000 msec; TE, 13 msec) with fat (a) and water (b) only show severe field heterogeneity and fat-water swapping.
Figure 14
Figure 14
(a) Sagittal T1-weighted MR image with chemical fat saturation (TR, 500 msec; TE, 10 msec) shows heterogeneous fat saturation of the subcutaneous fat in the posterior side of the neck. (b) Dixon (Siemens, Erlangen, Germany) MR image (TR, 610 msec; TE, 12 msec) of the cervical spine shows robust fat suppression. (Images courtesy of Rory Johnson and Peter Cazares.)
Figure 15
Figure 15
Sagittal T1-weighted MR image with chemical fat saturation (TR, 510 msec; TE, 10 msec) (a) and Dixon (Siemens) MR image (TR, 692 msec; TE, 12 msec) (b) of the lumbar spine obtained in a patient with metal artifacts show that susceptibility artifacts are significantly greater with CHESS than fat-water separation. (Images courtesy of Rory Johnson and Peter Cazares.)
Figure 16
Figure 16
Coronal Dixon (Siemens) (TR, 3500 msec; TE, 90 msec) (a) and 3D SPACE STIR (TR, 5040 msec; TE, 47 msec; TI, 220 msec) (b) MR images of the sacrum show that SNR is lower with STIR than it is with fat-water separation. (Images courtesy of Rory Johnson and Peter Cazares.)
Figure 17
Figure 17
(a–c) Sagittal in-phase (a), fat (b), and water (c) IDEAL (GE) MR images (TR, 3800 msec; TE, 28 msec) obtained in a patient who underwent anterior cruciate ligament reconstruction show a fluid collection near the interference screw (arrow in c), with no artifacts. (d) Sagittal proton density–weighted MR image with chemical fat saturation (TR, 4000 msec; TE, 32 msec) shows unsuppressed fat near the screw (arrow).
Figure 18
Figure 18
Three-dimensional (3D) maximum intensity projection Cube Flex (GE, Milwaukee, Wis) MR neurogram of the lumbar plexus (TR, 1800 msec; TE, 35 msec) shows fat-water separation and FSE contrast. Cube Flex uses a 3D FSE acquisition and a two-point fat-water separation method to obtain high-resolution 3D images.
Figure 19
Figure 19
Multipoint (four-point) high-resolution 3D (0.5 × 0.5 × 1.5 mm3) Dixon (Philips, Best, the Netherlands) MR images (TR, 10.4 msec) obtained in phase (a), out of phase (b), with water suppression (c), and with fat only (d) show a normal knee.

References

    1. Delfaut EM, Beltran J, Johnson G, Rousseau J, Marchandise X, Cotten A. Fat suppression in MR imaging: techniques and pitfalls. RadioGraphics. 1999;19(2):373–382. - PubMed
    1. Bley TA, Wieben O, François CJ, Brittain JH, Reeder SB. Fat and water magnetic resonance imaging. J Magn Reson Imaging. 2010;31(1):4–18. - PubMed
    1. Aoki T, Yamashita Y, Oki H, et al. Iterative decomposition of water and fat with echo asymmetry and least-squares estimation (IDEAL) of the wrist and finger at 3T: comparison with chemical shift selective fat suppression images. J Magn Reson Imaging. 2013;37(3):733–738. - PubMed
    1. Gold GE, Suh B, Sawyer-Glover A, Beaulieu C. Musculoskeletal MRI at 3.0 T: initial clinical experience. AJR Am J Roentgenol. 2004;183(5):1479–1486. - PubMed
    1. Kuo R, Panchal M, Tanenbaum L, Crues JV., 3rd 3.0 Tesla imaging of the musculoskeletal system. J Magn Reson Imaging. 2007;25(2):245–261. - PubMed