

Cortical thickness differences between bipolar depression and major depressive disorder
- PMID: 24428430
- PMCID: PMC4047134
- DOI: 10.1111/bdi.12175
Cortical thickness differences between bipolar depression and major depressive disorder
Abstract
Objectives: Bipolar disorder (BD) is a psychiatric disorder with high morbidity and mortality that cannot be distinguished from major depressive disorder (MDD) until the first manic episode. A biomarker able to differentiate BD and MDD could help clinicians avoid risks of treating BD with antidepressants without mood stabilizers.
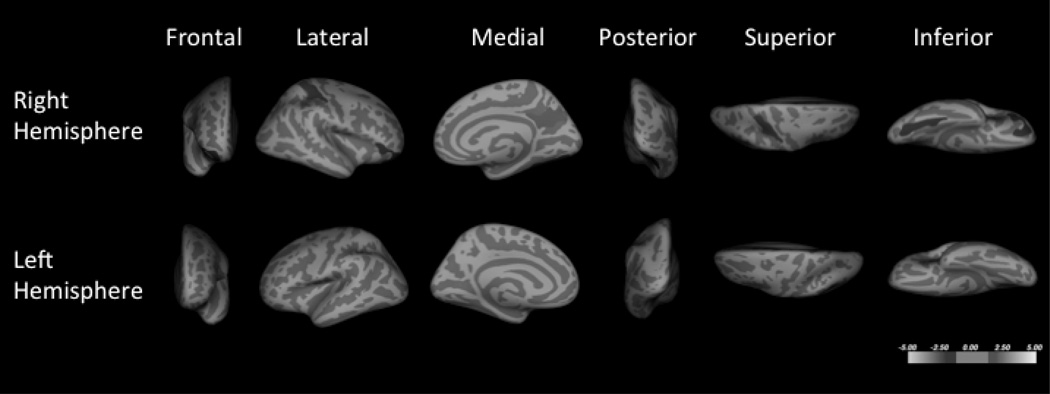
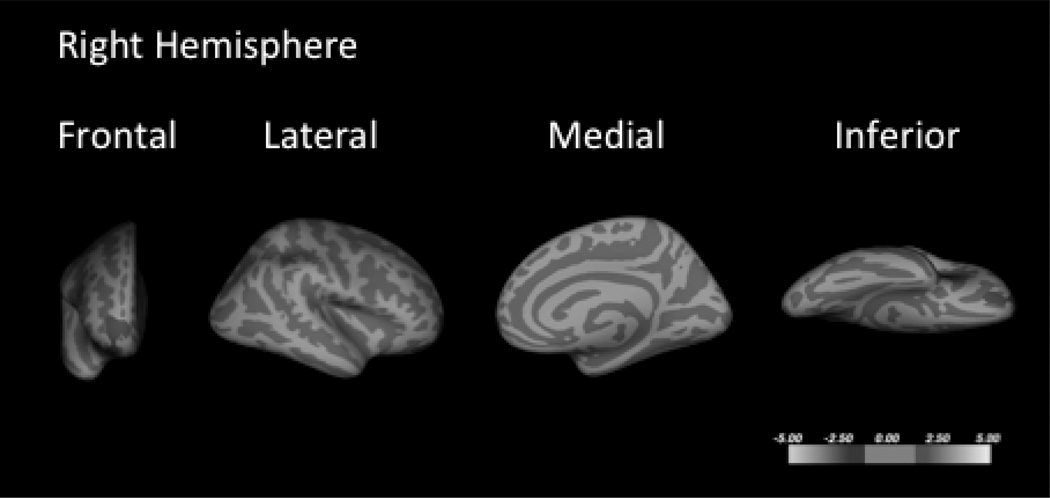
Methods: Cortical thickness differences were assessed using magnetic resonance imaging in BD depressed patients (n = 18), MDD depressed patients (n = 56), and healthy volunteers (HVs) (n = 54). A general linear model identified clusters of cortical thickness difference between diagnostic groups.
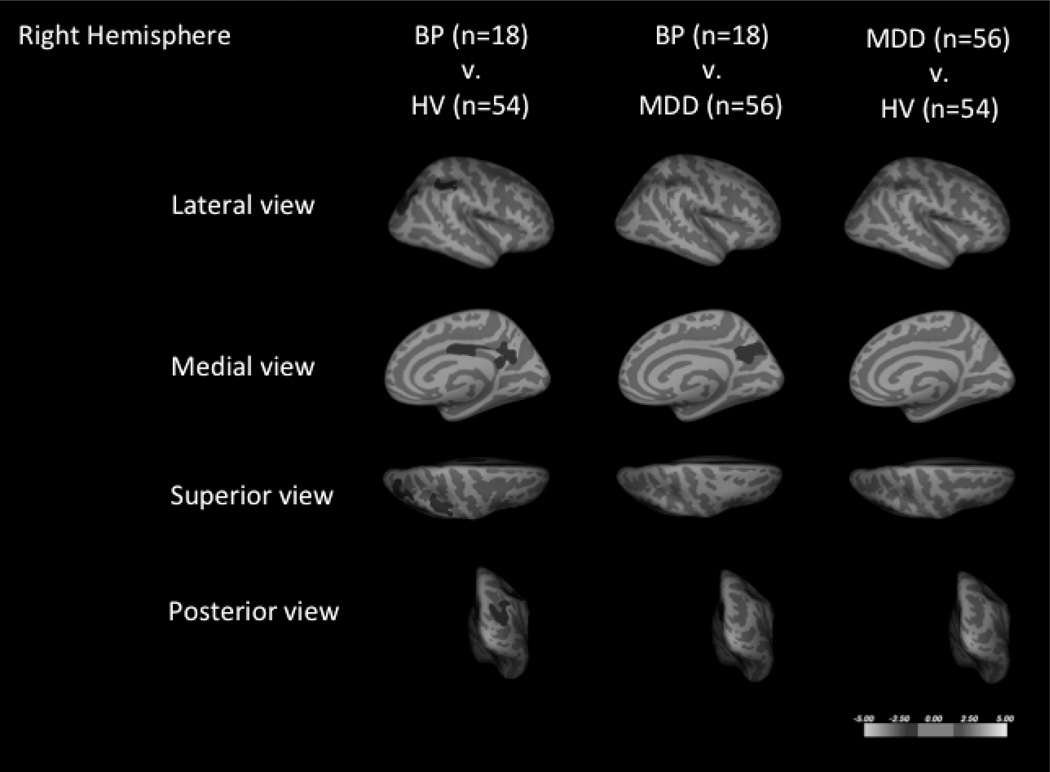
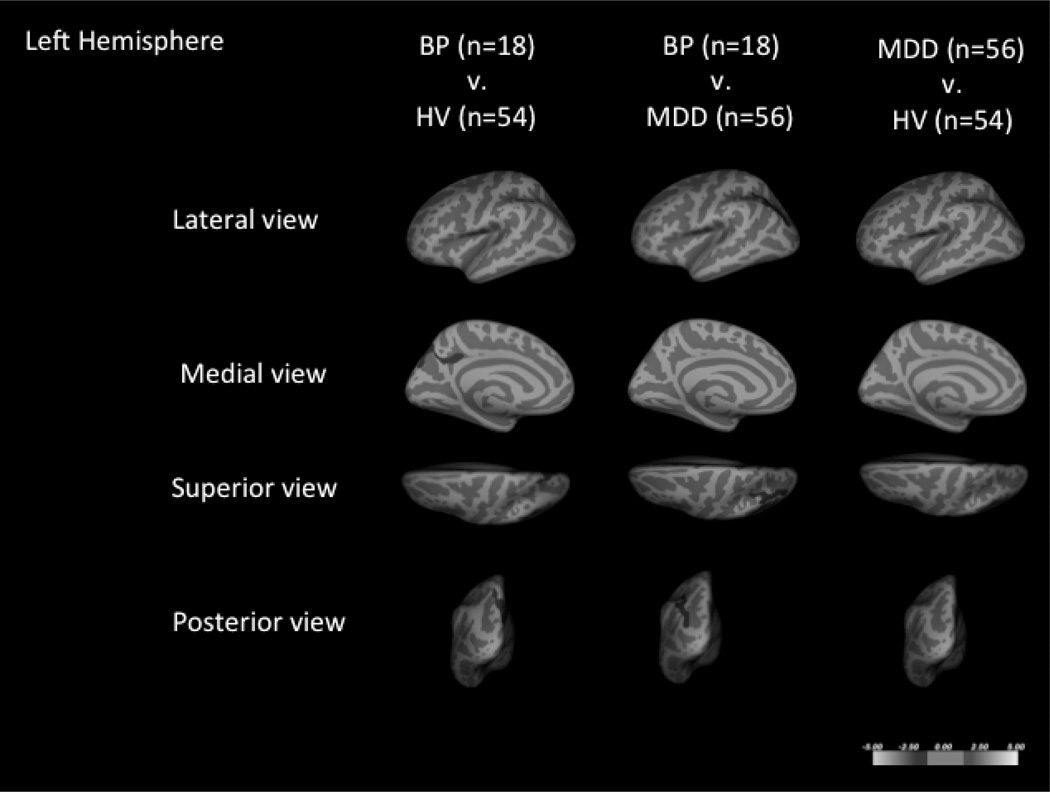
Results: Compared to the HV group, the BD group had decreased cortical thickness in six regions, after controlling for age and sex, located within the frontal and parietal lobes, and the posterior cingulate cortex. Mean cortical thickness changes in clusters ranged from 7.6 to 9.6% (cluster-wise p-values from 1.0 e-4 to 0.037). When compared to MDD, three clusters of lower cortical thickness in BD were identified that overlapped with clusters that differentiated the BD and HV groups. Mean cortical thickness changes in the clusters ranged from 7.5 to 8.2% (cluster-wise p-values from 1.0 e-4 to 0.023). The difference in cortical thickness was more pronounced when the subgroup of subjects with bipolar I disorder (BD-I) was compared to the MDD group.
Conclusions: Cortical thickness patterns were distinct between BD and MDD. These results are a step toward developing an imaging test to differentiate the two disorders.
Keywords: bipolar disorder; cortical thickness; magnetic resonance imaging; major depressive disorder; neuroimaging.
© 2014 John Wiley & Sons A/S. Published by John Wiley & Sons Ltd.
Conflict of interest statement
The authors of this paper declare no conflicts of interest in connection with the present manuscript.
Figures
Similar articles
-
Pattern recognition of magnetic resonance imaging-based gray matter volume measurements classifies bipolar disorder and major depressive disorder.J Affect Disord. 2018 Feb;227:498-505. doi: 10.1016/j.jad.2017.11.043. Epub 2017 Nov 13. J Affect Disord. 2018. PMID: 29156364 Free PMC article.
-
Subcortical volumes differentiate Major Depressive Disorder, Bipolar Disorder, and remitted Major Depressive Disorder.J Psychiatr Res. 2015 Sep;68:91-8. doi: 10.1016/j.jpsychires.2015.06.002. Epub 2015 Jun 16. J Psychiatr Res. 2015. PMID: 26228406 Free PMC article.
-
Distinguishing bipolar and major depressive disorders by brain structural morphometry: a pilot study.BMC Psychiatry. 2015 Nov 21;15:298. doi: 10.1186/s12888-015-0685-5. BMC Psychiatry. 2015. PMID: 26590556 Free PMC article. Clinical Trial.
-
Volumetric neuroimaging investigations in mood disorders: bipolar disorder versus major depressive disorder.Bipolar Disord. 2008 Feb;10(1):1-37. doi: 10.1111/j.1399-5618.2008.00435.x. Bipolar Disord. 2008. PMID: 18199239 Review.
-
What we learn about bipolar disorder from large-scale neuroimaging: Findings and future directions from the ENIGMA Bipolar Disorder Working Group.Hum Brain Mapp. 2022 Jan;43(1):56-82. doi: 10.1002/hbm.25098. Epub 2020 Jul 29. Hum Brain Mapp. 2022. PMID: 32725849 Free PMC article. Review.
Cited by
-
Meta-analysis of cortical thickness abnormalities in medication-free patients with major depressive disorder.Neuropsychopharmacology. 2020 Mar;45(4):703-712. doi: 10.1038/s41386-019-0563-9. Epub 2019 Nov 6. Neuropsychopharmacology. 2020. PMID: 31694045 Free PMC article.
-
Morphometric Analysis of Neocortical and Infratentorial Structures: Genetic and Environmental Insights from a Twin Neuroanatomical Study.Medicina (Kaunas). 2025 Feb 4;61(2):261. doi: 10.3390/medicina61020261. Medicina (Kaunas). 2025. PMID: 40005379 Free PMC article.
-
Identifying tripartite relationship among cortical thickness, neuroticism, and mood and anxiety disorders.Sci Rep. 2024 Apr 11;14(1):8449. doi: 10.1038/s41598-024-59108-1. Sci Rep. 2024. PMID: 38600283 Free PMC article.
-
The relationship between brain volumes and intelligence in bipolar disorder.J Affect Disord. 2017 Dec 1;223:59-64. doi: 10.1016/j.jad.2017.07.009. Epub 2017 Jul 6. J Affect Disord. 2017. PMID: 28728036 Free PMC article.
-
Identifying misdiagnosed bipolar disorder using support vector machine: feature selection based on fMRI of follow-up confirmed affective disorders.Transl Psychiatry. 2024 Jan 8;14(1):9. doi: 10.1038/s41398-023-02703-z. Transl Psychiatry. 2024. PMID: 38191549 Free PMC article.
References
-
- Weissman MM, Bland RC, Canino GJ, et al. Cross-national epidemiology of major depression and bipolar disorder. JAMA. 1996;276:293–299. - PubMed
-
- Harris EC, Barraclough B. Suicide as an outcome for mental disorders. A meta-analysis. Br J Psychiatry. 1997;170:205–228. - PubMed
-
- The World Health Report 2002: Reducing Risks, Promoting Healthy Life. Geneva: World Health Organization; 2002. - PubMed
-
- Baldessarini RJ, Vieta E, Calabrese JR, et al. Bipolar depression: overview and commentary. Harv Rev Psychiatry. 2010;18:143–157. - PubMed
-
- Belmaker RH. Bipolar disorder. N Engl J Med. 2004;351:476–486. - PubMed
Publication types
MeSH terms
Grants and funding
- R01 MH040695/MH/NIMH NIH HHS/United States
- K08-MH079033-03/MH/NIMH NIH HHS/United States
- R01 MH040695 21/MH/NIMH NIH HHS/United States
- R01 MH090276/MH/NIMH NIH HHS/United States
- K08-MH67015/MH/NIMH NIH HHS/United States
- K08 MH067015/MH/NIMH NIH HHS/United States
- K08 MH079033/MH/NIMH NIH HHS/United States
- T32 MH015144/MH/NIMH NIH HHS/United States
- R01-MH074813/MH/NIMH NIH HHS/United States
- MH62185/MH/NIMH NIH HHS/United States
- P50 MH062185/MH/NIMH NIH HHS/United States
- R01 MH074813/MH/NIMH NIH HHS/United States
- R01-MH090276-03/MH/NIMH NIH HHS/United States
LinkOut - more resources
Full Text Sources
Other Literature Sources
Medical
