

Understanding epigenetic changes in aging stem cells--a computational model approach
- PMID: 24428552
- PMCID: PMC4331773
- DOI: 10.1111/acel.12177
Understanding epigenetic changes in aging stem cells--a computational model approach
Abstract
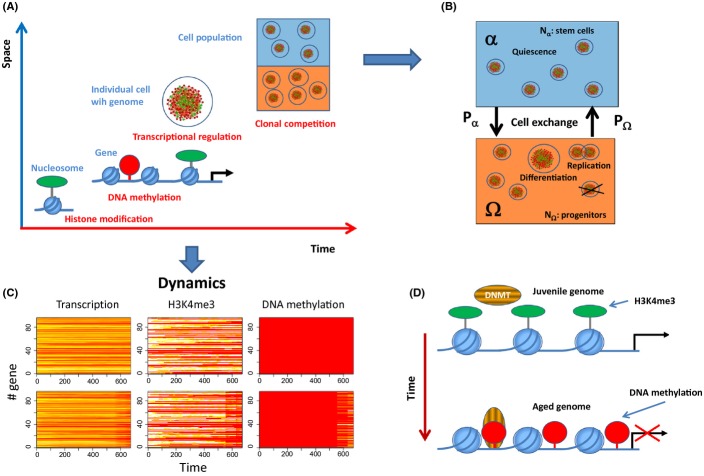
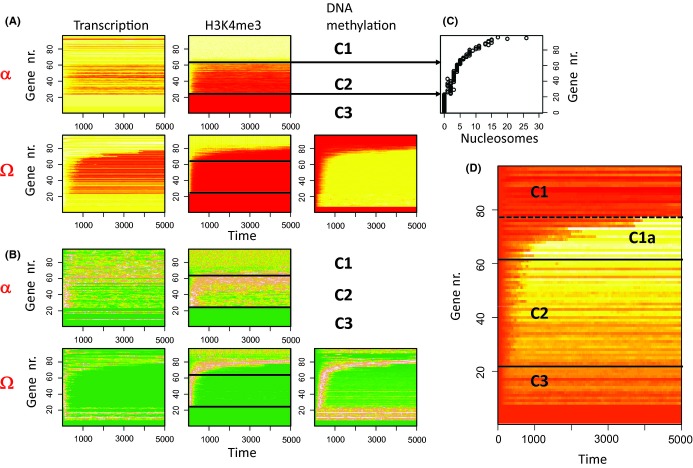
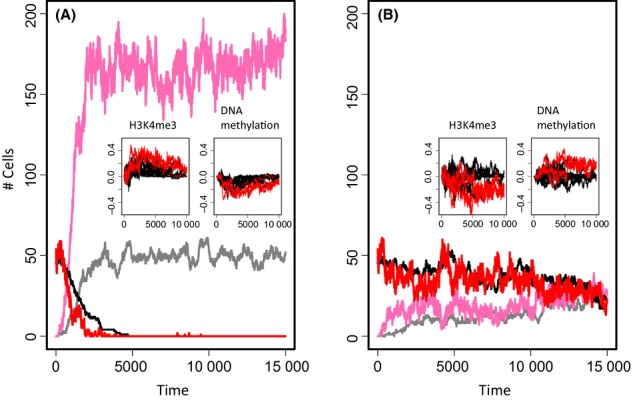
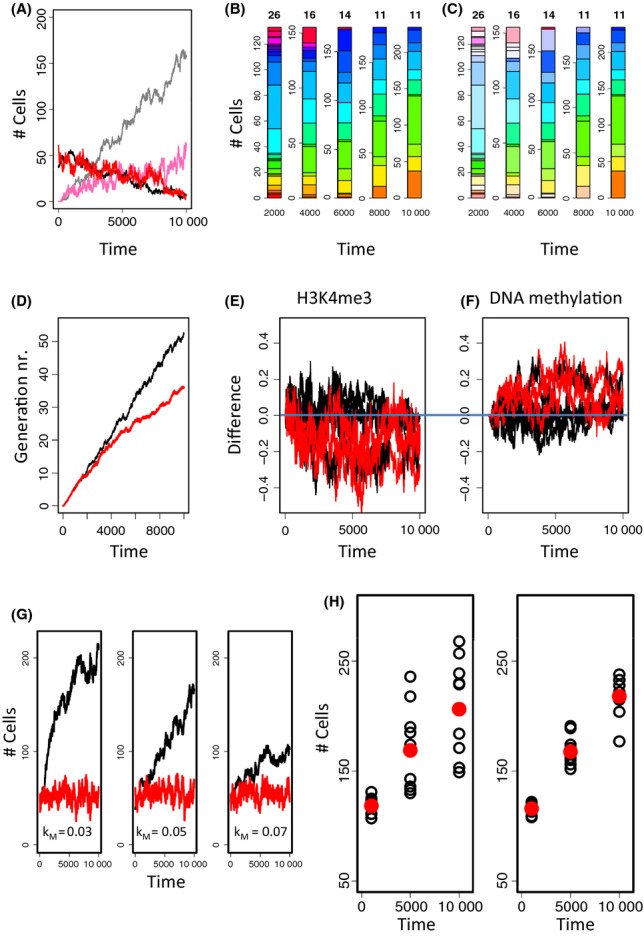
During aging, a decline in stem cell function is observed in many tissues. This decline is accompanied by complex changes of the chromatin structure among them changes in histone modifications and DNA methylation which both affect transcription of a tissue-specific subset of genes. A mechanistic understanding of these age-associated processes, their interrelations and environmental dependence is currently lacking. Here, we discuss related questions on the molecular, cellular, and population level. We combine an individual cell-based model of stem cell populations with a model of epigenetic regulation of transcription. The novel model enables to simulate age-related changes of trimethylation of lysine 4 at histone H3 and of DNA methylation. These changes entail expression changes of genes that induce age-related phenotypes (ARPs) of cells. We compare age-related changes of regulatory states in quiescent stem cells occupying a niche with those observed in proliferating cells. Moreover, we analyze the impact of the activity of the involved epigenetic modifiers on these changes. We find that epigenetic aging strongly affects stem cell heterogeneity and that homing at stem cell niches retards epigenetic aging. Our model provides a mechanistic explanation how increased stem cell proliferation can lead to progeroid phenotypes. Adapting our model to properties observed for aged hematopoietic stem cell (HSC) clones, we predict that the hematopoietic ARP activates young HSCs and thereby retards aging of the entire HSC population. In addition, our model suggests that the experimentally observed high interindividual variance in HSC numbers originates in a variance of histone methyltransferase activity.
Keywords: DNA methylation; aging of stem cells; clonal competition; histone modification; mathematical model; population dynamics.
© 2013 The Authors. Aging Cell published by the Anatomical Society and John Wiley & Sons Ltd.
Figures
Similar articles
-
Epigenetic regulation of hematopoietic stem cell aging.Exp Cell Res. 2014 Dec 10;329(2):192-9. doi: 10.1016/j.yexcr.2014.09.013. Epub 2014 Sep 28. Exp Cell Res. 2014. PMID: 25261778 Free PMC article. Review.
-
Molecular and cellular mechanisms of aging in hematopoietic stem cells and their niches.J Hematol Oncol. 2020 Nov 23;13(1):157. doi: 10.1186/s13045-020-00994-z. J Hematol Oncol. 2020. PMID: 33228751 Free PMC article. Review.
-
DNA methylation drives hematopoietic stem cell aging phenotypes after proliferative stress.Geroscience. 2025 Apr;47(2):1873-1886. doi: 10.1007/s11357-024-01360-4. Epub 2024 Oct 11. Geroscience. 2025. PMID: 39390312 Free PMC article.
-
Hematopoietic Stem Cell Dynamics Are Regulated by Progenitor Demand: Lessons from a Quantitative Modeling Approach.Stem Cells. 2019 Jul;37(7):948-957. doi: 10.1002/stem.3005. Epub 2019 Apr 3. Stem Cells. 2019. PMID: 30897261
-
Aging Human Hematopoietic Stem Cells Manifest Profound Epigenetic Reprogramming of Enhancers That May Predispose to Leukemia.Cancer Discov. 2019 Aug;9(8):1080-1101. doi: 10.1158/2159-8290.CD-18-1474. Epub 2019 May 13. Cancer Discov. 2019. PMID: 31085557 Free PMC article.
Cited by
-
Recent Advances in the Systems Biology of Aging.Antioxid Redox Signal. 2018 Oct 1;29(10):973-984. doi: 10.1089/ars.2017.7367. Epub 2017 Nov 20. Antioxid Redox Signal. 2018. PMID: 29020802 Free PMC article. Review.
-
Systemic Problems: A perspective on stem cell aging and rejuvenation.Aging (Albany NY). 2015 Oct;7(10):754-65. doi: 10.18632/aging.100819. Aging (Albany NY). 2015. PMID: 26540176 Free PMC article. Review.
-
Fighting Against Promoter DNA Hyper-Methylation: Protective Histone Modification Profiles of Stress-Resistant Intestinal Stem Cells.Int J Mol Sci. 2020 Mar 12;21(6):1941. doi: 10.3390/ijms21061941. Int J Mol Sci. 2020. PMID: 32178409 Free PMC article.
-
Different in vivo and in vitro transformation of intestinal stem cells in mismatch repair deficiency.Oncogene. 2017 May 11;36(19):2750-2761. doi: 10.1038/onc.2016.429. Epub 2016 Dec 12. Oncogene. 2017. PMID: 27941880
-
Integration of 'omics' data in aging research: from biomarkers to systems biology.Aging Cell. 2015 Dec;14(6):933-44. doi: 10.1111/acel.12386. Epub 2015 Aug 30. Aging Cell. 2015. PMID: 26331998 Free PMC article. Review.
References
-
- Barth TK, Imhof A. Fast signals and slow marks: the dynamics of histone modifications. Trends Biochem. Sci. 2010;35:618–626. - PubMed
-
- Beerman I, Bock C, Garrison BS, Smith ZD, Gu H, Meissner A, Rossi DJ. Proliferation-dependent alterations of the DNA methylation landscape underlie hematopoietic stem cell aging. Cell Stem Cell. 2013;12:413–425. - PubMed
-
- Bibikova M, Laurent LC, Ren B, Loring JF, Fan JB. Unraveling epigenetic regulation in embryonic stem cells. Cell Stem Cell. 2008;2:123–134. - PubMed
-
- Binder H, Wirth H, Galle J. Gene expression density profiles characterize modes of genomic regulation: theory and experiment. J. Biotechnol. 2010;149:98–114. - PubMed
Publication types
MeSH terms
LinkOut - more resources
Full Text Sources
Other Literature Sources
Medical
Miscellaneous
