. 2014 May;171(9):2351-63.
doi: 10.1111/bph.12585.

Metformin induces PGC-1α expression and selectively affects hepatic PGC-1α functions

Affiliations

Metformin induces PGC-1α expression and selectively affects hepatic PGC-1α functions

Sanna-Mari Aatsinki et al. Br J Pharmacol. 2014 May.

Abstract

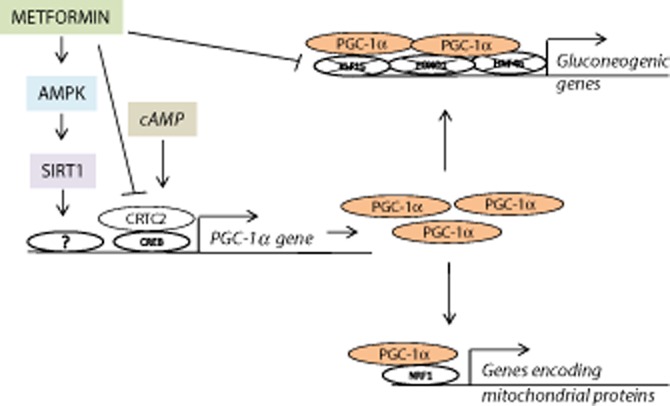
Background and purpose: The objective of this study was to determine how the AMPK activating antidiabetic drug metformin affects the major activator of hepatic gluconeogenesis, PPARγ coactivator 1α (PGC-1α) and liver functions regulated by PGC-1α.

Experimental approach: Mouse and human primary hepatocytes and mice in vivo were treated with metformin. Adenoviral overexpression, siRNA and reporter gene constructs were used for mechanistic studies.

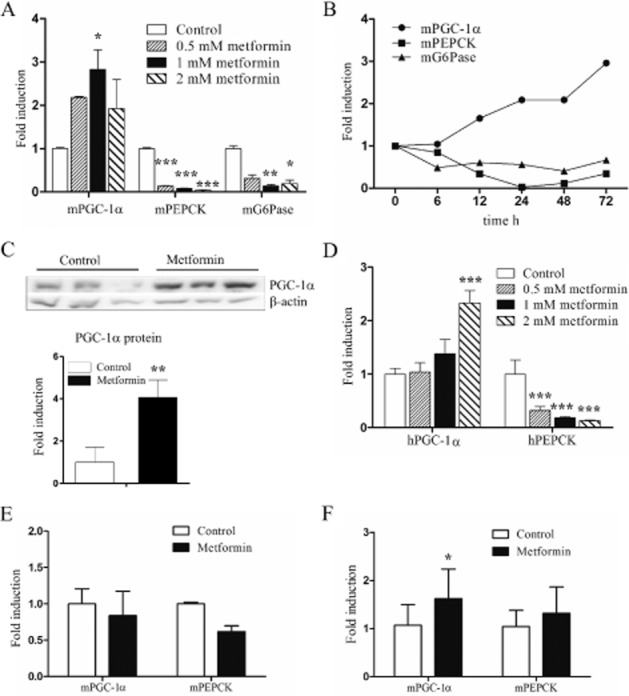
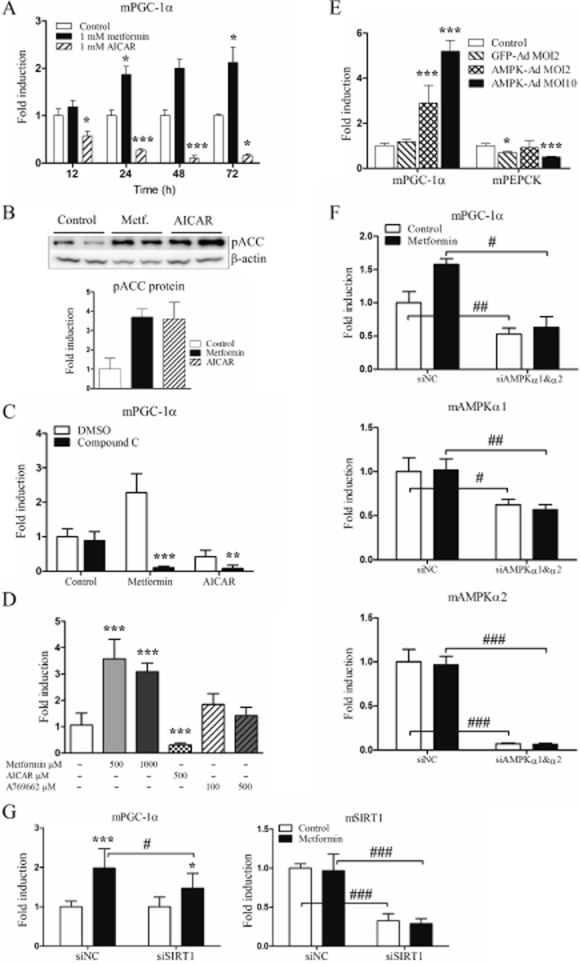
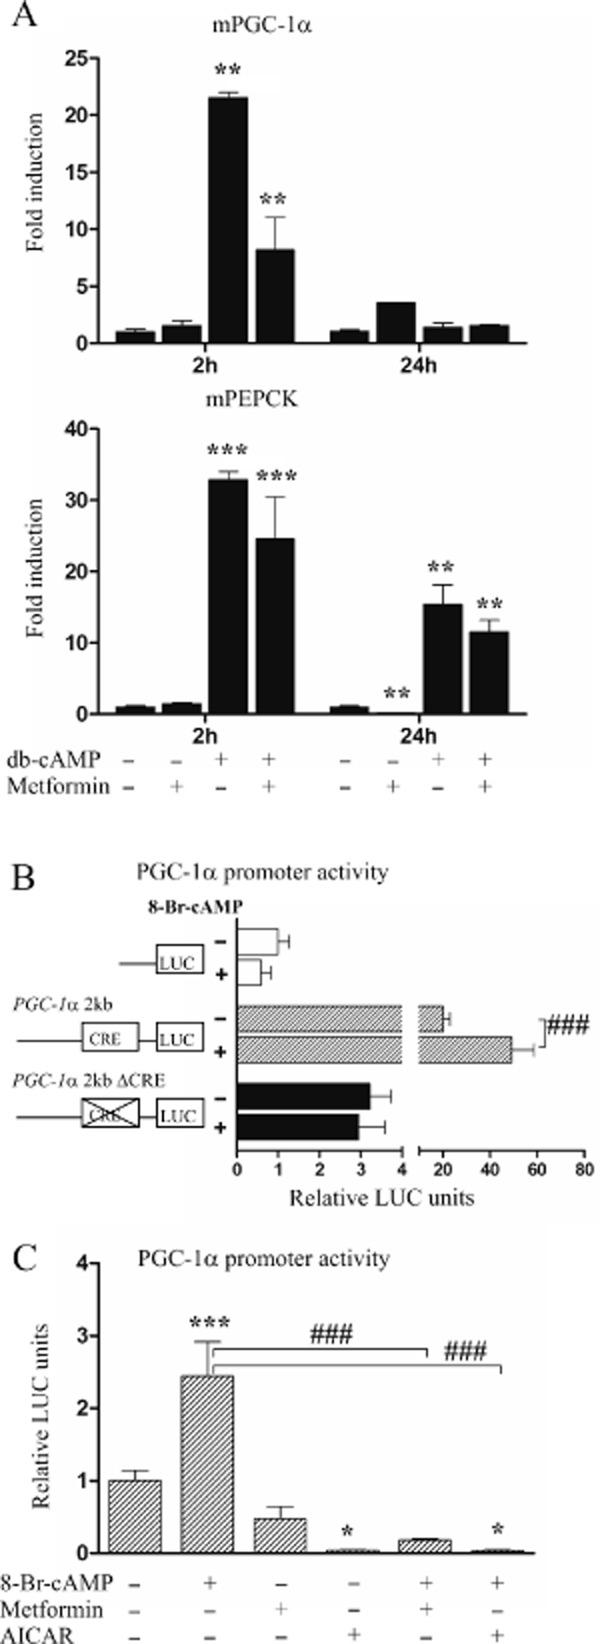
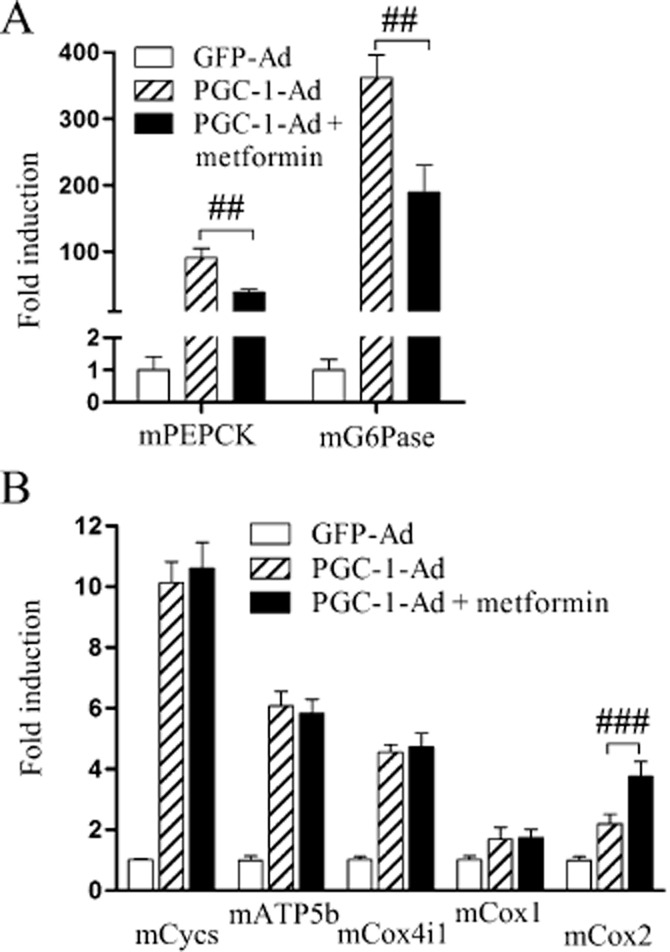
Key results: Metformin increased PGC-1α mRNA and protein expression in mouse primary hepatocytes. 5-Aminoimidazole-4-carboxamide ribonucleotide (AICAR) (another AMPK activator) had the opposite effect. Metformin also increased PGC-1α in human primary hepatocytes; this effect of metformin was abolished by AMPK inhibitor compound C and sirtuin 1 siRNA. AMPK overexpression by AMPK-Ad also increased PGC-1α. Whereas metformin increased PGC-1α, it down-regulated gluconeogenic genes phosphoenolpyruvate carboxykinase (PEPCK) and glucose-6-phosphatase (G6Pase). Furthermore, metformin attenuated the increase in PEPCK and G6Pase mRNAs induced by PGC-1α overexpression, but did not affect PGC-1α-mediated induction of mitochondrial genes. Metformin down-regulated several key transcription factors that mediate the effect of PGC-1α on gluconeogenic genes including Krüppel-like factor 15, forkhead box protein O1 and hepatocyte NF 4α, whereas it increased nuclear respiratory factor 1, which is involved in PGC-1α-mediated regulation of mitochondrial proteins.

Conclusions and implications: Down-regulation of PGC-1α is not necessary for suppression of gluconeogenic genes by metformin. Importantly, metformin selectively affects hepatic PGC-1α-mediated gene regulation and prevents activation of gluconeogenesis, but does not influence its regulation of mitochondrial genes. These results identify selective modulation of hepatic PGC-1α functions as a novel mechanism involved in the therapeutic action of metformin.

Keywords: AMPK; G6Pase; PEPCK; PGC-1α; SIRT1; gluconeogenesis; liver; metformin.


Figures

Figure 1
Figure 1
Effect of metformin treatment on PGC-1α and gluconeogenic gene expression. (A) Mouse primary hepatocytes were treated with metformin for 48 h after which mRNAs were measured by RT-qPCR (n = 3). (B) Mouse primary hepatocytes were treated with 1 mM metformin for the indicated time periods after which mRNAs were measured by RT-qPCR (n = 3, but combined before analysis). (C) PGC-1α protein was detected by immunoblotting in total protein fractions of mouse primary hepatocytes treated with metformin for 48 h. β-Actin was measured as a loading control. (n = 3) (D) Human primary hepatocytes were treated with metformin for 48 h and measured by RT-qPCR (n = 3). (E) Mice were administered metformin i.g. 300 mg·kg−1 daily for 18 days. Livers were collected 24 h after the last dose after which mRNA was isolated from the vehicle (n = 5) or metformin (n = 3) treated individuals and measured by RT-qPCR. Statistical significance was not calculated. (F) Mice were administered metformin i.g. 300 mg·kg−1 daily for 7 days. Livers were collected 3 h after the last dose after which mRNA was isolated from the vehicle (n = 8) or metformin (n = 8) treated individuals and measured by RT-qPCR. qPCR and Western blot results represent means of fold change + SD.
Figure 2
Figure 2
AMPK modulators and AMPK overexpression affect mouse PGC-1α expression level. (A) Mouse primary hepatocytes were treated with 1 mM metformin or 1 mM AICAR for 12, 24, 48 and 72 h after which mRNAs were analysed by RT-qPCR (n = 4). (B) Mouse primary hepatocytes were treated with 1 mM metformin or 1 mM AICAR for 8 h after which cells were sonicated and centrifuged at 13 000× g, supernatant was collected and immunoblotted against pACC antibody. β-Actin was measured as a loading control (n = 2, statistical significance was not calculated). (C) Mouse primary hepatocytes were treated with either 1 mM metformin or 1 mM AICAR alone or combined with 20 μM compound C in DMSO for 24 h after which mRNAs were analysed by RT-qPCR. (n = 4) (D) Mouse primary hepatocytes were treated with metformin, AICAR or A769662 for 48 h after which mRNAs were analysed by RT-qPCR (n = 3). (E) Mouse primary hepatocytes were infected with GFP-Ad (MOI 2) or AMPK-Ad (MOI 2 and 10) for 24 h after which mRNAs were measured using RT-qPCR (n = 3). (F) Mouse primary hepatocytes were transfected with siRNAs; negative control siGFP (siNC) or siAMPKα1 combined with siAMPKα2. Metformin 0.25 mM was added 30 h post-tranfection and incubated for 42 h after which samples were analysed by RT-qPCR (n = 3). (G) Mouse primary hepatocytes were transfected with siRNAs; negative control (siNC) or siSIRT1. Metformin 0.25 mM was added 5 h post-tranfection and incubated for 48 h after which samples were analysed by RT-qPCR (n = 9). qPCR results represent means of fold change + SD and Western blot results means of fold change + range.
Figure 3
Figure 3
Effect of metformin and cAMP on PGC-1α mRNA expression and promoter activity. (A) Mouse primary hepatocytes were treated with 1 mM metformin or 25 μM db-cAMP alone or combined for 2 and 24 h after which mRNA expressions were analysed by RT-qPCR (n = 2). (B) Mouse primary hepatocytes were transfected with 2 kb PGC-1α-LUC wild-type (pGL3-Basic-PGC-1α 2 kb) construct, CRE site mutant construct (pGL3-Basic-PGC-1α-ΔCRE) or promoterless control plasmid (pGL3-Basic) and after 24 h treated with 25 μM 8-bromo-cAMP (8-Br-cAMP) for 24 h (n = 4). (C) Mouse primary hepatocytes were transfected with 2 kb PGC-1α-LUC wild-type (pGL3-Basic-PGC-1α 2 kb) construct and treated with 25 μM 8-Br-cAMP, 1 mM metformin, 500 μM AICAR or combinations for 24 h (n = 4). qPCR results represent means of fold change + range and luciferase results means of relative LUC units + SD.
Figure 4
Figure 4
The functional effect of metformin on gluconeogenesis and selected mitochondrial-acting genes. Mouse primary hepatocytes were infected with PGC-1α-Ad at MOI 1 for 24 h after which 1 mM metformin was added. After 48 h cells were collected and mRNAs analysed by RT-qPCR for measuring (A) PEPCK and G6Pase expression and (B) selected genes encoding mitochondrial proteins. Results are compared with GFP-Ad treatment, set as onefold and normalized to equate the levels of PGC-1α expression between the treatments; (n = 3). qPCR results represent means of fold change + SD.
Figure 5
Figure 5
Effect of metformin on acetylation of PGC-1α and genes regulating PEPCK and G6Pase. (A) HepG2 cells were transfected with PGC-1α-FLAG plasmid and 24 h post transfection treated with 2 mM metformin for 72 h after which FLAG fusion protein was isolated by immunoprecipitation. The protein fractions were immunoblotted against acetylated lysine antibody (Ac-Lys) and PGC-1α antibody was used as a loading control (n = 2, statistical significance was not calculated). (B) Mouse primary hepatocytes were treated with 1 mM metformin or 1 mM AICAR for 12 and 24 h after which mRNAs were analysed by RT-qPCR (n = 4). (C) Mouse primary hepatocytes were treated with 1 mM metformin for 48 and 72 h after which nuclear protein fractions were immunoblotted against HNF-4α antibody and β-actin was used as a loading control (n = 2 for 48 h/n = 3 for 72 h, two/three parallel experiments combined). Immunoblot is representative of one experiment. (D) HepG2 cells were transfected with HNF-4α-TATA-LUC or promoterless control plasmid pGL3-Basic (LUC), and after 24 h were treated with metformin for 24 h (n = 6). Results are relative luciferase units normalized to control LUC set as onefold. qPCR and Western blot results represent means of fold change + range and luciferase results means of relative LUC units + SD.
Figure 6
Figure 6
A proposed model for the effect of metformin on hepatic PGC-1α regulation and function. We propose that metformin activates PGC-1α gene transcription through AMPK and SIRT1. However, metformin represses the increase in PGC-1α induced by cAMP. Furthermore, metformin prevents the ability of PGC-1α to induce gluconeogenic genes.

References

    1. Amat R, Planavila A, Chen SL, Iglesias R, Giralt M, Villarroya F. SIRT1 controls the transcription of the peroxisome proliferator-activated receptor-gamma co-activator-1alpha (PGC-1alpha) gene in skeletal muscle through the PGC-1alpha autoregulatory loop and interaction with MyoD. J Biol Chem. 2009;284:21872–21880. - PMC - PubMed
    1. Arpiainen S, Jarvenpaa SM, Manninen A, Viitala P, Lang MA, Pelkonen O, et al. Coactivator PGC-1alpha regulates the fasting inducible xenobiotic-metabolizing enzyme CYP2A5 in mouse primary hepatocytes. Toxicol Appl Pharmacol. 2008;232:135–141. - PubMed
    1. Buler M, Aatsinki SM, Izzi V, Hakkola J. Metformin reduces hepatic expression of SIRT3, the mitochondrial deacetylase controlling energy metabolism. PLoS ONE. 2012;7:e49863. - PMC - PubMed
    1. Canto C, Gerhart-Hines Z, Feige JN, Lagouge M, Noriega L, Milne JC, et al. AMPK regulates energy expenditure by modulating NAD+ metabolism and SIRT1 activity. Nature. 2009;458:1056–1060. - PMC - PubMed
    1. Caton PW, Nayuni NK, Kieswich J, Khan NQ, Yaqoob MM, Corder R. Metformin suppresses hepatic gluconeogenesis through induction of SIRT1 and GCN5. J Endocrinol. 2010;205:97–106. - PubMed

Publication types

Substances