

Temporal trends and racial/ethnic disparity in self-reported pediatric food allergy in the United States
- PMID: 24428971
- PMCID: PMC3950907
- DOI: 10.1016/j.anai.2013.12.007
Temporal trends and racial/ethnic disparity in self-reported pediatric food allergy in the United States
Abstract
Background: The prevalence of food allergy is thought to be increasing, but data from the United States have not been systematically synthesized.
Objective: To summarize the data on prevalence of food allergy in the US pediatric population and to estimate the effects of time, race/ethnicity, and method of assessing food allergy on the estimated prevalence.
Methods: Embase, MEDLINE, bibliographies of identified reports, and data from publically available data sets were searched. Studies were limited to those in English with data from the general pediatric US population. Study synthesis was performed by meta-analysis and meta-regression to estimate the effect of study- and participant-level covariates. Meta-regression was limited to nationally representative surveys conducted by the Centers for Disease Control and Prevention.
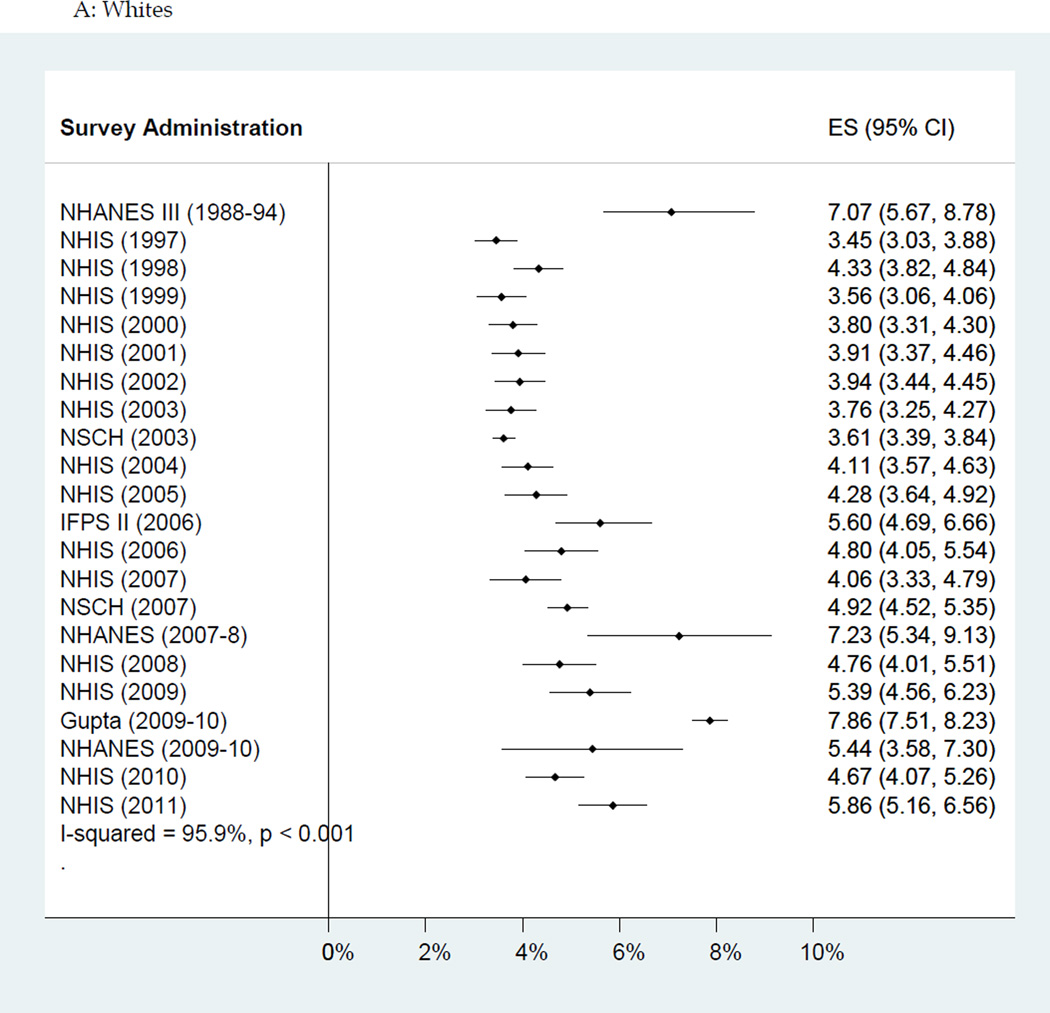
Results: A total of 10,090 publications were identified, from which 27 different survey administrations, representing 452,237 children, were identified, covering the period of 1988 to 2011. Because of heterogeneity among surveys in the estimated food allergy prevalence, a summary estimate of food allergy prevalence was not possible. Meta-regression was performed using 20 of these surveys. Temporal trends were pronounced, with an estimated increased prevalence of self-reported food allergy of 1.2 percentage points per decade (95% confidence interval [CI], 0.7-1.6). The increase per decade varied by race/ethnicity: 2.1% among non-Hispanic blacks (95% CI, 1.5%-2.7%), 1.2% among Hispanics (95% CI, 0.7%-1.7%), and 1.0% among non-Hispanic whites (95% CI, 0.4%-1.6%).
Conclusion: Self-report of food allergy among US children has sharply increased in the past 2 decades. The increase has been greatest among non-Hispanic black children, a disparity that needs to be investigated.
Copyright © 2014 American College of Allergy, Asthma & Immunology. Published by Elsevier Inc. All rights reserved.
Conflict of interest statement
Conflict of Interest: Jessica Savage has received research support from the American Academy of Allergy, Asthma and Immunology and the Food Allergy and Anaphylaxis Network. Robert Wood discloses consulting with the Asthma and Allergy Foundation of America, royalties from Up-to-Date, and service on the Medical Advisory Board to the Food Allergy and Anaphylaxis Network. Elizabeth Matsui discloses receipt of a monetary award from ThermoFisher. Corinne Keet, Shannon Seopaul and Roger Peng have no pertinent disclosures.
Figures


References
-
- Rona RJ, Keil T, Summers C, et al. The prevalence of food allergy: A meta-analysis. Journal of Allergy and Clinical Immunology. 2007;120(3):638–646. - PubMed
-
- Chafen JJS, Newberry SJ, Riedl MA, et al. Diagnosing and managing common food allergies: A systematic review. JAMA - Journal of the American Medical Association. 2010;303(18):1848–1856. - PubMed
-
- Greenhawt MWC, Conte ML, Doucet M, Engler A, Carmargo CA. Racial and Ethnic Disparity in Food Allergy in the United States: A Systematic Review. Journal of Allergy and Clinical Immunology: In Practice. 2013 Jul;1(4):378–386. - PubMed
-
- Ben-Shoshan M, Turnbull E, Clarke A. Food allergy: temporal trends and determinants. Curr Allergy Asthma Rep. 2012 Aug;12(4):346–372. - PubMed
Publication types
MeSH terms
Grants and funding
LinkOut - more resources
Full Text Sources
Other Literature Sources
Medical
Miscellaneous
