. 2014 Feb 28;289(9):6028-40.
doi: 10.1074/jbc.M113.511808. Epub 2014 Jan 15.

Phosphatidylinositol 4,5-biphosphate (PIP2) modulates interaction of syntaxin-1A with sulfonylurea receptor 1 to regulate pancreatic β-cell ATP-sensitive potassium channels

Affiliations

Phosphatidylinositol 4,5-biphosphate (PIP2) modulates interaction of syntaxin-1A with sulfonylurea receptor 1 to regulate pancreatic β-cell ATP-sensitive potassium channels

Tao Liang et al. J Biol Chem. .

Abstract

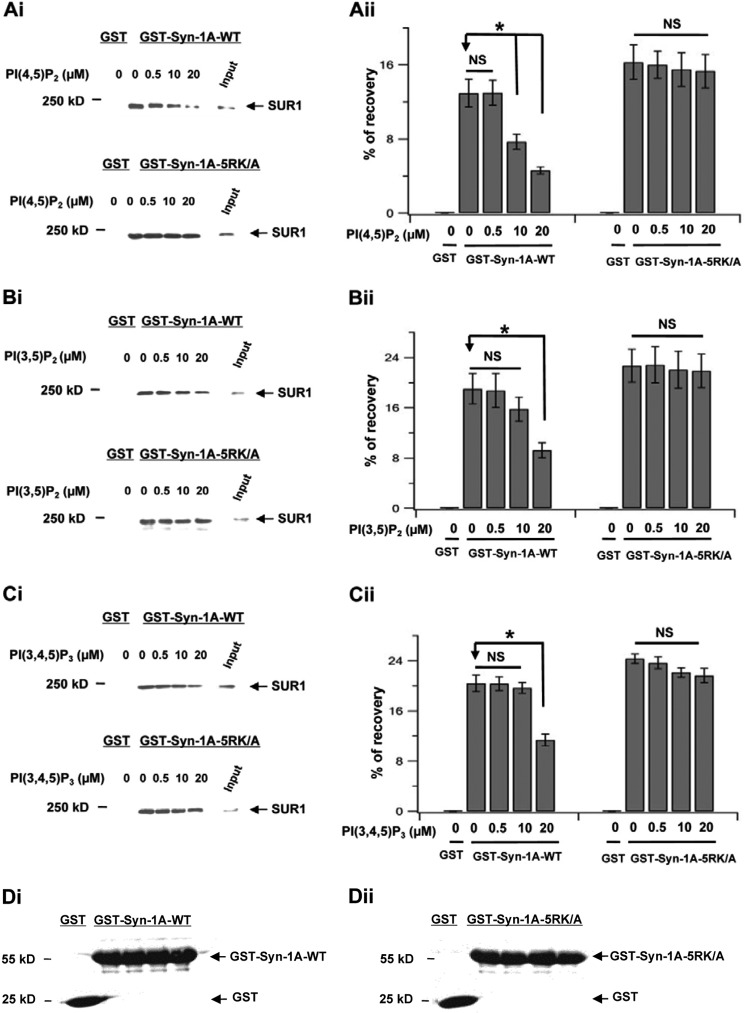
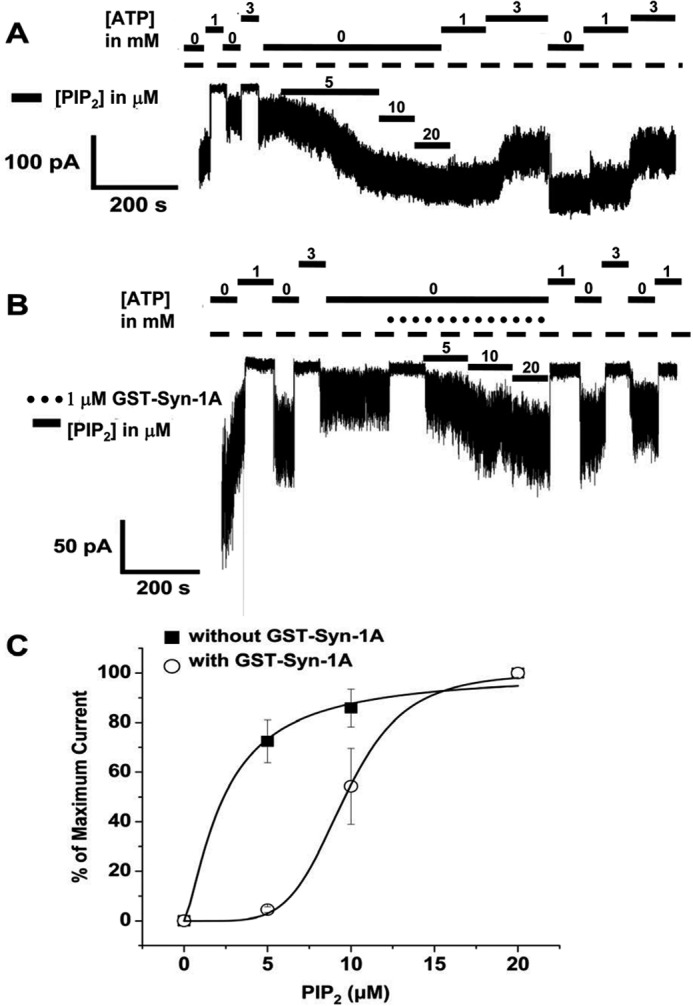
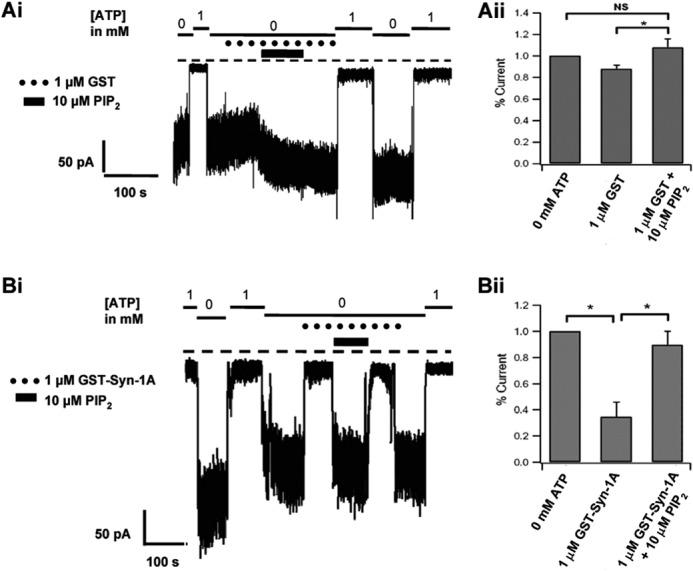
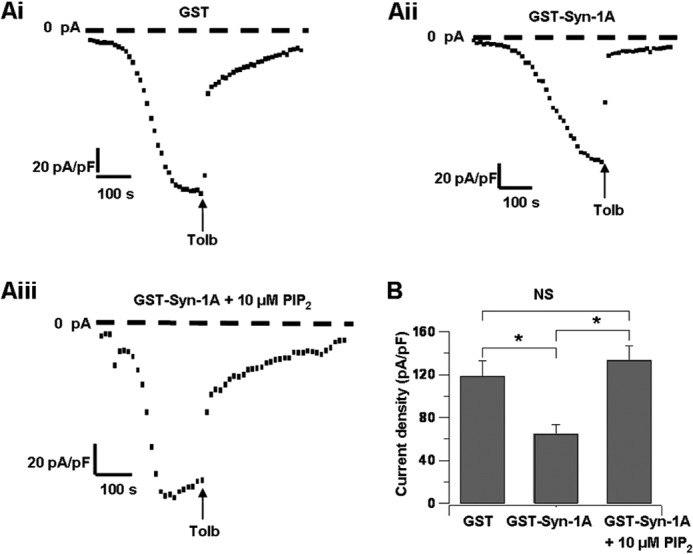
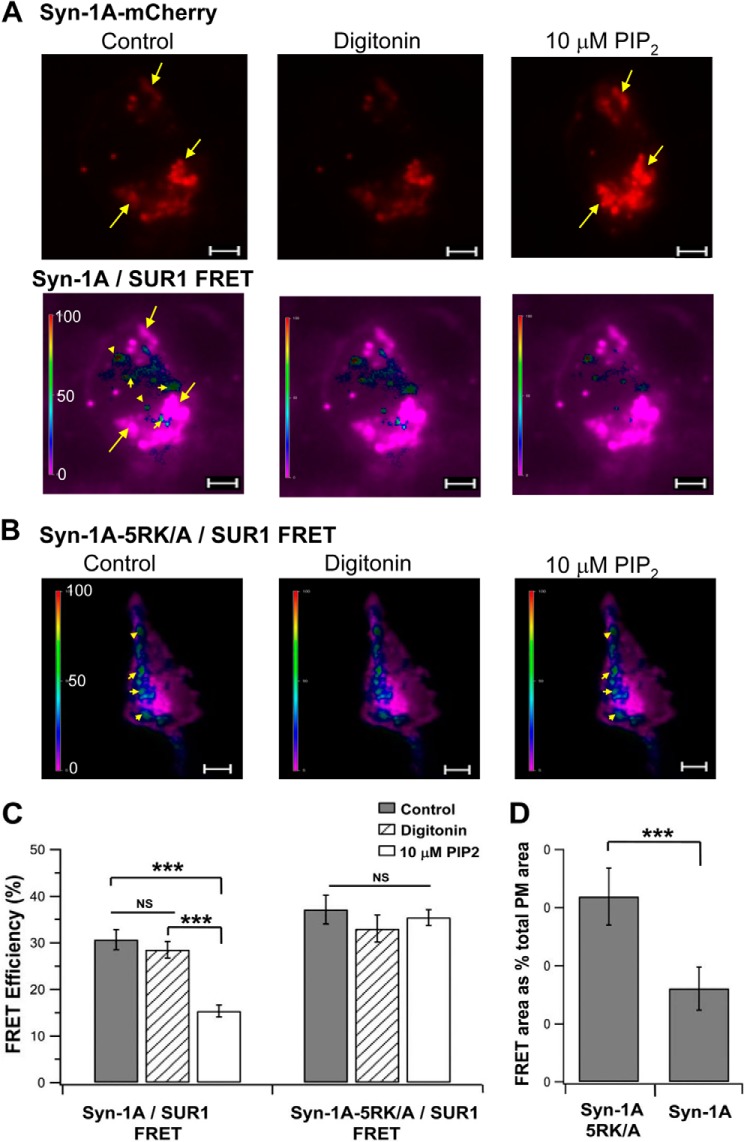
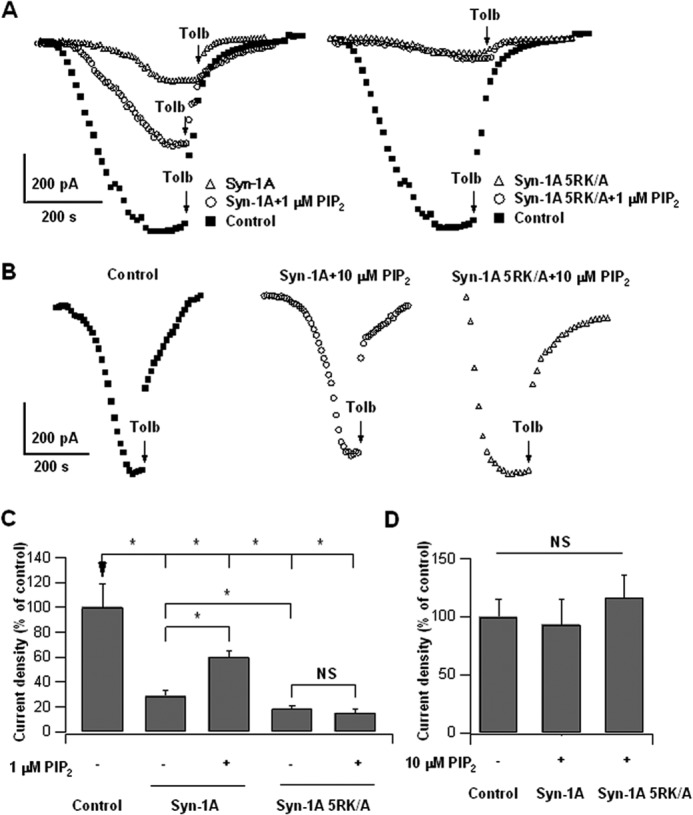
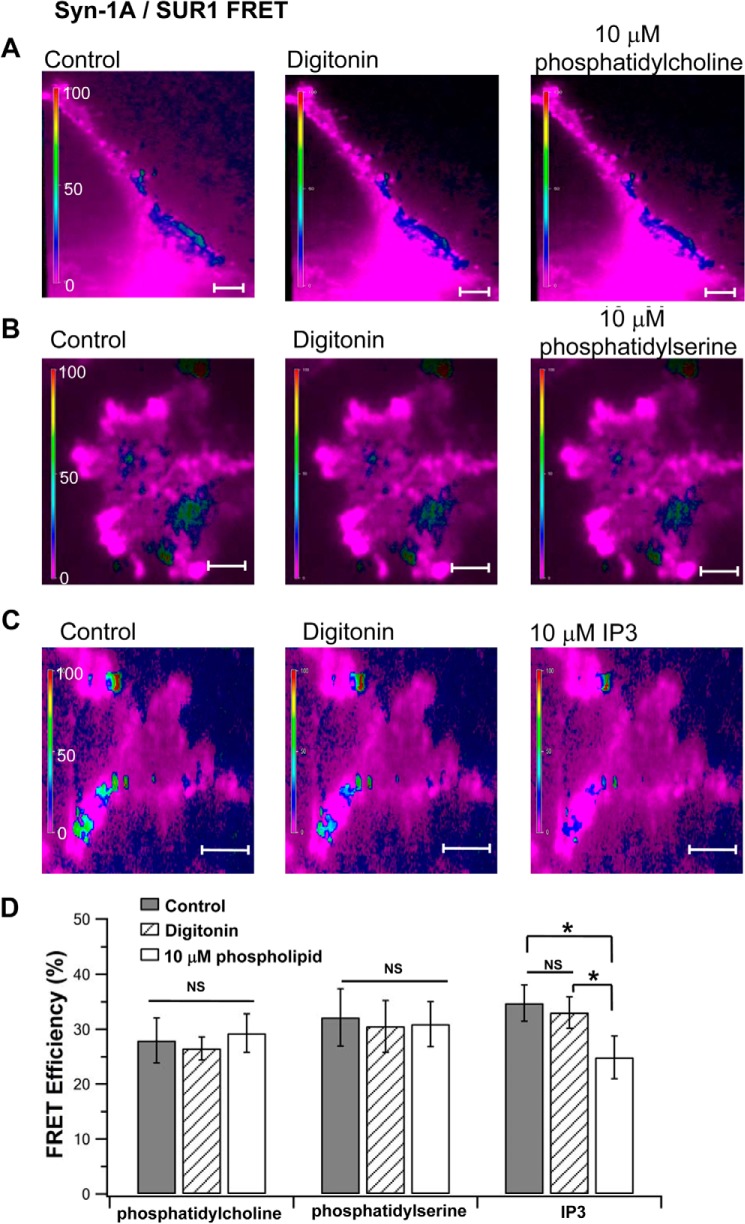
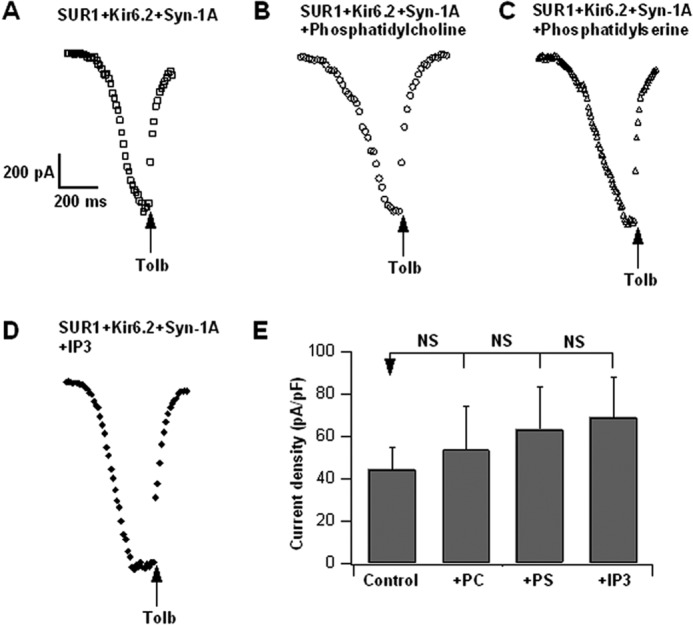
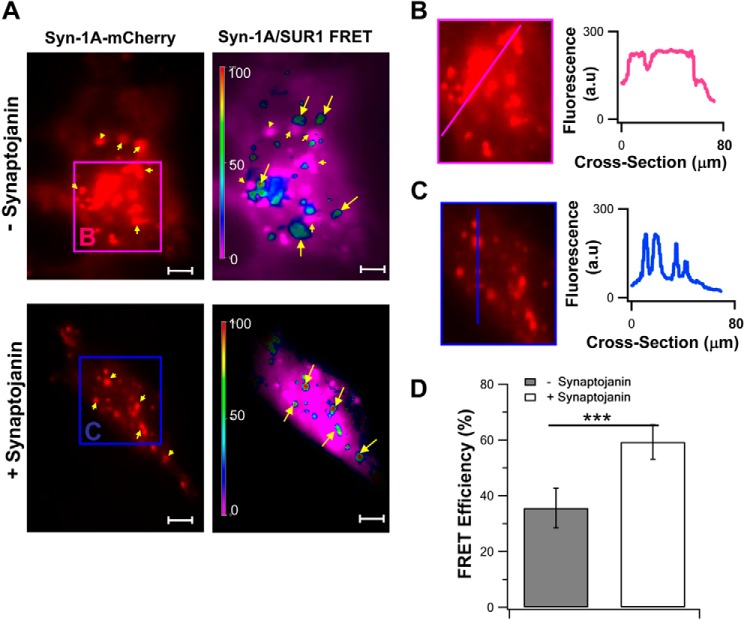
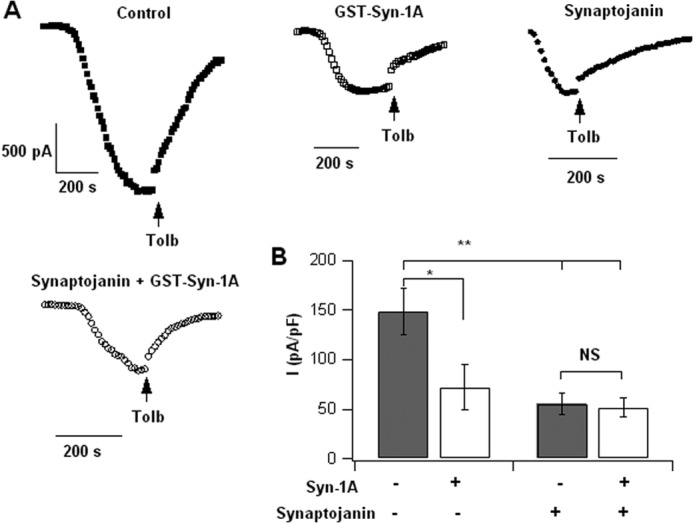
In β-cells, syntaxin (Syn)-1A interacts with SUR1 to inhibit ATP-sensitive potassium channels (KATP channels). PIP2 binds the Kir6.2 subunit to open KATP channels. PIP2 also modifies Syn-1A clustering in plasma membrane (PM) that may alter Syn-1A actions on PM proteins like SUR1. Here, we assessed whether the actions of PIP2 on activating KATP channels is contributed by sequestering Syn-1A from binding SUR1. In vitro binding showed that PIP2 dose-dependently disrupted Syn-1A·SUR1 complexes, corroborated by an in vivo Forster resonance energy transfer assay showing disruption of SUR1(-EGFP)/Syn-1A(-mCherry) interaction along with increased Syn-1A cluster formation. Electrophysiological studies of rat β-cells, INS-1, and SUR1/Kir6.2-expressing HEK293 cells showed that PIP2 dose-dependent activation of KATP currents was uniformly reduced by Syn-1A. To unequivocally distinguish between PIP2 actions on Syn-1A and Kir6.2, we employed several strategies. First, we showed that PIP2-insensitive Syn-1A-5RK/A mutant complex with SUR1 could not be disrupted by PIP2, consequently reducing PIP2 activation of KATP channels. Next, Syn-1A·SUR1 complex modulation of KATP channels could be observed at a physiologically low PIP2 concentration that did not disrupt the Syn-1A·SUR1 complex, compared with higher PIP2 concentrations acting directly on Kir6.2. These effects were specific to PIP2 and not observed with physiologic concentrations of other phospholipids. Finally, depleting endogenous PIP2 with polyphosphoinositide phosphatase synaptojanin-1, known to disperse Syn-1A clusters, freed Syn-1A from Syn-1A clusters to bind SUR1, causing inhibition of KATP channels that could no longer be further inhibited by exogenous Syn-1A. These results taken together indicate that PIP2 affects islet β-cell KATP channels not only by its actions on Kir6.2 but also by sequestering Syn-1A to modulate Syn-1A availability and its interactions with SUR1 on PM.

Keywords: ATP-sensitive Potassium Channel; Insulin Secretion; Kir6.2; PIP2; Phospholipid; Plasma Membrane; Potassium Channels; SNARE Proteins; SUR1; Syntaxin-1A.


Figures

FIGURE 1.
FIGURE 1.
Exogenously added PIP2 disruption of Syn-1A·SUR1 complex formation. GST-Syn-1A-WT or GST-Syn-1A-5RK/A and GST (as control) were used to pull down SUR1 from HEK293 cells co-transfected with SUR1 and Kir6.2 in presence of indicated concentrations of the following inositol phospholipids: PIP2 (PI(4,5)P2 in A), PI(3,5)P2 (B), and PI(3,4,5)P3 (C). i (in A–C), representative blots showing the effects of increasing inositol phospholipids concentrations in disrupting Syn-1A binding to SUR1 (top) but not Syn-1A-5RK/A binding to SUR1 (bottom). ii (in A–C), summary of three separate experiments, with each band normalized as a percentage of the input (400-μg protein of HEK cell lysate extract; see “Experimental Procedures”). Data are expressed as mean ± S.E. (error bars); *, p < 0.05. NS, not significant. D, 20 μg of protein of GST-Syn-1A or GST-Syn-1A-5RK/A and control GST uniformly used in all of the samples of these experiments was assessed by Ponceau S staining. A representative sample in D shows equal amounts used. i, GST-Syn-1A WT; ii, GST-Syn-1A-5RK/A.
FIGURE 2.
FIGURE 2.
Inside-out patch recording of INS-1 cells showing that PIP2 dose-dependent activation of KATP channels is reduced by Syn-1A. Shown are representative traces of the protocol utilized for PIP2 (as shown) in the absence (A) or presence (B) of 1 μm GST-Syn-1A. Membrane patches were initially exposed to 0, 1, and 3 mm ATP Kint solution to characterize KATP channels and verify the ATP sensitivity of the currents recorded. C, PIP2 dose-dependent activation of KATP current in the absence (n = 5) and presence of Syn-1A (n = 3). Results are mean ± S.E. (error bars).
FIGURE 3.
FIGURE 3.
Inside-out patch recording of INS-1 cells showing PIP2 activation KATP currents exceeds PIP2-mediated recovery of Syn-1A inhibition of KATP currents. Representative KATP current tracings of 1 μm GST with 10 μm PIP2 (Ai) and 1 μm GST-Syn-1A with 10 μm PIP2 (Bi) and their respective summary data (Aii and Bii; n = 5 cells each) of the maximum current (in 0 mm ATP Kint solution). Here, membrane patches were initially exposed to 0 and 1 mm ATP Kint solution. Results are mean ± S.E. (error bars); *, p < 0.05; NS, not significant.
FIGURE 4.
FIGURE 4.
Whole-cell recording of rat islet β-cells showing PIP2 actions on Syn-1A to functionally disrupt Syn-1A·SUR1 interactions. A, representative KATP currents with 1 μm GST (i), 1 μm GST-Syn-1A (ii), or 1 μm GST-Syn-1A plus 10 μm PIP2 (iii) dialyzed into β-cells. Tolbultamide (Tolb; 0.1 mm) was added to verify the KATP current. B, summary data of A showing maximum current density with 1 μm GST (n = 6), 1 μm GST-Syn-1A (n = 8), or 1 μm GST-Syn-1A plus 10 μm PIP2 (n = 11). Results are mean ± S.E. (error bars); *, p < 0.05.
FIGURE 5.
FIGURE 5.
In vivo TIRFM FRET imaging showing that PIP2 disrupts Syn-1A WT but not PIP2-insensitive Syn-1A-5RK/A binding to SUR1. Shown in A and B are representative recordings of FRET signals on the PM (indicated by different pseudocolors) of HEK cell expressing WT-Syn-1A-mCherry (A) or Syn-1A-5RK/A-mCherry (B), SUR1-EGFP, and Kir6.2 prior to (control) and after the addition of 10 μm PIP2 to the permeabilized cells. In A, the Syn-1A-mCherry fluorescent images are also shown (top images). Arrows in A, Syn-1A-mCherry hotspots; arrowheads in A and B, FRET hotspots. Scale bar, 5 μm. A vertical scale bar indicates FRET efficiency in pseudocolor. C, summary of FRET efficiency represented by images in A (n = 17) and B (n = 13). D, percentage of FRET fluorescent area on PM as a percentage of total PM area under control conditions (n = 13). Results are mean ± S.E. (error bars); ***, p < 0.001; NS, not significant.
FIGURE 6.
FIGURE 6.
Syn-1A-5RK/A inhibition of KATP channels is resistant to physiologic low PIP2 (1 μm) but not high PIP2 (10 μm) opening of KATP channels. A, representative KATP channel current tracings of Syn-1A-WT- (left traces) and PIP2-insensitive Syn-1A-5RK/A-expressing INS-1 cells (right traces), treated with or without 1 μm PIP2 (in pipette solution). Note PIP2 partial reversal of Syn-1A inhibition (left traces) but not of Syn-1A-RK/A inhibition (right traces). B, representative KATP channel current traces from control (left), Syn-1A WT (middle), and Syn-1A-5RK/A (right)-overexpressing INS-1 cells treated without or with 10 μm PIP2 (in pipette solution). C, summary of A, n = 6–12 cells. D, summary of B showing no difference in current densities between control (n = 8), Syn-1A WT-expressing (n = 9), and Syn-1A-5RK/A-expressing (n = 11) cells. Results are mean ± S.E. (error bars); *, p < 0.05; NS, not significant.
FIGURE 7.
FIGURE 7.
In vivo FRET TIRFM imaging showing other phospholipids had little or no effect on Syn-1A·SUR1 complexes. 10 μm phosphatidylcholine (A), phosphatidyl-l-serine (B), and IP3 (C) were added to digitonin-permeabilized HEK cells expressing WT-Syn-1A-mCherry and SUR1-EGFP (as in Fig. 5). Shown are representative cells for each condition. D, summary of FRET efficiency (mean ± S.E. (error bars)) of A (n = 14), B (n = 13), and C (n = 15). *, p < 0.01; NS, not significant.
FIGURE 8.
FIGURE 8.
WT Syn-1A inhibition of KATP channels is resistant to other phospholipids. Representative KATP channel current tracings of SUR1 + Kir6.2 + Syn-1A-WT-expressing HEK293 cells, control (A) or treated with 10 μm phosphatidylcholine (B), phosphatidyl-l-serine (C), or inositol 1,4,5-trisphosphate (IP3) (D) in the pipette solution. E, summary showing no difference in current densities between control cells (n = 7) and each of the phospholipid-treated cells (phosphatidylcholine, n = 6; phosphatidyl-l-serine, n = 6; IP3, n = 6). Results are means ± S.E. (error bars); NS, not significant.
FIGURE 9.
FIGURE 9.
TIRFM FRET imaging showing that PIP2 depletion from PM disperses Syn-1A clusters, releasing Syn-1A to form complexes with SUR1. A, representative image recordings of Syn-1A-mCherry and corresponding FRET signals on the PM (indicated by different pseudocolors) of HEK293 cells expressing Syn-1A-mCherry, SUR1-EGFP, and Kir6.2. The top images show that Syn-1A-mCherry (indicated by arrowheads) clustered in microdomains (region B; pink box). Synaptojanin-1 expression to reduce endogenous PIP2 levels (bottom images in A) dispersed Syn-1A clusters into smaller Syn-1A-mCherry hotspots (region C; blue box). B and C, magnifications of the indicated regions in (A), wherein we analyzed the intensity profile of the cross-sections along the pink and blue lines, shown in the graphs on the right. D, summary of FRET efficiency represented by images in A (mean ± S.E. (error bars), n = 14 cells for each group; ***, p < 0.001).
FIGURE 10.
FIGURE 10.
PIP2 depletion from PM disables exogenous Syn-1A from further inhibiting KATP channels. A, representative KATP channel current tracings of control, GST-Syn-1A (1 μm infused into cells via patch pipette), synaptojanin-1, and synaptojanin + GST-Syn-1A in INS-1 cells. B, summary results showing that exogenous GST-Syn-1A could not cause further inhibition of KATP channels when endogenous PIP2 levels were depleted by synaptojain-1. Results are mean ± S.E.; *, p < 0.05; **, p < 0.01. NS, not significant.

References

    1. Aittoniemi J., Fotinou C., Craig T. J., de Wet H., Proks P., Ashcroft F. M. (2009) Review. SUR1. A unique ATP-binding cassette protein that functions as an ion channel regulator. Philos. Trans. R. Soc. Lond. B Biol. Sci. 364, 257–267 - PMC - PubMed
    1. Aguilar-Bryan L., Bryan J. (1999) Molecular biology of adenosine triphosphate-sensitive potassium channels. Endocr. Rev. 20, 101–135 - PubMed
    1. Nichols C. G., Shyng S. L., Nestorowicz A., Glaser B., Clement J. P., 4th, Gonzalez G., Aguilar-Bryan L., Permutt M. A., Bryan J. (1996) Adenosine diphosphate as an intracellular regulator of insulin secretion. Science 272, 1785–1787 - PubMed
    1. Hou J. C., Min L., Pessin J. E. (2009) Insulin granule biogenesis, trafficking and exocytosis. Vitamins and hormones. Vitam. Horm. 80, 473–506 - PMC - PubMed
    1. Ashcroft F. M., Gribble F. M. (1999) Differential sensitivity of beta-cell and extrapancreatic K(ATP) channels to gliclazide. Diabetologia 42, 903–919 - PubMed

Publication types

LinkOut - more resources