. 2014 Apr;24(4):616-28.
doi: 10.1101/gr.165035.113. Epub 2014 Jan 15.

Evolutionary dynamics and tissue specificity of human long noncoding RNAs in six mammals

Affiliations

Evolutionary dynamics and tissue specificity of human long noncoding RNAs in six mammals

Stefan Washietl et al. Genome Res. 2014 Apr.

Abstract

Long intergenic noncoding RNAs (lincRNAs) play diverse regulatory roles in human development and disease, but little is known about their evolutionary history and constraint. Here, we characterize human lincRNA expression patterns in nine tissues across six mammalian species and multiple individuals. Of the 1898 human lincRNAs expressed in these tissues, we find orthologous transcripts for 80% in chimpanzee, 63% in rhesus, 39% in cow, 38% in mouse, and 35% in rat. Mammalian-expressed lincRNAs show remarkably strong conservation of tissue specificity, suggesting that it is selectively maintained. In contrast, abundant splice-site turnover suggests that exact splice sites are not critical. Relative to evolutionarily young lincRNAs, mammalian-expressed lincRNAs show higher primary sequence conservation in their promoters and exons, increased proximity to protein-coding genes enriched for tissue-specific functions, fewer repeat elements, and more frequent single-exon transcripts. Remarkably, we find that ∼20% of human lincRNAs are not expressed beyond chimpanzee and are undetectable even in rhesus. These hominid-specific lincRNAs are more tissue specific, enriched for testis, and faster evolving within the human lineage.


Figures

Figure 1.
Figure 1.
Definition of the lincRNA set. (A) Filtering steps of all GENCODE noncoding transcripts to the final set of lincRNAs used for further analysis in this study. (B) Cumulative distribution of RNAcode (Washietl et al. 2011) P-values measuring the coding potential of transcripts. The P-value cutoff of 0.01 is indicated, and for comparison the distributions for coding transcripts and randomized transcripts are also shown. (C) Distribution of normalized expression levels in human. The maximum FPKM (fragments per million reads per kb of transcript) over all tissues is shown. The cutoff was chosen empirically using randomized transcripts (Methods) as the background distribution and requiring a significance level of 0.05. If read counts were zero, we set the count to 10−3, explaining the discontinuous shape of the curves.
Figure 2.
Figure 2.
Conservation of lincRNA expression across placental mammals. (A) Cumulative distributions of normalized read counts (number of reads per million reads in the library per kb of the transcript portion that could be aligned to the other species). The maximum of this normalized count of all tissues is considered for the distribution shown. We use a floor of 10−3 whenever no reads were found in any tissue or the transcript could not be aligned. (B) Fraction of human lincRNAs that were detected in other species. A lincRNA is counted as detected if it either was expressed with an empirical P-value of P < 0.1 compared to random regions or if it is supported by conserved splice sites (Methods). In comparison, the detection rate for mRNAs with similar expression levels as the lincRNAs are shown (to be conservative in this comparison, we only used the expression P-value cutoff because mRNAs have more and better conserved splice sites). (C) Conservation patterns of individual lincRNAs. The fraction at the tips of the phylogenetic tree corresponds to the fraction of detected lincRNAs in B. The fractions for the inner nodes are estimated using a parsimony approach (Methods). D and E show the actual read patterns observed in the different species for two lincRNA examples. Read counts were normalized between 0 and 1 for each line; only positions with absolute read coverage greater than five are shown. For rhesus, cow, mouse, and rat, all three replicates are shown (indicated by a, b, c). Example D shows a lincRNA well-supported in human and chimpanzee but absent in all replicates in the more distantly related mammals. Example E shows a transcript conserved in all species also supported by all replicates.
Figure 3.
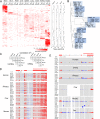
Figure 3.
Tissue specificity of lincRNAs across species. (A) Heatmap of normalized expression values (see Methods) for all tissues and species. Data is only shown for lincRNAs that have significant (P < 0.1; Methods) expression in rhesus, cow, mouse, and rat. On the right of the heatmap, a normalized tissue specificity score is shown for all species (Methods). (B) Neighbor-joining tree generated from the similarity matrix of expression values across all lincRNAs in all tissues and species. (C) Correlation of expression between species across all tissues for lincRNAs and mRNAs. D and E show examples of a lincRNA ubiquitously expressed in all tissues and a lincRNA highly restricted to kidney, respectively. The same conventions as in Figure 2 are used.
Figure 4.
Figure 4.
Conservation of splicing patterns across species. (A) Conservation of exon boundaries. The distributions show the difference of exon boundaries of reference exons from the human GENCODE annotation and predicted exons in the other species. (B) Normalized read density in a window of 50 nucleotides around splice sites in human and mouse. Both 5′- and 3′-splice sites are shown. Only splice sites for which at least half of the positions could be aligned in mouse were considered. The graph at the bottom right shows the SiPhy conservation scores for splice sites in mouse. The mean score averaged over all aligned positions in the 50-nt window and a running average over 100 splice sites is shown. (C) Averaged normalized read count in a 50-nt window around 3′- and 5′-splice sites in human, rhesus, cow, and mouse. Again, only splice sites with more than half the positions in the window aligned were considered. Also, only “split reads” that map to two regions across an exon/intron boundary were counted. (D) Splice-site conservation patterns of individual transcripts. Each line represents a transcript. Each group of boxes represents a splice site (both 3′- and 5′-sites are shown separately, i.e., two splice sites means a transcript has two exons and one intron). Each box within a group indicates the conservation status in the different species. All multiexon lincRNAs are shown for which we could detect significant expression (P < 0.1; Methods) in human, chimpanzee, rhesus, cow, mouse, and rat. All known lincRNAs from lincRNAdb are included and highlighted with their name. If a locus had multiple isoforms, the isoform with the most confirmed human splice sites is shown, which is not necessarily the most abundant transcript.
Figure 5.
Figure 5.
Differences between hominid-specific lincRNAs and lincRNAs conserved across mammals. Distributions are shown as box plots indicating the first quartile, median, and third quartile. Whiskers represent the range of the data without outliers. (A) Normalized expression level in human. The highest expression in all tissues is shown. (B) Repeat content. The fraction of repeat-masked bases in the exons (union over all isoforms) of a lincRNA locus and in the putative transcription start site (window 350 upstream and 150 around the annotated transcript start) is shown. (C) Sequence conservation as measured by SiPhy for exons and putative transcription start site (Methods). (D) Tissue specificity score (Methods). (Left) All lincRNAs of both sets are considered. (Right) lincRNAs that have a relative expression level higher than 0.8 in testis were removed. (E) Distribution of relative expression in testis (Methods). (F) Cumulative distribution of the distances of human lincRNA loci to the closest annotated (Ensembl version 64) protein-coding gene.

References

    1. The 1000 Genomes Project Consortium 2012. An integrated map of genetic variation from 1,092 human genomes. Nature 491: 56–65 - PMC - PubMed
    1. Amaral PP, Dinger ME, Mercer TR, Mattick JS 2008. The eukaryotic genome as an RNA machine. Science 319: 1787–1789 - PubMed
    1. Amaral PP, Clark MB, Gascoigne DK, Dinger ME, Mattick JS 2011. lncRNAdb: A reference database for long noncoding RNAs. Nucleic Acids Res 39: D146–D151 - PMC - PubMed
    1. Barbosa-Morais NL, Irimia M, Pan Q, Xiong HY, Gueroussov S, Lee LJ, Slobodeniuc V, Kutter C, Watt S, Colak R, et al. 2012. The evolutionary landscape of alternative splicing in vertebrate species. Science 338: 1587–1593 - PubMed
    1. Brawand D, Soumillon M, Necsulea A, Julien P, Csárdi G, Harrigan P, Weier M, Liechti A, Aximu-Petri A, Kircher M, et al. 2011. The evolution of gene expression levels in mammalian organs. Nature 478: 343–348 - PubMed

Publication types

Substances