. 2014 Apr;88(7):3636-52.
doi: 10.1128/JVI.02490-13. Epub 2014 Jan 15.

Dynamic imaging of the hepatitis C virus NS5A protein during a productive infection

Affiliations

Dynamic imaging of the hepatitis C virus NS5A protein during a productive infection

Nicholas S Eyre et al. J Virol. 2014 Apr.

Abstract

Hepatitis C virus (HCV) NS5A is essential for viral genome replication within cytoplasmic replication complexes and virus assembly at the lipid droplet (LD) surface, although its definitive functions are poorly understood. We developed approaches to investigate NS5A dynamics during a productive infection. We report here that NS5A motility and efficient HCV RNA replication require the microtubule network and the cytoplasmic motor dynein and demonstrate that both motile and relatively static NS5A-positive foci are enriched with host factors VAP-A and Rab5A. Pulse-chase imaging revealed that newly synthesized NS5A foci are small and distinct from aged foci, while further studies using a unique dual fluorescently tagged infectious HCV chimera showed a relatively stable association of NS5A foci with core-capped LDs. These results reveal new details about the dynamics and maturation of NS5A and the nature of potential sites of convergence of HCV replication and assembly pathways.

Importance: Hepatitis C virus (HCV) is a major cause of serious liver disease worldwide. An improved understanding of the HCV replication cycle will enable development of novel and improved antiviral strategies. Here we have developed complementary fluorescent labeling and imaging approaches to investigate the localization, traffic and interactions of the HCV NS5A protein in living, virus-producing cells. These studies reveal new details as to the traffic, composition and biogenesis of NS5A foci and the nature of their association with putative sites of virus assembly.


Figures

FIG 1
FIG 1
Development and characterization of Jc1 derivatives for live cell imaging. (A) Schematic diagrams of virus constructs (see the supplemental material for details). (B) Infectious virus particle production was determined at 24 to 72 h postelectroporation with the indicated HCV RNA transcripts. The data are means + the SEM for at least three separate electroporations. (C) Immunofluorescent labeling of HCV proteins (patient HCV antisera; red) at 72 h postelectroporation. Nuclei were counterstained with DAPI (blue). The graph inset depicts the percentage of HCV-positive cells (means + the SEM, n = 3). (D) Intracellular HCV RNA levels (normalized to RPLPO mRNA) were quantified by qRT-PCR (data are expressed as % Jc1 HCV RNA levels; means + the SEM [n = 3]). (E) Huh-7.5+FLuc cells were electroporated with the indicated RLuc-encoding subgenomic replicon transcripts before determination of normalized luciferase activity (RLuc/FLuc) at the indicated time points, expressed as % 3 h (input). The data are means ± the SEM (n = 4). Normalized RLuc activity was significantly lower for SGRm-JFH1BlaRL/5A-TCM compared to SGRm-JFH1BlaRL at each time point (P < 0.05).
FIG 2
FIG 2
Specific labeling of TCM-tagged HCV proteins with biarsenical dyes. (A) At 3 days postelectroporation with Jc1/5A-TCM RNA, Huh-7.5 cells were labeled with FlAsH (green; left panel), fixed, and processed for immunofluorescence with anti-NS5A antibody (red; middle panel). Merged images (right panel) show colocalization (yellow) and DAPI-stained nuclei (blue) (Pearson correlation = 0.95). (B) At 3 days postelectroporation with Jc1/Core-TCM:5A-GFP[K1402Q] RNA, Huh-7.5 cells were labeled with ReAsH (red; top left panel), fixed, and processed for immunofluorescent labeling of core (blue; top middle panel). NS5A-GFP epifluorescence was also captured (green; top right panel). Insets and merged images are depicted in the lower panels. Pearson correlations for colocalization of ReAsH-labeling with antibody labeling and NS5A-GFP epifluorescence were 0.84 and 0.65, respectively. (C) Live cell imaging of NS5A-TCM. At 48 h postelectroporation with Jc1/5A-TCM RNA, Huh-7.5 cells were labeled with ReAsH and examined by live cell imaging at 72 h. Images were acquired every 5.3 s for 2 min (see Movie S1 in the supplemental material). The velocities and path lengths of a number of discrete NS5A-positive are depicted in adjacent graphs. (D) Live cell imaging of NS5A-GFP at 4 days postinfection with Jc1/5A-GFP[K1402Q] (multiplicity of infection [MOI] of ∼0.05) (see Movie S2 in the supplemental material). Images were acquired every 2 s for 3 min. The insets depict the traffic of a representative motile NS5A-GFP structure (arrows). Image sharpening (using a Gaussian blur filter with a radius of 1.5 pixels), background subtraction, and contrast stretching were then applied (see the supplemental material). For all micrographs, scale bars represent 10 and 5 μm for main and inset images, respectively.
FIG 3
FIG 3
Involvement of the microtubule network in NS5A-TCM traffic and HCV replication. (A) Huh-7.5 cells were electroporated with Jc1/5A-TCM RNA, labeled with FlAsH (green) at 48 h postelectroporation, transduced with CellLight Tubulin-RFP (red), and analyzed by live cell imaging at 72 h postelectroporation. Images were acquired every 7.5 s for 3 min. Image sharpening (using a Gaussian blur filter with a radius of 1.5 pixels), background subtraction, and contrast stretching were then applied (see Materials and Methods). The traffic of a representative NS5A-TCM-positive structure (arrowhead) in close proximity to RFP-labeled microtubules is depicted in the inset images (see Movie S3 in the supplemental material). Scales bars represent 10 and 5 μm for main and inset images, respectively. (B) Huh-7.5 cells were electroporated, transduced, and labeled, as described above, before exposure to 20 μM nocodazole, 20 μM vinblastine, or carrier alone (0.1% DMSO) for 1 h and live cell imaging. These treatments induced gross disruption of the microtubule network, as judged by diffuse cytoplasmic localization of α-tubulin-RFP (not shown). The graph depicts the mean velocities of arbitrarily selected NS5A-TCM-positive structures over the course of 3 min (n = 20 to 25 structures/group). Compared to the controls the mean velocities of NS5A-TCM-positive structures were significantly different for the nocodazole (***, P < 0.0001) and vinblastine (***, P < 0.0001) treatment groups (unpaired Student t tests). (C) Huh-7.5+FLuc cells were electroporated with SGRm-JFH1BlaRL or SGRm-JFH1BlaRL/GND transcripts and exposed to carrier (0.1% DMSO), 20 μM nocodazole, or 20 μM vinblastine for 1 h at 24 h postelectroporation before being washed and returned to culture. Samples were collected at the indicated time points before determination of the normalized luciferase activity (RLuc:FLuc, to normalize HCV replication levels to cell number/viability), and values are expressed as a percentage of normalized input values at 4 h. The data are means ± the SEM (n = 4).
FIG 4
FIG 4
Involvement of cytoplasmic dynein in HCV RNA replication and NS5A motility. (A) Huh-7.5+FLuc cells were electroporated with SGRm-JFH1BlaRL RNA and cultured for 48 h before exposure to ciliobrevin D (or 1% DMSO) for 24 h and determination of normalized luciferase activity (RLuc/FLuc). The data are expressed as the % control. (B) Huh-7.5+FLuc cells were cotransfected with SGRm-JFH1BlaRL RNA (1 μg) and either nontargeting or DYNC1H1-specific siRNAs (118 pmol) before determination of normalized luciferase activity at the indicated time points. The data are expressed as the % 3 h (input). For panels A and B, data are means + the SEM (n = 4). **, P < 0.01; ***, P < 0.001 (Student t test). (C) Huh-7.5 cells were coelectroporated with Jc1/5A-GFP[K1402Q] RNA (5 μg) and either nontargeting or DYNC1H1-specific siRNAs (1 nmol of each) and cultured for 48 h prior to live cell imaging. Images were acquired every 3 s for 3 min. Images (taken from Movie S4 in the supplemental material) are color-coded projections of entire time-lapse acquisitions. (D) Manual tracking of NS5A-GFP foci in control and DYNC1H1 siRNA-transfected cells. Motile structures (identified as being displaced in the first 6 s of each time-lapse acquisition) were subjected to manual tracking analysis, excluding structures that moved <10 μm in 3 min. Path lengths for control (n = 92 foci) and DYNC1H1 siRNA-transfected (n = 63 foci) cells are depicted in panel D. (E and F) The frequencies of structures that display the indicated path lengths are depicted in panel E, and total path lengths are depicted in panel F. Horizontal bars represent mean values for control and DYNC1H1 siRNA transfected cells (n = 65 and 48 foci, respectively). ***, P < 0.001, Mann-Whitney U-test.
FIG 5
FIG 5
Colocalization and cotraffic of NS5A with VAP-A. (A) Huh-7.5+mCherry-VAP-A cells were electroporated with Jc1/5A-TCM RNA, labeled with FlAsH (green) at 48 h and analyzed by live cell imaging at 72 h (see Movie S5 in the supplemental material). Inset 1 shows enrichment of mCherry-VAP-A in both relatively static and motile NS5A-TCM-positive structures (arrowheads and arrows, respectively), while inset 2 depicts the additional reticular localization of mCherry-VAP-A and the movements of two representative motile NS5A-TCM foci. (B) Huh-7.5+mCherry-VAP-A cells were electroporated with Jc1/5A-GFP[K1402Q] RNA and analyzed by live cell imaging at 72 h postelectroporation (see Movie S6 in the supplemental material). A 16.2-μm line-scan (3 pixels wide) was used to generate the inset kymograph. (C) Huh-7.5+mCherry-VAP-A cells were infected with Jc1/5A-GFP[K1402Q] (MOI of ∼0.05) and analyzed by live cell imaging at 3 days postinfection. Scale bars are 10 and 5 μm for main and inset images, respectively.
FIG 6
FIG 6
Involvement of VAP-A and Rab5A in HCV replication. (A) Stable knockdown of VAP-A in Huh-7.5 cells. After transduction with lentiviral shRNA vectors, antibiotic selection, and enrichment by FACS, the VAP-A protein levels were assessed by Western blotting. The graph inset depicts densitometric analysis of VAP-A proteins levels, normalized to the loading control β-actin (means + the SEM, n = 3). (B) NS5A localization in control shRNA- and VAP-A shRNA-expressing cell lines. Cells were infected with Jc1/5A-FLAG (MOI of ∼0.05), fixed at 72 h postinfection, and processed for indirect immunofluorescence labeling using anti-FLAG antibody. Samples were analyzed by confocal microscopy (using identical settings), collecting serial 0.5-μm z-sections. (C) HCV replication is impaired by VAP-A knockdown. Huh-7.5 cells expressing control- or VAP-A-specific shRNAs were transfected with SGRm-JFH1BlaRL transcripts before determination of RLuc activity at the indicated time points, expressed as a percentage of input values at 3 h. The data are means ± the SEM (n = 4). *, P < 0.05, unpaired Student t test. (D) NS5A-GFP interacts with mCherry-VAP-A as determined by FRET by acceptor photobleaching. Huh-7.5 cells or Huh-7.5 cells stably expressing mCherry-VAP-A were electroporated with Jc1/5A-GFP[K1402Q] transcripts and fixed at 72 h postelectroporation before FRET analysis. NS5A-GFP-positive Huh-7.5 cells serve as “donor only” controls. The difference in fluorescence (DIF) between NS5A-GFP fluorescence pre- and postbleaching of the mCherry channel is depicted. The “Fire” look-up table for ImageJ has been applied to indicate the intensity of DIF signals. The graph inset displays the mean DIF+SEM for individual NS5A-GFP-positive structures from control (n = 30) and NS5A/VAP-A (n = 33) groups (*, P < 0.05 [unpaired Student t test]). (E) Huh-7.5+FLuc cells were transduced with lentiviral vectors enabling tetracycline-inducible expression of mCherry-Rab5A or mutant derivatives (S34N or Q79L). After selection and enriched by FACS, stable cell lines were electroporated with SGRm-JFH1BlaRL transcripts and cultured in the presence of doxycycline at the indicated concentrations before determination of normalized luciferase activity (RLuc/FLuc) at 48 h postelectroporation. The data are expressed as % 3 h (input) (means + the SEM [n = 3]). *, P < 0.05; **, P < 0.01 (Student t test). (F) For each group in panel E, samples were pooled and processed for Western analysis of doxycycline-induced mCherry-Rab5A and mutant derivatives (S34N and Q79L), endogenous Rab5A, and β-actin (loading control).
FIG 7
FIG 7
Colocalization and cotraffic of NS5A with Rab5A. (A) Huh-7.5+mCherry-Rab5A cells were infected with Jc1/5A-GFP (MOI of ∼0.05) and analyzed by live cell imaging at 4 days postinfection. The inset depicts examples of colocalization in both relatively static and motile structures (colocalized pixels are highlighted in white using NIS Elements software and a Pearson correlation threshold of 1%). (B) Huh-7.5 cells were electroporated with Jc1/5A-GFP[K1402Q] RNA, transfected with mCherry-Rab5A, mCherry-Rab5A (S34N) (see also Movie S7 in the supplemental material), or mCherry-Rab5A (Q79L) expression vectors (at 48 h) and analyzed by live cell imaging (at 72 h), collecting images every 6 s for 3 min. The indicated line scans were used to generate the inset kymographs. Manual tracking analysis was performed for NS5A/Rab5A double-positive foci in Jc1/5A-GFP[K1402Q]-infected cells expressing mCherry-Rab5A (n = 35 foci), mCherry-Rab5A (S34N) (n = 49 foci), or mCherry-Rab5A (Q79L) (n = 24 foci) and mean velocities (C) and peak velocities (D) are depicted. (E) Colocalization of NS5A-GFP with mCherry-Rab5A was determined for representative Jc1/5A-GFP[K1402Q]-infected cells that expressed mCherry-Rab5A (n = 6 cells), mCherry-Rab5A (S34N) (n = 7 cells), or mCherry-Rab5A (Q79L) (n = 5 cells). Horizontal bars represent the mean values for each group. *, P < 0.05 (Student t test). For all micrographs, scale bars represent 10 and 5 μm for main and inset images, respectively.
FIG 8
FIG 8
Pulse-chase imaging of SNAP-tagged NS5A. (A) Infectious virus production by Huh-7.5 cells electroporated with Jc1 or Jc1/5A-SNAP transcripts. (B) Specific labeling of NS5A-SNAP with fluorescent SNAP-tag ligands. Huh-7.5 cells were mock electroporated or electroporated with Jc1 or Jc1/5A-SNAP transcripts and labeled with SNAP-Cell TMR-Star (red) at 3 days, immediately prior to fixation and immunofluorescent labeling of NS5A (green). Merged images (with DAPI-stained nuclei; blue) are depicted in the right panels. Scale bars, 25 μm. (C) Western analysis of NS5A protein encoded by wild-type Jc1 and Jc1/5A-SNAP at 72 h postelectroporation. β-Actin served as a loading control. (D) Huh-7.5 cells were electroporated with Jc1/5A-SNAP transcripts and labeled with SNAP-Cell 505 at 48 h, blocked (with SNAP-Cell Block), and returned to culture before labeling with SNAP-Cell TMR-Star at 72 h. Cells were then fixed, counterstained with DAPI, and analyzed by deconvolution fluorescence microscopy. A maximum intensity projection of a representative z-stack is shown. (E) Quantification of the size of “aged” (24- to 72-h-old) and “young” (0- to 24-h-old) NS5A foci. The areas of SNAP-Cell 505-labeled foci (“aged”; n = 5998) and SNAP-Cell TMR-Star-labeled foci (“young”; n = 7682) foci were quantified (from 14 representative cells) from middle z-sections of Jc1/5A-SNAP-infected Huh-7.5 cells. ***, P < 0.0001 (Student t test). (F) Live cell imaging of Huh-7.5 cells that were electroporated with Jc1/5A-SNAP transcripts and labeled with fluorescent SNAP-tag ligands at the indicated time points. The 8.4-μm line scan was used to generate the inset kymograph. Scale bars, 10 μm.
FIG 9
FIG 9
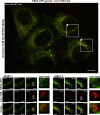
Live cell imaging of HCV core and NS5A proteins in the context of a productive infection. Huh-7.5 cells were electroporated with Jc1/Core-TCM:5A-GFP[K1402Q] transcripts and labeled with ReAsH at 48 h postelectroporation, before live cell imaging of ReAsH-labeled core-TCM (red) and NS5A-GFP epifluorescence (green) at 72 h postelectroporation. Insets 1 and 2 (see Movie S9 in the supplemental material) highlight the relatively stable association of NS5A-GFP-positive foci with core-TCM-coated LDs (arrowheads). Note that brightness and contrast settings have been linearly increased for the “zoom insets” to enhance the visibility of dim structures. For all micrographs, scale bars represent 10 and 5 μm for main and inset images, respectively.
FIG 10
FIG 10
Localization of core-NS5A complexes as determined by in situ PLA. Huh-7.5 cells were electroporated with Jc1 or Jc1/5A-GFP[K1402Q] RNA, fixed at 3 days postelectroporation, and processed for detection of core-NS5A complexes (red; right panels) by in situ PLA in Jc1- and Jc1/5A-GFP[K1402Q]-infected cells (top and bottom panels, respectively). Labeling of core with both rabbit and mouse anti-core antibodies served as a positive control for in situ PLA (left panels). Nuclei were counterstained with DAPI (blue). For Jc1/5A-GFP[K1402Q]-infected cells NS5A-GFP epifluorescence (green) was also captured. Serial (0.25-μm) z-sections were acquired and deconvoluted using the 3D AutoQuant Blind Deconvolution plug-in of NIS Elements AR v3.22. Images are single representative z-sections. The graph inset depicts an enumeration of core-NS5A PLA signals per cell (in central z-sections) in uninfected (n = 73), Jc1-infected (n = 20), and Jc1/5A-GFP[K1402Q]-infected (n = 13) cells. The frequency of PLA signals were significantly higher for Jc1- and Jc1/5A-GFP[K1402Q]-infected cells compared to uninfected controls (P < 0.0001, Student t test). Minimal colocalization was observed between core-NS5A PLA signals and NS5A-GFP in Jc1/5A-GFP[K1402Q]-infected cells (Pearson correlation = 0.26 ± 0.02 [n = 13 cells]). For all micrographs, scale bars represent 10 and 5 μm for main and inset images, respectively.

References

    1. Moradpour D, Penin F, Rice CM. 2007. Replication of hepatitis C virus. Nat. Rev. Microbiol. 5:453–463. 10.1038/nrmicro1645 - DOI - PubMed
    1. Lohmann V, Korner F, Koch J, Herian U, Theilmann L, Bartenschlager R. 1999. Replication of subgenomic hepatitis C virus RNAs in a hepatoma cell line. Science 285:110–113. 10.1126/science.285.5424.110 - DOI - PubMed
    1. Bartenschlager R, Penin F, Lohmann V, Andre P. 2011. Assembly of infectious hepatitis C virus particles. Trends Microbiol. 19:95–103. 10.1016/j.tim.2010.11.005 - DOI - PubMed
    1. den Boon JA, Diaz A, Ahlquist P. 2010. Cytoplasmic viral replication complexes. Cell Host Microbe 8:77–85. 10.1016/j.chom.2010.06.010 - DOI - PMC - PubMed
    1. Egger D, Wolk B, Gosert R, Bianchi L, Blum HE, Moradpour D, Bienz K. 2002. Expression of hepatitis C virus proteins induces distinct membrane alterations including a candidate viral replication complex. J. Virol. 76:5974–5984. 10.1128/JVI.76.12.5974-5984.2002 - DOI - PMC - PubMed

Publication types