

Uremic solutes and risk of end-stage renal disease in type 2 diabetes: metabolomic study
- PMID: 24429397
- PMCID: PMC4072128
- DOI: 10.1038/ki.2013.497
Uremic solutes and risk of end-stage renal disease in type 2 diabetes: metabolomic study
Abstract
Here we studied plasma metabolomic profiles as determinants of progression to end-stage renal disease (ESRD) in patients with type 2 diabetes (T2D). This nested case-control study evaluated 40 cases who progressed to ESRD during 8-12 years of follow-up and 40 controls who remained alive without ESRD from the Joslin Kidney Study cohort. Controls were matched with cases for baseline clinical characteristics, although controls had slightly higher eGFR and lower levels of urinary albumin excretion than cases. Plasma metabolites at baseline were measured by mass spectrometry-based global metabolomic profiling. Of the named metabolites in the library, 262 were detected in at least 80% of the study patients. The metabolomic platform recognized 78 metabolites previously reported to be elevated in ESRD (uremic solutes). Sixteen were already elevated in the baseline plasma of our cases years before ESRD developed. Other uremic solutes were either not different or not commonly detectable. Essential amino acids and their derivatives were significantly depleted in the cases, whereas certain amino acid-derived acylcarnitines were increased. All findings remained statistically significant after adjustment for differences between study groups in albumin excretion rate, eGFR, or HbA1c. Uremic solute differences were confirmed by quantitative measurements. Thus, abnormal plasma concentrations of putative uremic solutes and essential amino acids either contribute to progression to ESRD or are a manifestation of an early stage(s) of the disease process that leads to ESRD in T2D.
Figures

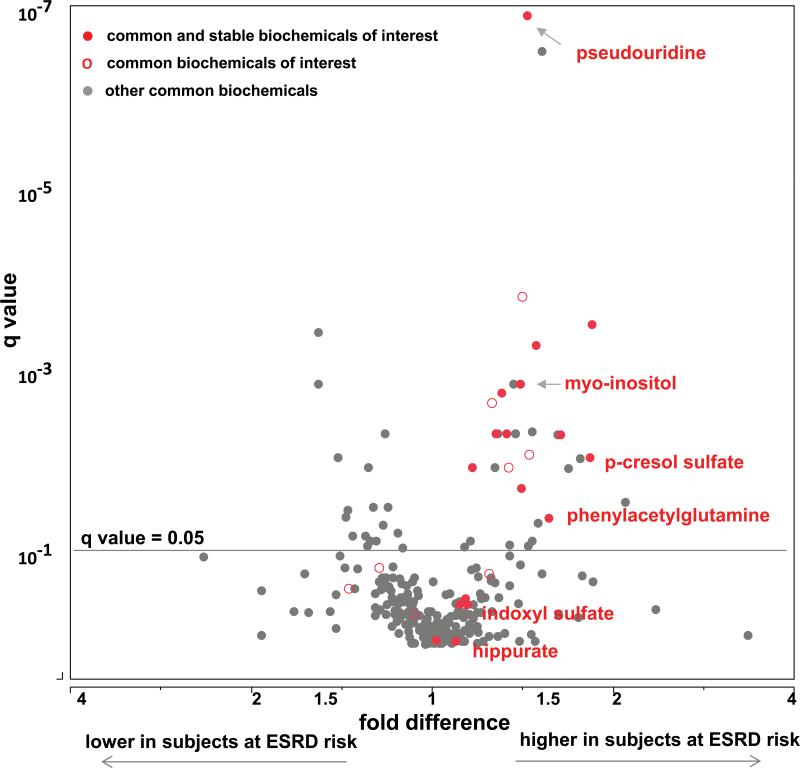
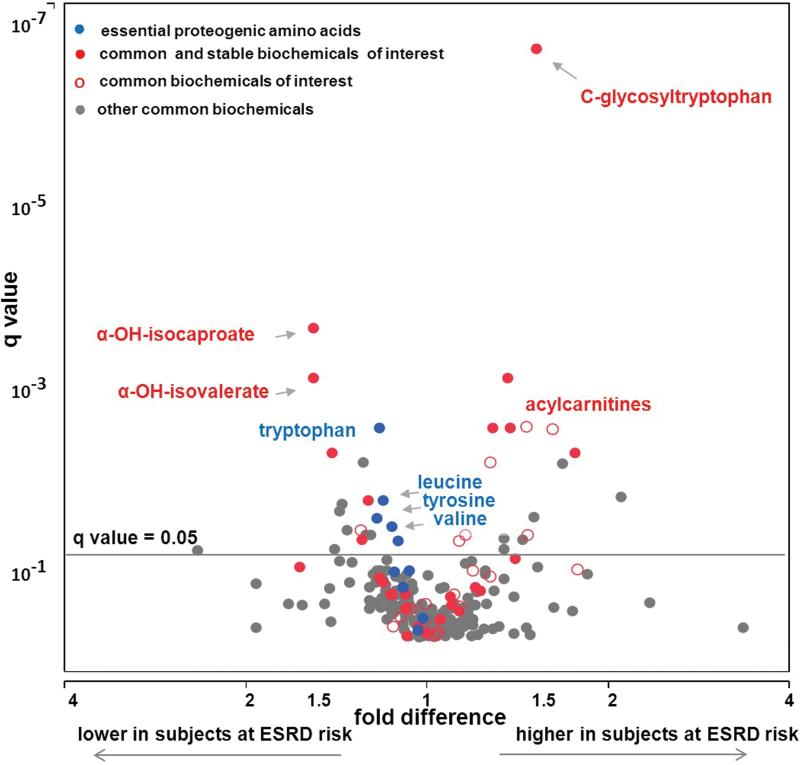
 ), common, but not stable over time as red empty circles (
 ), all other common as grey circles (
 ). Blue circles represent essential amino acids (
 ).
). ), common, but not stable over time as red empty circles (), all other common as grey circles (). Blue circles represent essential amino acids ().

Comment in
-
The metabolomics grail: promising although not yet holy.Kidney Int. 2015 Apr;87(4):864. doi: 10.1038/ki.2014.396. Kidney Int. 2015. PMID: 25826556 No abstract available.
References
-
- U.S.Renal Data System . USRDS 2010 Annual Data Report: Atlas of Chronic Kidney Disease and End-Stage Renal Disease in the United States. National Institutes of Health, National Institute of Diabetes and Digestive and Kidney Diseases; Bethesda, MD: 2010. 2010.
-
- Evans AM, Dehaven CD, Barrett T, Mitchell M, Milgram E. Integrated, nontargeted ultrahigh performance liquid chromatography/electrospray ionization tandem mass spectrometry platform for the identification and relative quantification of the small- molecule complement of biological systems. Anal Chem. 2009;81:6656–67. - PubMed
Publication types
MeSH terms
Substances
Grants and funding
- DK80123/DK/NIDDK NIH HHS/United States
- DP3 DK094292/DK/NIDDK NIH HHS/United States
- DK67638/DK/NIDDK NIH HHS/United States
- R01 DK080123/DK/NIDDK NIH HHS/United States
- R01 DK067638/DK/NIDDK NIH HHS/United States
- DK097153/DK/NIDDK NIH HHS/United States
- R21 DK084439/DK/NIDDK NIH HHS/United States
- R01 DK039773/DK/NIDDK NIH HHS/United States
- DK89503/DK/NIDDK NIH HHS/United States
- DK 72381/DK/NIDDK NIH HHS/United States
- DK84439/DK/NIDDK NIH HHS/United States
- DK94292/DK/NIDDK NIH HHS/United States
- R37 DK039773/DK/NIDDK NIH HHS/United States
- T32 DK007357/DK/NIDDK NIH HHS/United States
- P30 DK089503/DK/NIDDK NIH HHS/United States
- DK41526/DK/NIDDK NIH HHS/United States
- P30 DK036836/DK/NIDDK NIH HHS/United States
- R01 DK072381/DK/NIDDK NIH HHS/United States
- DK39773/DK/NIDDK NIH HHS/United States
- P30 DK020572/DK/NIDDK NIH HHS/United States
- P30DK036836/DK/NIDDK NIH HHS/United States
- P30 DK081943/DK/NIDDK NIH HHS/United States
- R01 DK041526/DK/NIDDK NIH HHS/United States
- U24 DK097153/DK/NIDDK NIH HHS/United States
LinkOut - more resources
Full Text Sources
Other Literature Sources
Medical
Research Materials
Miscellaneous
