. 2014 Feb 13;506(7487):240-4.
doi: 10.1038/nature12883. Epub 2014 Jan 15.

Leukaemogenesis induced by an activating β-catenin mutation in osteoblasts

Affiliations

Leukaemogenesis induced by an activating β-catenin mutation in osteoblasts

Aruna Kode et al. Nature. .

Abstract

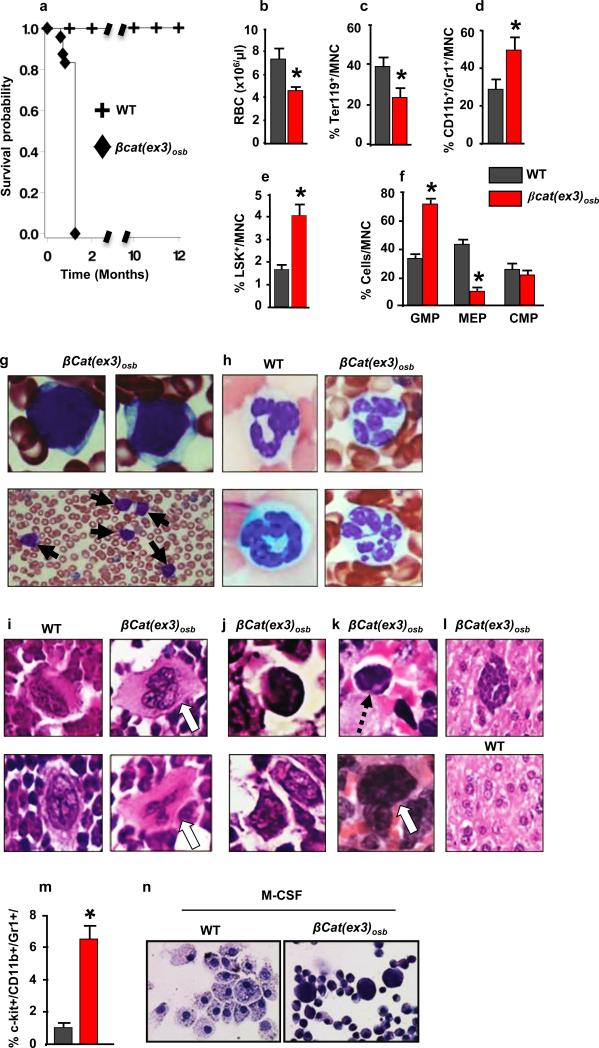
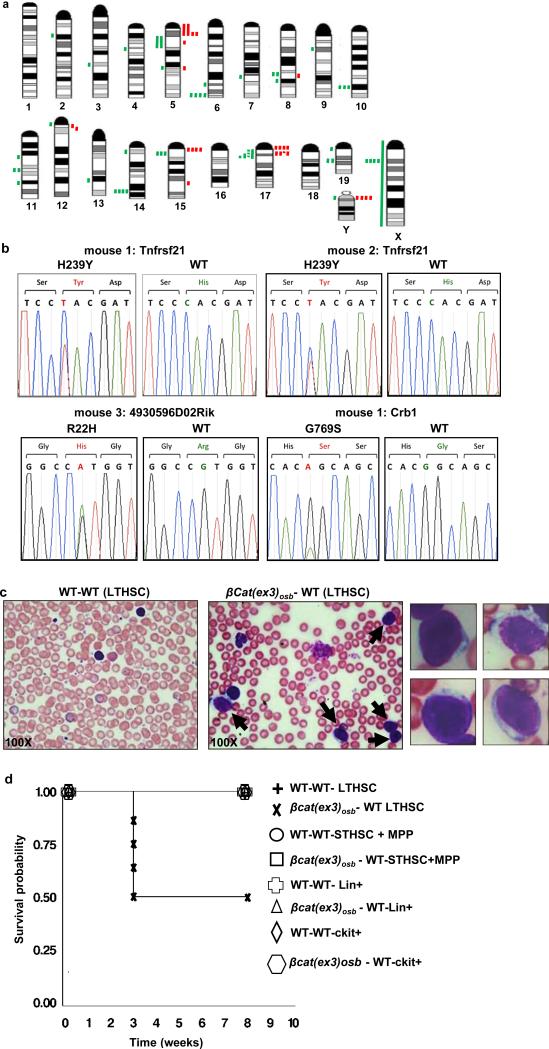
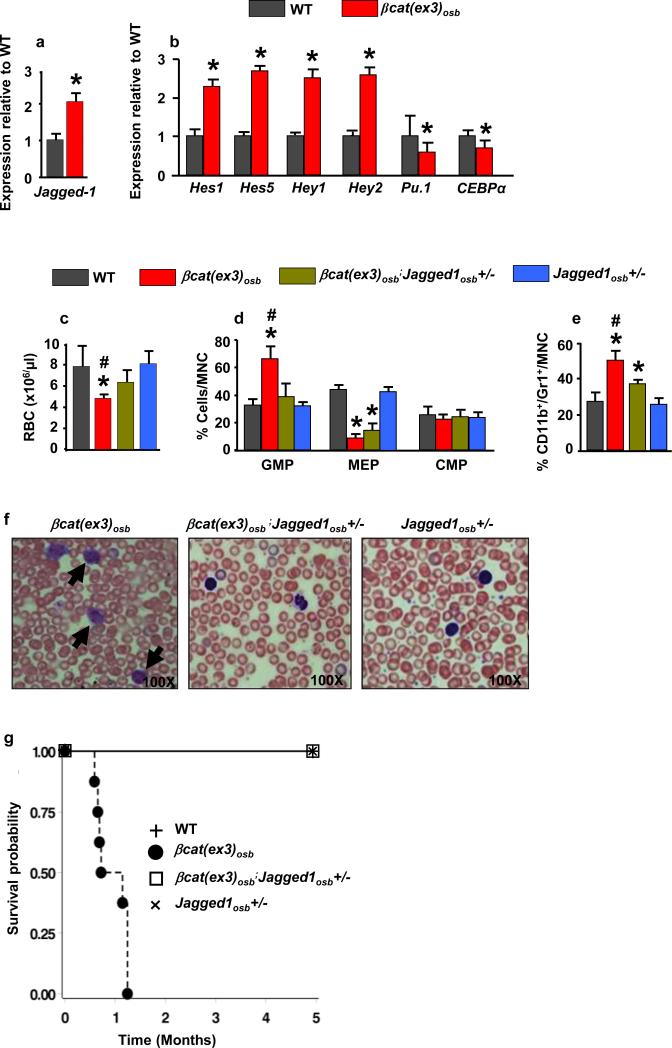
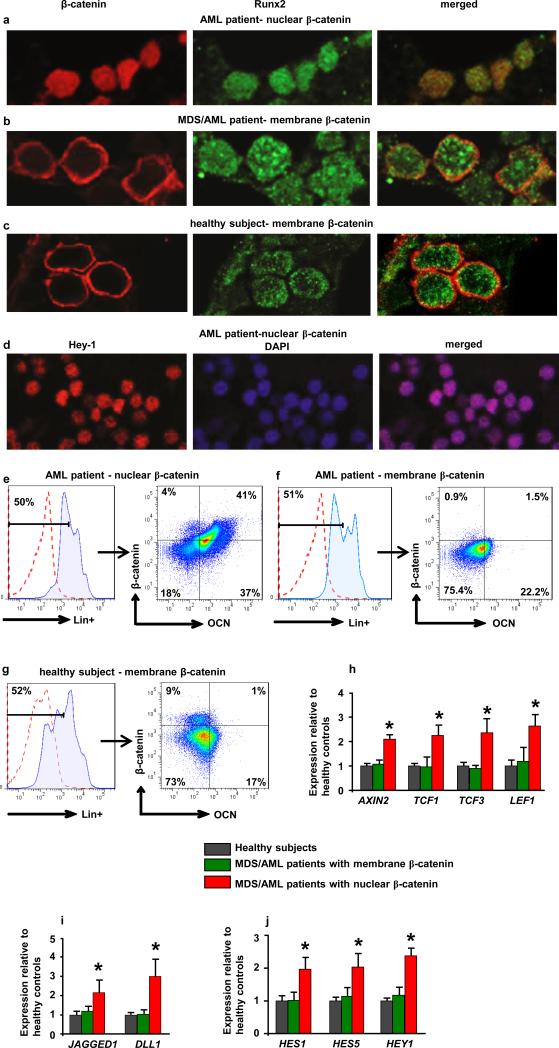
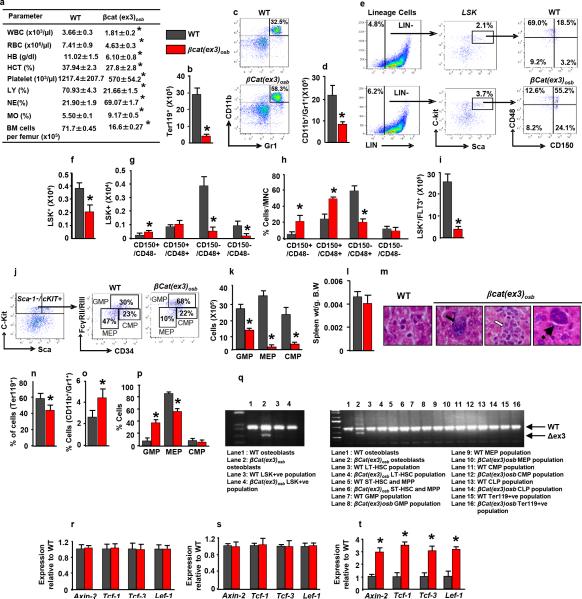
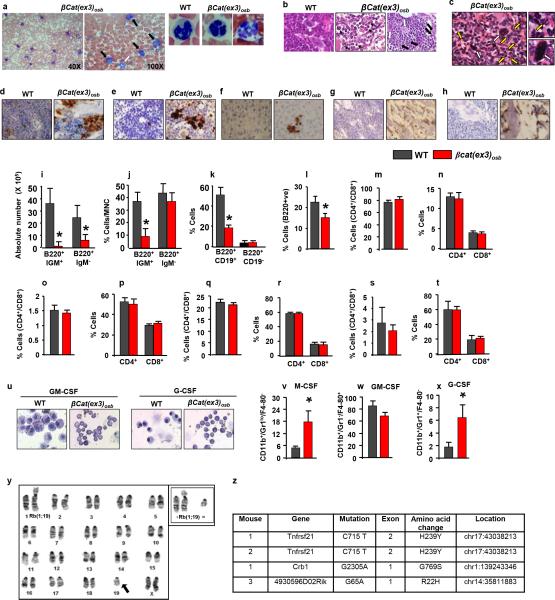
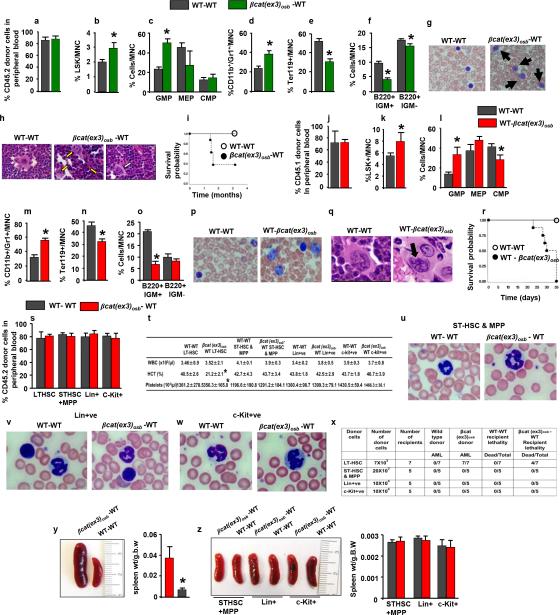
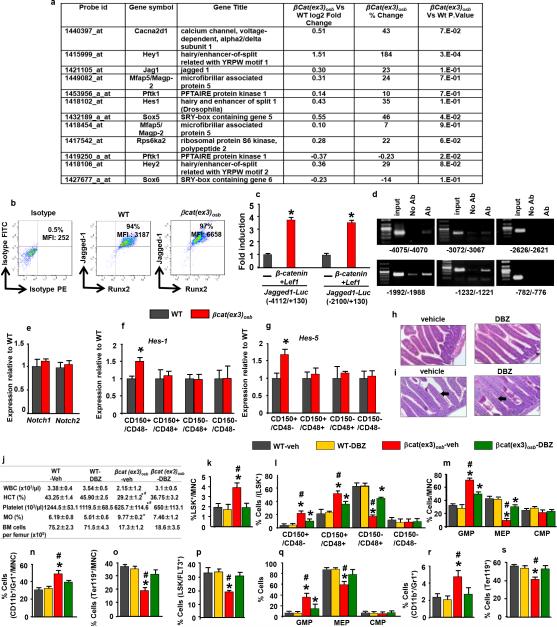
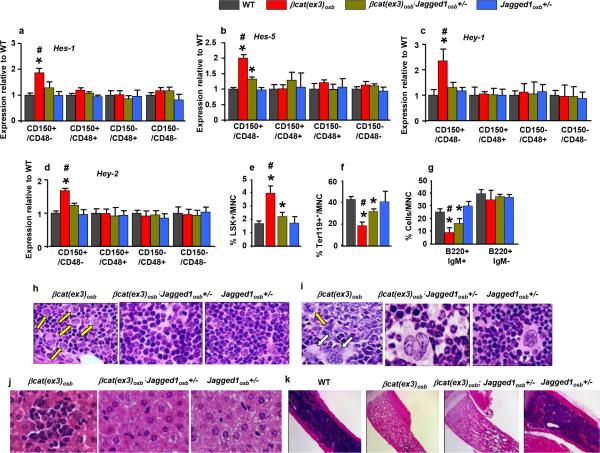
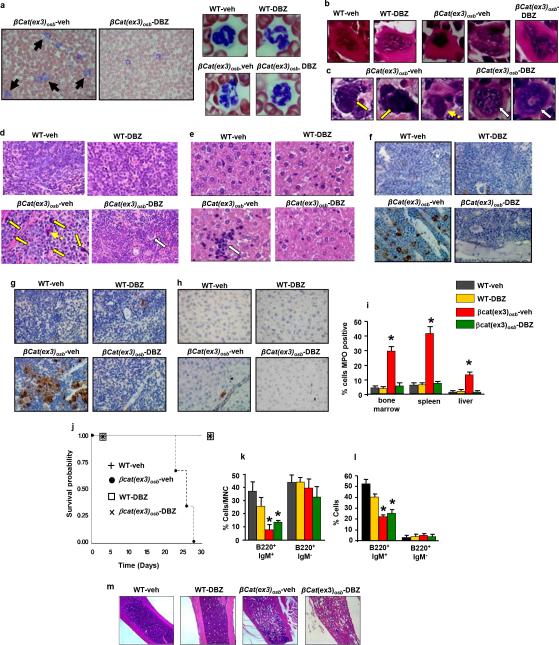
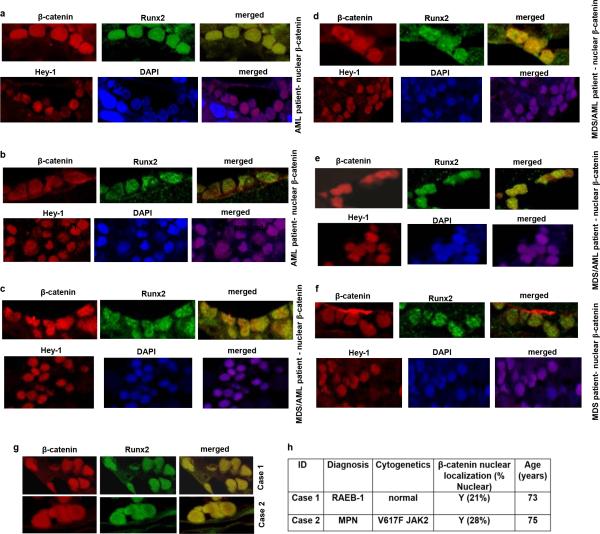
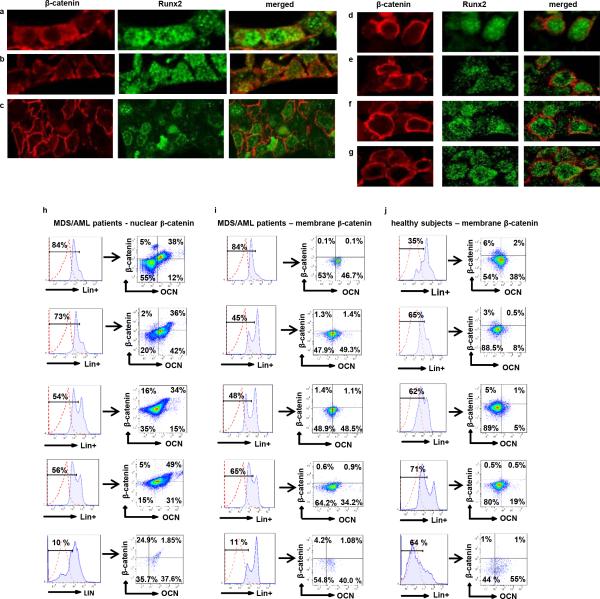
Cells of the osteoblast lineage affect the homing and the number of long-term repopulating haematopoietic stem cells, haematopoietic stem cell mobilization and lineage determination and B cell lymphopoiesis. Osteoblasts were recently implicated in pre-leukaemic conditions in mice. However, a single genetic change in osteoblasts that can induce leukaemogenesis has not been shown. Here we show that an activating mutation of β-catenin in mouse osteoblasts alters the differentiation potential of myeloid and lymphoid progenitors leading to development of acute myeloid leukaemia with common chromosomal aberrations and cell autonomous progression. Activated β-catenin stimulates expression of the Notch ligand jagged 1 in osteoblasts. Subsequent activation of Notch signalling in haematopoietic stem cell progenitors induces the malignant changes. Genetic or pharmacological inhibition of Notch signalling ameliorates acute myeloid leukaemia and demonstrates the pathogenic role of the Notch pathway. In 38% of patients with myelodysplastic syndromes or acute myeloid leukaemia, increased β-catenin signalling and nuclear accumulation was identified in osteoblasts and these patients showed increased Notch signalling in haematopoietic cells. These findings demonstrate that genetic alterations in osteoblasts can induce acute myeloid leukaemia, identify molecular signals leading to this transformation and suggest a potential novel pharmacotherapeutic approach to acute myeloid leukaemia.


Figures

Figure 1
Figure 1. Anemia and myeloid lineage expansion in βcat(ex3)osb mice
a, Lethality b, anemia c, decreased erythroid progenitors and increased percentage of d, monocytic/granulocytic, e, LSK, f, myeloid progenitor populations in the marrow and g, immature monocytic blasts and h, hypersegmented neutrophils in the blood (13-81% neutrophils and 12%-90% blasts). i, Bone marrow sections showing micro-megakaryocytes with hyperchromatic nuclei and j, blasts. k, In the spleen, cells with large nucleoli (dotted arrow) and dysplastic megakaryocytes (white arrow). l, Cluster of immature cells with atypical nuclear appearance in the liver. m, Increased percentage of undifferentiated imature myeloid cells in the bone marrow of βCat(ex3)osb mice. n, Lack of myeloid cell differentiation in βCat(ex3)osb bone marrow cells. N=8 mice per WT and 12 mice per βcat(ex3)osb groups. Results show a representative of five independent experiments, *p < 0.05 versus WT. Results are mean ± SD. MNC: mononuclear cells.
Figure 2
Figure 2. AML in βcat(ex3)osb mice
a, Mouse chromosomal ideogram showing areas of genetic gain (red bars) and loss (green bars) identified by aCGH in βCat(ex3)osb mice. b, Sequence traces of somatic mutations in myeloid malignancies (CD11b+/Gr1+) from 3 βcat(ex3)osb mice. c, Blasts (12%-75%, solid arrows) in blood of sublethally irradiated CD45.1 WT mice transplanted with LT-HSCs from CD45.2 βcat(ex3)osb mice 4 weeks following transplantation. d, Lethality in WT mice transplanted with indicated hematopoietic populations from βcat(ex3)osb. N=7. Results show a representative of two independent experiments.
Figure 3
Figure 3. Inactivation of Jagged-1 in osteoblasts prevents AML in βcat(ex3)osb mice
Expression of a, Jagged-1 in bone, and b, Notch targets in LSK+ cells (n=4). Rescue of c, anemia, and proportions of d, myeloid and e, CD11b+/Gr1+ cells in the bone marrow of βCat(ex3)osb/Jagged1osb+/− mice. Normal f, blood histology and g, Survival of βcat(ex3)osb;Jagged1osb+/− mice. * p < 0.05 versus WT and # p < 0.05 βCat(ex3)osb versus βcat(ex3)osb;Jagged1osb+/− mice. N=8. Results show a representative of two independent experiments. Results are mean ± SD.
Figure 4
Figure 4. Nuclear accumulation of β-catenin in osteoblasts and increased Notch signaling in human MDS/AML
a-c, Double immunofluorecsence staining for β-catenin and Runx2 in bone marrow biopsies from a-b, MDS/AML patients and c, healthy subjects (60X). d, Nuclear accumulation of Hey-1 in patient shown in (a). e-g, Flow cytometry detecting nuclear/activated β-catenin. Plots show e, nuclear versus f, non-nuclear localization of β -catenin in osteoblasts from MDS/AML patients or g, healthy subjects as CD34-/Lin-OCN+ cells, (OCN: osteocalcin). In a-g, one representative from 107 patients and one representative from 56 healthy subjects. Increased expression of h, β-catenin targets and i, JAGGED-1 and DLL-1 in CD34−/Lin−OCN+ osteoblasts and j, Notch targets in CD34+/Lin+OCN− hematopoietic cells from MDS/AML patients or healthy subjects. p<0.05 versus patients with non-nuclear β-catenin in osteoblasts and healthy subjects. Results are mean ± SD. Results show a representative of two independent experiments with N= 3 for healthy subjects, 12 for MDS/AML patients with membrane localization of β-catenin and 11 for MDS/AML patients with nuclear β-catenin.
Extended Data Figure 1
Extended Data Figure 1. Anemia, peripheral blood leukocytosis and monocytosis and deregulated hematopoiesis specific activation of β-catenin in osteoblasts of β-Cat(ex3)osb mice
a, Hematopoietic parameters. White blood cells (WBC), Red blood cells (RBC), Hemoglobin (HB), Hematocrit (HCT), platelets, lymphocytes (LY), Neutrophiles (NE), Monocytes (MO) in 2 weeks old mice. b-k, In the bone marrow b, Erythroid cell numbers. c, Representative flow cytometry image showing monocytic/granulocytic (CD11b+/Gr1+) subset. d, Numbers of the CD11b+/Gr1+ subset. e, Distribution of LSK (Lineage-Sca+C-kit+) population. f, LSK numbers g, Frequency and h, Percentage of LT-HSCs and ST-HSCs. i, Numbers of LSK+/FLT3+ cells. j, Myeloid progenitor profile by CD34-versus-FcgRII/III analysis of electronically gated Lin–Sca-1–c-Kit+ bone marrow cells. k, Numbers of myeloid progenitor populations. l, Spleen weight. m, Extramedullar hematopoiesis in the liver of 3 weeks old βcat(ex3)osb mice indicated by megakaryocytes (solid arrows), myeloid (open arrows) and rare erythroid precursors (dotted arrows). Percentage of n, Ter119+, o, CD11b+/Gr1+ and p, myeloid progenitor populations in the spleen. q, PCR analysis of genomic DNA from osteoblasts and indicated hematopoieic populations from WT and βCat(ex3)osb mice. r-t, Real-Time PCR analysis of b-catenin targets in r, bone marrow CD45+CD34+CD31+ cells, s, spleen and t, bones. In a N=6, b-k, n-p N=8, l, m N=5, and r-t N=4 mice per group. Results are mean ± SD and show a representative from five (a-p) or 2 (q-t) independent experiments. *p < 0.05 versus WT. MNC: mononuclear cells.
Extended Data Figure 2
Extended Data Figure 2. Multi-organ infiltration with blasts and dysplastic cells and myeloid differentiation block in βCat(ex3)osb mice
a, Blast infiltration (solid arrows) and neutrophil hypersegmentation (open arrow and magnified panels) in the blood of βCat(ex3)osb mice. Images at 40x or 100x. b, Blast infiltration (solid arrows) and micro-megakaryocytes with hyperchromatic nuclei (white arrows) in the bone marrow of βCat(ex3)osb mice. Images at 60X. c, Blast infiltration (solid arrows and magnified panel) and presence of dysplastic megakaryocytes (yellow arrows and magnified panel) in the spleen of βCat(ex3)osb mice. Image at 400X. d-f, Myeloperoxidase (MPO) staining of d, long bone e, spleen and f, liver showing massive invasion of myeloid cells. g, CD117 (C-kit) staining of bone sections showing CD117+ blasts in βCat(ex3)osb mice. h, CD13 staining of bone sections showing myeloid/monocytic infiltration in βCat(ex3)osb mice. In d-h images at 60X magnification. i-j, B-cell progenitors numbers in the i-j, bone marrow, k, spleen and l, lymph nodes.. m-t, Proportion of T-cells. u, Lack of myeloid cell differentiation in βCat(ex3)osb bone marrow cells following treatment with cytokines. v-x, Percentage of immature myeloid cells in ex vivo bone marrow cultures treated with cytokines. y. Robertsonian translocation between chromosomes 1 and 19 in 2 of 30 metaphases of the spleen of an 18-day old βcat(ex3)osb mouse. Inset shows the same abnormality in another cell. z, Whole-exome sequencing of myeloid malignancies (CD11b+/Gr1+) from 3 cat(ex3)osb mice and 3 germline normal (tail) samples. In (i-x) N=6, mice per group. *p < 0.05 versus WT. Results are mean ± SD and show a representative of five (i-t) or three (u-x) independent experiments.
Extended Data Figure 3
Extended Data Figure 3. Cell autonomous AML development by bone marrow and LT-HSCs cells of βCat(ex3)osb mice
a, Engraftment efficiency of CD45.2 βCat(ex3)osb bone marrow cells in lethally irradiated CD45.1 WT mice 7 weeks following transplantation. b-f, Percentage of indicated populations in bone marrow of transplanted mice. g, Blasts in blood (15-80%, solid arrows) of lethally irradiated CD45.1 WT mice transplanted with CD45.2 βCat(ex3)osb marrow cells 7 weeks following transplantation. h, Blasts (solid arrows) and dysplastic megakaryocytes (open arrow) in bone marrow of transplanted mice Images at 60x. i, Lethality curves. j, Engraftment efficiency of CD45.1 WT bone marrow cells in lethally irradiated CD45.2 βCat(ex3)osb mice. k-o, Increased percentage of k, LSK cells, l, myeloid progenitors, and m, CD11b+/Gr1+ cells and decreases in n, erythroid cells and o, B-lymphopoiesis in the bone marrow of transplanted mice. p, Blasts in the blood and q, bone marrow (solid arrows) of transplanted mice. Images were taken at o, 100x and p, 60x. r, Lethality curves. s, Engraftment efficiency of indicated bone marrow hematopoietic populations from 4-week old CD45.2 βCat(ex3)osb or wild type mice in sublethally irradiated CD45.1 WT mice after 4 weeks (for LT-HSCs, due to lethality) and 8 weeks (for other populations) of transplantation. t, Blood counts in wild type mice transplanted mice. u-w, Lack of blasts in the blood of wild type mice transplanted with indicated hematopoietic cells from βCat(ex3)osb mice. x, Disease development in wild type mice transplanted with indicated hematopoietic cells from βCat(ex3)osb mice. y, Splenomegaly in WT mice transplanted with LT-HSCs from βcat(ex3)osb. z, Spleen size and weight in WT mice transplanted with indicated hematopoietic populations from WT/βcat(ex3)osb mice. N=6 mice per group. Results are mean ± SD and show a representative of two independent experiments. *p < 0.05 versus WT- WT transplanted group.
Extended Data Figure 4
Extended Data Figure 4. Newborn βCat(ex3)osb mice show MDS but fetal HSCs from βCat(ex3)osb mice do not transfer AML
a-e, Increased percentage of (a) LSK cells, (b) GMPs, and (c) CD11b+/Gr1+ cells and decreases in (d) erythroid cells and (e) B-lymphopoiesis in the liver of newborn (P1) βCat(ex3)osb mice. f-j, Increased percentage of (f) LSK cells, (g) GMPs, and (h) CD11b+/Gr1+ cells and decreases in (i) erythroid cells and (j) B-lymphopoiesis in the bone marrow of newborn (P1) βCat(ex3)osb mice. k, Liver, l, bone marrow and m, spleen of of newborn (P1) βCat(ex3)osb mice showing microhypolobated megakaryocytes (open arrows), Pelger Huet neutrophils (yellow arrows) or blasts (solid arrows) Images at 100x. n, Percentage of imature myeloid cells in the bone marrow of newborn mice. o-t, Flow cytometry and Giemsa-stained cytospins showing lack of changes in the percentage of immature myeloid cells in ex vivo cultures of bone marrow cells from P1 stage βCat(ex3)osb mice and treated with indicated cytokines. u, Engraftment efficiency of CD45.2 βCat(ex3)osb LSK cells obtained from the liver of embryonic day 18.5 embryos in sublethally irradiated CD45.1 WT mice. v, Normal peripheral blood measurements in transplanted mice. w, Lack of blasts in the blood of transplanted WT mice. Images at 100x. N=6 mice per group. Results are mean ± SD and represent at least two independent experiments. *p < 0.05 versus WT.
Extended Data Figure 5
Extended Data Figure 5. Inhibition of increased Notch signaling normalizes blood counts and rescues hematopoietic defects in βCat(ex3)osb mice
a, Microarray analysis of calvaria-derived osteoblasts from βCat(ex3)osb mice. AML and Notch-related genes in βCat(ex3)osb osteoblasts and with p<0.05 and fold change of ± 20% in one comparison. Genes which that are up- or down-regulated relative to WT are shown. b, Flow cytometry analysis of Jagged-1 expression in osteoblasts (MFI: mean fluorescent intensity). c, Luciferase activity in HEK293T cells co-transfected with β-Catenin, Lef1 and Jagged1-Luc reporter constructs (−4112/+130) and (−2100/+130). Results show fold induction over respective Jagged1-Luc reporter constructs. * p< 0.05 versus respective Jagged1-Luc. Results are mean ± SD. d, ChIP in primary osteoblasts using anti-β-catenin antibody. Primers spanned the putative TCF/LEF binding sites (indicated) on the Jagged-1 promoter. e, Expression of Notch1 and Notch2 in LSK+ cells. f-g, Expression of Notch targets in LSK+ subpopulations. i, Normal intestinal architecture and j, PAS staining showing lack of goblet cell (arrows) metaplasia in DBZ-treated mice. Images at 60x. k, Peripheral blood counts and bone marrow cellularity in wild type and βCat(ex3)osb mice treated daily with vehicle or DBZ (2μmol/kg body weight) for 10 days. l-p, Percentage of k, LSK cells, l, LSK+ subpopulations m, myeloid progenitors, n, CD11b+/Gr1+ population, o, erythroid cells. m, Percentage of erythroid cells and p, LSK+/FLT3+ population in the bone marrow. q-s, Percentage of q, myeloid progenitor populations, r, CD11b+/Gr1+ cells and s, erythroid cells in the spleen. In a N=3 mice per group and in b N=4 mice per group. In c,d results represent two independent experiments. In (e-g) N=4 mice per group, and *p < 0.05 versus WT. In (h-s) N=8 mice per group and *p < 0.05 versus WT and # p < 0.05 βCat(ex3)osb-vehicle versus DBZ-treated βCat(ex3)osb group. Results are mean ± SD and show a representative of two independent experiments.
Extended Data Figure 6
Extended Data Figure 6. Jagged-1 inactivation in osteoblasts prevents AML of βCat(ex3)osb mice
a-d, Expression of Notch transcriptional targets in bone marrow LSK subpopulations. Rescue of changes in the proportions of e, LSK and f, erythroid cells in the bone marrow of βCat(ex3)osb/Jagged1osb+/− mice. g, Improvement of B-lymphopoiesis in βcat(ex3)osb;Jagged1osb+/− mice. Normal h, bone marrow, i, spleen and j, liver histology in βcat(ex3)osb;Jagged1osb+/− mice. k, Long bone sections. Images at 4X. In (a-d) N=4 and in (e-k) N-8 mice per group. *p < 0.05 versus WT and # p < 0.05 versus βcat(ex3)osb;Jagged1osb+/− mice. Results are mean ± SD and show a representative of three (a-d) and two (e-k) independent experiments.
Extended Data Figure 7
Extended Data Figure 7. Inhibition of Notch signaling reverses AML in βCat(ex3)osb mice
a, Lack of blasts (solid arrows) and, normal neutrophils (right panel) in blood of DBZ-treated βCat(ex3)osb mice. b-c, Normal megakaryocytes in b, the bone marrow and c, spleen and d, Normal spleen histology in DBZ-treated βCat(ex3)osb mice. Yellow arrows indicate abnormal cells with large nucleoli and dotted arrow indicates abnormal megakaryocytes in βCat(ex3)osb mice; white arrow indicates normal megakaryocytes in DBZ-treated βCat(ex3)osb mice. e, Lack of monocyte infiltration in the liver of DBZ-treated βCat(ex3)osb mice. Arrow indicates cluster of mononuclear cells. f-h, MPO staining of f, bone marrow g, spleen and h, liver. i, Percent of cells staining with MPO in the indicated tissues j, Increased survival in DBZ-treated βCat(ex3)osb mice. In a-b images taken at 100x magnification. In c-g images taken at 60X magnification. k-l, Proportion of B-cell populations in the k, bone marrow and l, spleen. m, Long bone sections. Images at 4X. N=6 mice per group. *p < 0.05 versus WT and # p < 0.05 βCat(ex3)osb-vehicle versus DBZ-treated βCat(ex3)osb group. Results are mean ± SD and show a representative from two independent experiments.
Extended Data Figure 8
Extended Data Figure 8. Nuclear accumulation of β-catenin in osteoblasts and increased Notch signaling in 38.3 % of patients with MDS/AML; and identification of underlying pre-AML conditions by nuclear localization of β-catenin in osteoblasts
a-f, Double immunofluorecsence staining with β-catenin and Runx2 in osteoblasts from bone marrow biopsies from 6 MDS/AML patients harboring nuclear accumulation of β-catenin in osteoblasts and showing nuclear accumulation of Hey1 in the corresponding patients (60X). g-h, During screening assumed healthy controls, 2 individuals were identified with nuclear β-catenin in their osteoblasts. Re-evaluation showed underlying hematologic disorder, Case 1: MDS RAEB-1, Case 2: Jak2 positive myelofibrosis. g, Double immunofluorecsence staining with β-catenin and Runx2 in osteoblasts from bone marrow biopsies of the 2 cases (60X). h, β-catenin cellular localization in cases 1 and 2 with associated cytogenetic abnormalities. NL: normal cytogenetics. In the 4th column percentages indicate osteoblasts with nuclear localization of β-catenin.
Extended Data Figure 9
Extended Data Figure 9. Membrane accumulation of β-catenin in osteoblasts in 61.7 % of patients with MDS/AML and in healthy subjects and Nuclear accumulation of β-catenin in osteoblasts in 38.3 % of patients with MDS/AML identified by flow cytometry
Double immunofluorecsence staining with β-catenin and Runx2 in osteoblasts from bone marrow biopsies from a-c, 3 MDS/AML patients and d-g, 4 healthy subjects harboring membrane localization of β-catenin in osteoblasts. h-j, Flow cytometry using a non-phospho β-catenin antibody detecting nuclear/activated β-catenin. Representative plots showing h, nuclear versus i, non-nuclear localization of β -catenin in osteoblasts from individual MDS/AML patients and, non-nuclear localization of β-catenin in osteoblasts from 5 healthy subjects as CD34−/Lin−OCN+ cells, (OCN, osteocalcin an osteoblast-specific protein used for isolation of live osteoblastic cells).

Comment in

References

    1. Heissig B, et al. Recruitment of stem and progenitor cells from the bone marrow niche requires MMP-9 mediated release of kit-ligand. Cell. 2002;109:625–637. - PMC - PubMed
    1. Shiozawa Y, et al. Human prostate cancer metastases target the hematopoietic stem cell niche to establish footholds in mouse bone marrow. J Clin. Invest. 2011;121:1298–1312. - PMC - PubMed
    1. Calvi LM, et al. Osteoblastic cells regulate the haematopoietic stem cell niche. Nature. 2003;425:841–846. - PubMed
    1. Zhang J, et al. Identification of the haematopoietic stem cell niche and control of the niche size. Nature. 2003;425:836–841. - PubMed
    1. Mayack SR, Wagers AJ. Osteolineage niche cells initiate hematopoietic stem cell mobilization. Blood. 2008;112:519–531. - PMC - PubMed

Publication types

MeSH terms

Associated data