

Turning point for US diets? Recessionary effects or behavioral shifts in foods purchased and consumed
- PMID: 24429538
- PMCID: PMC3927694
- DOI: 10.3945/ajcn.113.072892
Turning point for US diets? Recessionary effects or behavioral shifts in foods purchased and consumed
Abstract
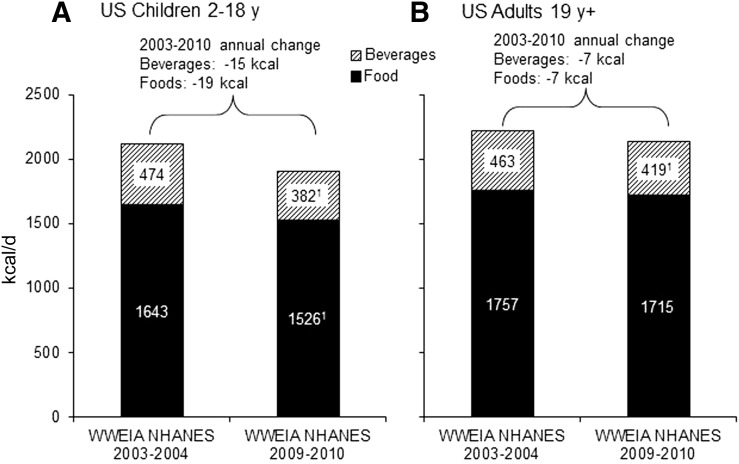
Background: In the past decade, the United States has seen declining energy intakes and plateauing obesity levels.
Objective: We examined whether these observed trends suggest a longer-term shift in dietary and health behavior that is independent of adverse economic conditions.
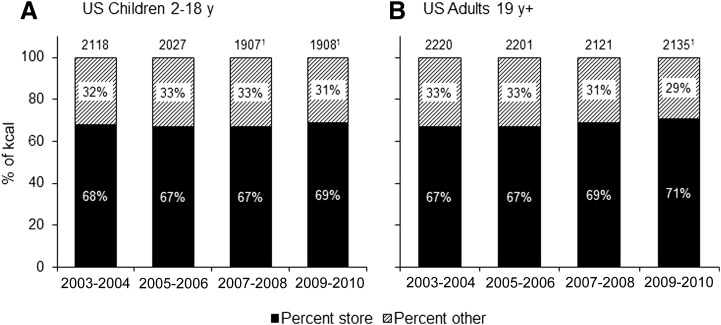
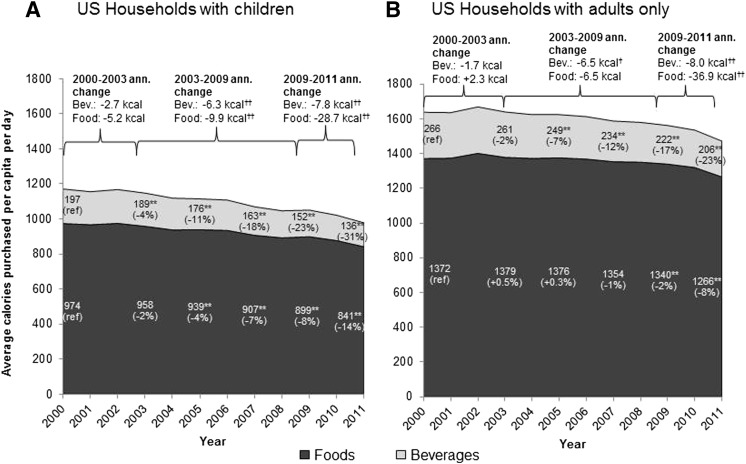
Design: We used nationally representative cross-sectional surveys on intake and longitudinal household food purchase data along with random-effects models to address this question. Data included individuals in NHANES 2003-2004 to 2009-2010 (children: n = 13,422; adults: n = 10,791) and households from the 2000-2011 Nielsen Homescan Panel (households with children: n = 57,298; households with adults only: n = 108,932).
Results: In both data sets, we showed that children decreased their calories the most. Even after we controlled for important socioeconomic factors, caloric purchases fell significantly from 2003 to 2011 (P < 0.001), particularly for households with children. The Great Recession was associated with small increases in caloric purchases, in which a 1-percentage point increase in unemployment in the local market was associated with a 1.6-4.1-kcal · capita⁻¹ · d⁻¹ (P < 0.001) increase in total calories purchased. Results also indicated shifts in caloric purchases were driven more by declines in caloric purchases from beverages than food.
Conclusions: US consumers have exhibited changes in intake and purchasing behavior since 2003 that were independent from changing economic conditions linked with the Great Recession or food prices. Public health efforts in the past decade may have contributed to this trend.
Figures
Similar articles
-
Trends in racial/ethnic and income disparities in foods and beverages consumed and purchased from stores among US households with children, 2000-2013.Am J Clin Nutr. 2016 Sep;104(3):750-9. doi: 10.3945/ajcn.115.127944. Epub 2016 Aug 3. Am J Clin Nutr. 2016. PMID: 27488233 Free PMC article.
-
Are food and beverage purchases in households with preschoolers changing?: a longitudinal analysis from 2000 to 2011.Am J Prev Med. 2014 Sep;47(3):275-82. doi: 10.1016/j.amepre.2014.05.007. Epub 2014 Jul 18. Am J Prev Med. 2014. PMID: 25049217 Free PMC article.
-
Trends in purchases and intake of foods and beverages containing caloric and low-calorie sweeteners over the last decade in the United States.Pediatr Obes. 2013 Aug;8(4):294-306. doi: 10.1111/j.2047-6310.2013.00153.x. Epub 2013 Mar 25. Pediatr Obes. 2013. PMID: 23529974 Free PMC article.
-
Application of the Nutrition Functional Diversity indicator to assess food system contributions to dietary diversity and sustainable diets of Malawian households.Public Health Nutr. 2015 Sep;18(13):2479-87. doi: 10.1017/S136898001500169X. Epub 2015 Jun 1. Public Health Nutr. 2015. PMID: 26027595 Free PMC article. Review.
-
Experimental research on the relation between food price changes and food-purchasing patterns: a targeted review.Am J Clin Nutr. 2012 Apr;95(4):789-809. doi: 10.3945/ajcn.111.024380. Epub 2012 Feb 29. Am J Clin Nutr. 2012. PMID: 22378726 Free PMC article. Review.
Cited by
-
Monitoring changes in the nutritional content of ready-to-eat grain-based dessert products manufactured and purchased between 2005 and 2012.J Acad Nutr Diet. 2015 Mar;115(3):360-368. doi: 10.1016/j.jand.2014.10.018. Epub 2014 Dec 22. J Acad Nutr Diet. 2015. PMID: 25541065 Free PMC article.
-
How Does the Healthfulness of the US Food Supply Compare to International Guidelines for Marketing to Children and Adolescents?Matern Child Health J. 2019 Jun;23(6):768-776. doi: 10.1007/s10995-018-02693-1. Matern Child Health J. 2019. PMID: 30569302 Free PMC article.
-
Global growth of "big box" stores and the potential impact on human health and nutrition.Nutr Rev. 2016 Feb;74(2):83-97. doi: 10.1093/nutrit/nuv062. Epub 2015 Dec 29. Nutr Rev. 2016. PMID: 26714934 Free PMC article. Review.
-
Consumption of Foods Derived from Subsidized Crops Remains Associated with Cardiometabolic Risk: An Update on the Evidence Using the National Health and Nutrition Examination Survey 2009-2014.Nutrients. 2020 Oct 23;12(11):3244. doi: 10.3390/nu12113244. Nutrients. 2020. PMID: 33113961 Free PMC article.
-
Trends in the incidence of diagnosed diabetes: a multicountry analysis of aggregate data from 22 million diagnoses in high-income and middle-income settings.Lancet Diabetes Endocrinol. 2021 Apr;9(4):203-211. doi: 10.1016/S2213-8587(20)30402-2. Epub 2021 Feb 23. Lancet Diabetes Endocrinol. 2021. PMID: 33636102 Free PMC article.
References
-
- Flegal KM, Carroll MD, Kit BK, Ogden CL. Prevalence of obesity and trends in the distribution of body mass index among us adults, 1999-2010. JAMA 2012;307:491–7. - PubMed
-
- Tavernise S. Obesity in young is seen as falling in several cities. New York Times 2012 Dec 10. Available from: http://www.nytimes.com/2012/12/11/health/childhood-obesity-drops-in-new-.....
-
- Wang YC, Orleans CT, Gortmaker SL. Reaching the healthy people goals for reducing childhood obesity: Closing the energy gap. Am J Prev Med 2012;42:437–44. - PubMed
Publication types
MeSH terms
Grants and funding
LinkOut - more resources
Full Text Sources
Other Literature Sources
Medical
Miscellaneous
