. 2014:5:2997.
doi: 10.1038/ncomms3997.

Heterogeneity of genomic evolution and mutational profiles in multiple myeloma

Affiliations
Free PMC article

Heterogeneity of genomic evolution and mutational profiles in multiple myeloma

Niccolo Bolli et al. Nat Commun. 2014.
Free PMC article

Abstract

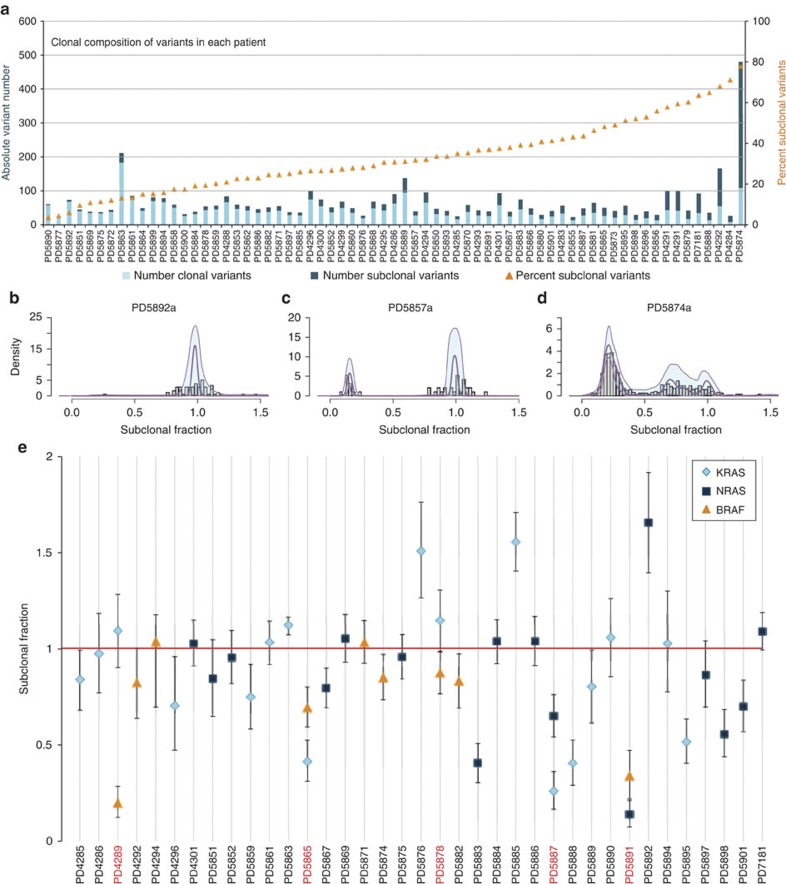
Multiple myeloma is an incurable plasma cell malignancy with a complex and incompletely understood molecular pathogenesis. Here we use whole-exome sequencing, copy-number profiling and cytogenetics to analyse 84 myeloma samples. Most cases have a complex subclonal structure and show clusters of subclonal variants, including subclonal driver mutations. Serial sampling reveals diverse patterns of clonal evolution, including linear evolution, differential clonal response and branching evolution. Diverse processes contribute to the mutational repertoire, including kataegis and somatic hypermutation, and their relative contribution changes over time. We find heterogeneity of mutational spectrum across samples, with few recurrent genes. We identify new candidate genes, including truncations of SP140, LTB, ROBO1 and clustered missense mutations in EGR1. The myeloma genome is heterogeneous across the cohort, and exhibits diversity in clonal admixture and in dynamics of evolution, which may impact prognostic stratification, therapeutic approaches and assessment of disease response to treatment.


Figures

Figure 1
Figure 1. Sequencing metrics of the study.
(a) Total number of validated somatic variants for each patient in the cohort. (b) Breakdown of variants by type. (c) Breakdown of variants by nucleotide change. Transitions (C>T, T>C) are in light blue, transversions (C>A, C>G, T>A, T>G) in dark blue.
Figure 2
Figure 2. Modelling clonal and subclonal mutation clusters.
(a) Stacked bar chart showing the number of clonal mutations (present in all tumour cells, light blue) and subclonal mutations (dark blue) in each patient. Also shown is the percentage of subclonal variants (orange triangles). For patients with multiple samples, the fraction of tumour cells used was derived from the earliest sample where the mutation was found. (bd) Statistical modelling by a Bayesian Dirichlet process of the distribution of clonal and subclonal mutations for three patients for which only one sample was available. For each plot, the faction of tumour cells carrying the variant is represented on the x axis (1=100% of tumour cells), and the probability density (on an arbitrary scale) on the y axis. Grey bars represent the histogram of mutations, with the fitted distribution as a dark purple line. The 95% posterior confidence intervals for the fitted distribution are represented by a pale blue area. (b) Patient showing a vast majority of clonal variants; (c) patient with a dominant set of clonal mutations and a minor subclone; (d) patient showing a dominant set of subclonal mutations, at two different proportions. (e) Adjusted fraction of tumour cells carrying KRAS, NRAS and BRAF substitutions found in the study. Error bars represent 95% confidence intervals, accounting for chromosomal copy number of the locus, percentage contaminating normal cells and depth of coverage. (Note that patient PD5883, carrying a BRAF indel, was not included in this panel due to the inaccurate estimation of the allelic fraction of indels). All mutations whose confidence interval includes 1 (red line) are considered to be present in all tumour cells with 95% confidence. Driver mutations can be found at the clonal or subclonal level, and sometimes coexist in the same patient (Patient IDs in red). For patients with multiple samples, the fraction of tumour cells used was derived from the earliest sample where the mutation was found. In three patients (PD5876, PD5885, PD5892), a fraction of ~1.5 was assigned, likely due to focal subclonal gains of the variant locus that went undetected by our algorithms, so that the estimated fraction of tumour cells was not adjusted.
Figure 3
Figure 3. Clonal evolution.
(ad) Chromosomal copy-number plots for the early and late sample; in each plot, purple=total copy number, blue=copy number of the minor allele. (ai–di) Two-dimensional density plots showing the clustering of the fraction of tumour cells carrying each mutation (black dots) at each time point; increasing intensity of red indicates the location of a high posterior probability of a cluster. (aii–dii) Phylograms representing the clonal composition of the tumour at each timepoint, where the length of each branch is proportional to the size of the clone (that is, the number of variants), and the width to its clonality (that is, the proportion of tumour cells bearing each variant). Grey circles represent the nodes of the phylograms, that is, the point at which a separate group of cells diverges in evolution from the parental clone. The distance between nodes relates to the evolution time from the fertilized egg down the trunk of the phylograms (that is, the main clone of the tumour), through the most recent common ancestor to the branches of the phylogram (that is, the different subclones of the tumour arisen later in evolution). For each branch, the number and average clonality of the variants has been annotated (black text), along with notable copy-number changes and mutations (dark blue text). (e) Pie chart breakdown of the proportional representation of the different kinds of clonal evolution observed in the cohort. (f) Histograms showing the number of cases and type of clonal evolution for each karyotypic subgroup.
Figure 4
Figure 4. Mutational processes operative in multiple myeloma.
(a,b) Fraction of contribution of each mutation type at each context for the two mutational signatures identified by NMF analysis. The major components contributing to each signature are highlighted with arrows. (c) Stacked bar chart showing the percentage contribution of the two mutational processes identified by NMF to the total number of variants present in each case. Dark blue bars=Signature B, light blue bars=Signature A. (d) In two examples of branching evolution, PD4283 and PD4301, the percentage contribution of the two mutational processes identified by NMF to the variants present in the early sample (dark purple box) was compared with that of the new variants in the late sample (orange box). A stacked bar chart shows that the contribution from Signature B increases significantly in the ‘late’ variants (χ2 test). Dark blue bars=Signature B, light blue bars=Signature A.
Figure 5
Figure 5. Landscape of genetic alterations and recurrently mutated genes in multiple myeloma.
Table highlighting relevant genetic alterations and recurrently mutated genes in the study. Patients are represented in columns. (a) Karyotypic features of each patient. (b) Recurrently mutated genes, color coded for missense (green), nonsense (red) and splice-site (blue) substitutions; indels are in light purple and homozygous deletions in ocra. For patients with serial samples, events occurring only in one sample only are highlighted with a diagonal bar. In case of multiple mutations in the same gene in a patient, only one is plotted. In case a mutation is associated with the deletion of the wild-type allele, the gene shows a black contour. For each gene, the number of patients harbouring at least one non-silent mutation is provided in the ‘TOTAL’ column. Asterisks mark genes mutated at a significant recurrence rate in the data set (P-value<0.02 and false discovery rate of <10%).
Figure 6
Figure 6. Novel gene mutations identified in multiple myeloma.
Schematic representation of known or predicted functional domains (from NCBI) of the protein products of the main novel genes identified in the screen, and location of the observed variants, color coded by type: red=truncating variants (nonsense, out-of-frame indels, essential splice-site mutations), green=missense variants, and blue=in-frame indels. FAT3 shows a homozygous deletion spanning the whole locus in a patient and this is shown by a red bar.

References

    1. Fonseca R. et al. International Myeloma Working Group molecular classification of multiple myeloma: spotlight review. Leukemia 23, 2210–2221 (2009). - PMC - PubMed
    1. Bergsagel P. L. & Kuehl W. M. Molecular pathogenesis and a consequent classification of multiple myeloma. J. Clin. Oncol. 23, 6333–6338 (2005). - PubMed
    1. Hideshima T., Mitsiades C., Tonon G., Richardson P. G. & Anderson K. C. Understanding multiple myeloma pathogenesis in the bone marrow to identify new therapeutic targets. Nat. Rev. Cancer. 7, 585–598 (2007). - PubMed
    1. Morgan G. J., Walker B. A. & Davies F. E. The genetic architecture of multiple myeloma. Nat. Rev. Cancer. 12, 335–348 (2012). - PubMed
    1. Chapman M. A. et al. Initial genome sequencing and analysis of multiple myeloma. Nature 471, 467–472 (2011). - PMC - PubMed

Publication types

MeSH terms

Substances