. 2014:5:3024.
doi: 10.1038/ncomms4024.

Imaging of molecular surface dynamics in brain slices using single-particle tracking

Affiliations
Free PMC article

Imaging of molecular surface dynamics in brain slices using single-particle tracking

B Biermann et al. Nat Commun. 2014.
Free PMC article

Abstract

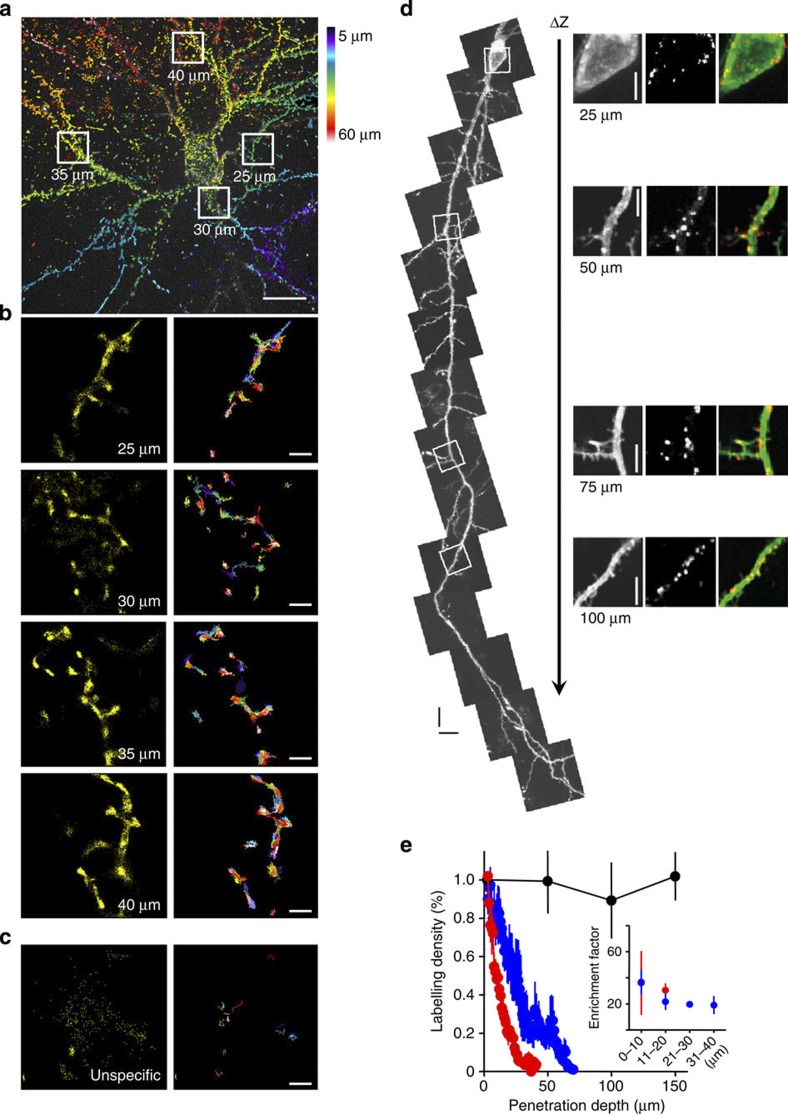
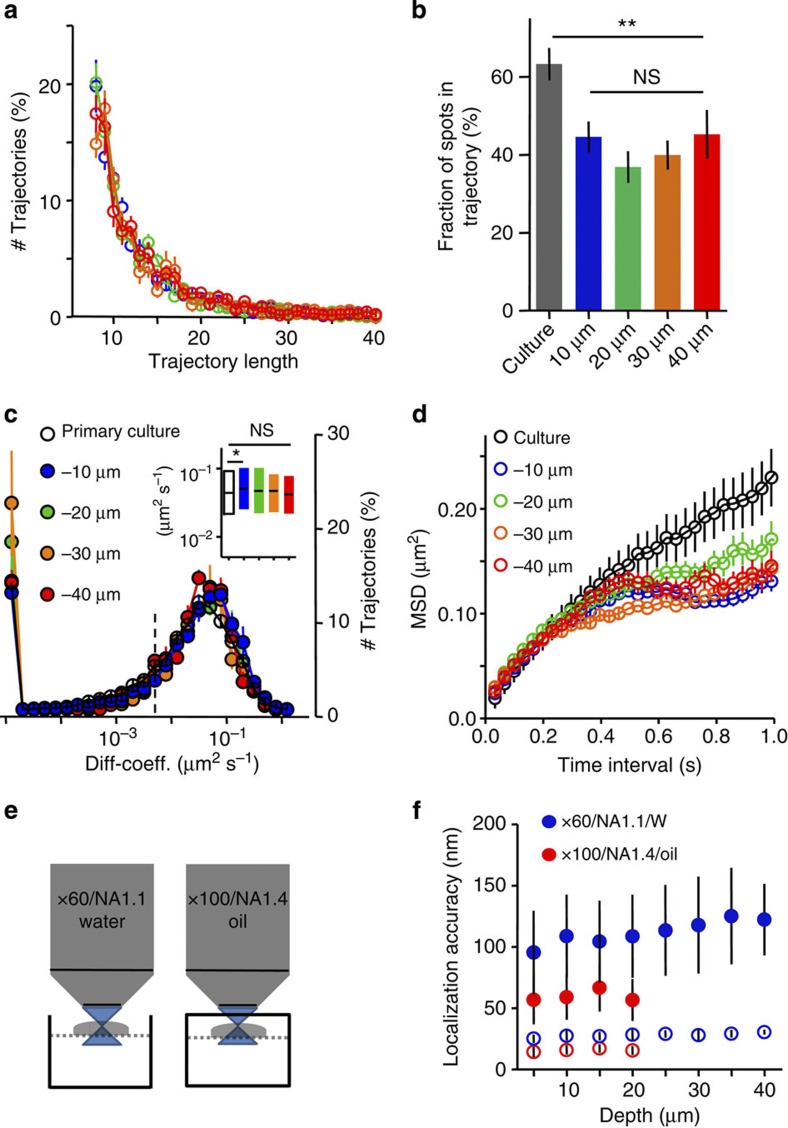
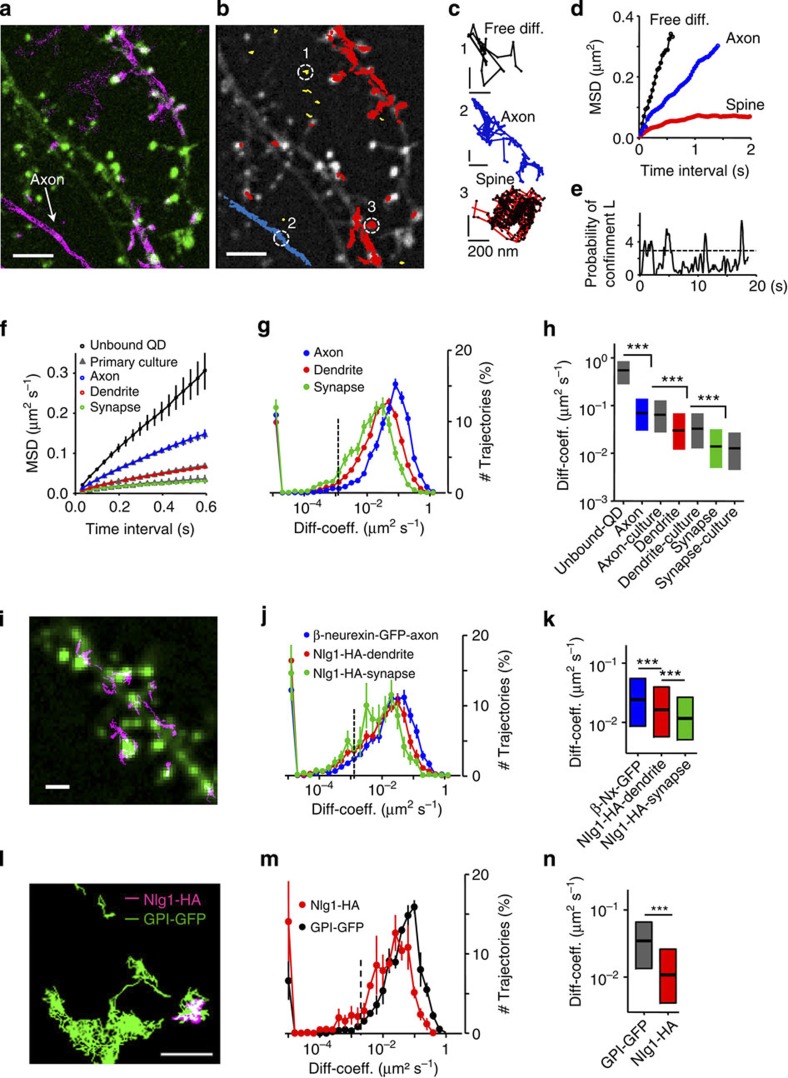
Organization of signalling molecules in biological membranes is crucial for cellular communication. Many receptors, ion channels and cell adhesion molecules are associated with proteins important for their trafficking, surface localization or function. These complexes are embedded in a lipid environment of varying composition. Binding affinities and stoichiometry of such complexes were so far experimentally accessible only in isolated systems or monolayers of cell culture. Visualization of molecular dynamics within signalling complexes and their correlation to specialized membrane compartments demand high temporal and spatial resolution and has been difficult to demonstrate in complex tissue like brain slices. Here we demonstrate the feasibility of single-particle tracking (SPT) in organotypic brain slices to measure molecular dynamics of lipids and transmembrane proteins in correlation to synaptic membrane compartments. This method will provide important information about the dynamics and organization of surface molecules in the complex environment of neuronal networks within brain slices.


Figures

Figure 1
Figure 1. SPT in organotypic brain slices using QDs coupled to a monoclonal antibody against GFP.
(a) Z-projection of anti-GFP QDs inside an organotypic hippocampal slice acquired with our CSU set-up: anti-GFP QDs at dendrites of a GPI–GFP-transfected neuron were recorded at different depths inside the slice with an acquisition frequency of 10 Hz and an axial sampling rate of 0.1 μm. The colour encodes the z-depth of localized molecules within the stack projection, starting from 5 μm (blue) to 60 μm (deep red). Scale bar, 10 μm. (b) Magnified view of the positions of detected molecules at four different depths/locations, as indicated in a. Extracted trajectories are plotted with different colours in the right panel. Note that the labelling specificity remains similar between the four given examples. (c) Example of freely diffusing unspecific QDs. Note that the large cloud of detected QDs only results in very few trajectories because of the quick escape of QDs from the focal plane. Scale bar, 1 μm (b,c). (d) Projections of z-scans along a GPI–GFP-transfected neuron within an organotypic hippocampal slice using a two-photon microscope. Scale bar, 10 μm. Enlarged subregions at different depths show specific labelling with anti-GFP QDs without a loss of labelling density. Scale bar, 5 μm. (e) Quantification of relative labelling density for three experimental settings (red, single-photon excitation, oil immersion objective × 100/NA 1.4, blue, single-photon excitation, water immersion objective × 60/NA 1.1, black, two photon excitation, water immersion objective × 60/NA 1.1, error bars represent±s.e.m.). The labelling density was calculated by normalizing the number of QDs detected within optical slices to the density at 3 μm penetration depth. The inset demonstrates that there is only minor change in the specificity of labelling within the first 40 μm (error bars represent±s.e.m.). Data obtained with × 60/NA 1.1 water immersion objective are from 11 neurons in 7 organotypic slice cultures and data acquired with a × 100/NA 1.4 oil immersion objective are from 7 neurons in three slice cultures. Two-photon data are from six neurons in four slice cultures.
Figure 2
Figure 2. Characterization of GPI–GFP mobility.
(a) Distribution of trajectory lengths in different depths (minimal time points=8, n=33 neurons, 11 slice cultures). (b) The percentage of localizations that are included into trajectories ≥12 time points at different depths (data are represented as mean±s.e.m., differences tested by one-way analysis of variance followed by the Newman–Keuls multiple comparison test, **P<0.001). (c) Distribution of diffusion coefficients (D) of neuronal expressed GPI–GFP at different depth, the population with D<0.008 μm2 s−1 (dotted line) represents the immobile fraction (n=12,678 trajectories, 42 slices, 15 slice cultures). The inset shows mobile fraction (D>0.008 μm2 s−1) with median and interquartile (IQR). Note there is no difference between different depths despite the difference between culture (white) and slices at 10 μm depth (blue). Differences were tested by the Kruskal–Wallis test followed by Dunn’s multiple comparison test (*P<0.05). (d) MSD shown for trajectories ≥34 time points at different depths. Data are same as in c. Note the similar initial slope but deviation in curvature of the MSD, indicating stronger confinement within slices (MSD of trajectories >29 time points, 42 slices, 15 slice cultures). (e) Sketch of experimental set-up for different objectives, dotted line indicates a nylon grid to allow medium perfusion during recording. The closed chamber was used for oil immersion objective. Slices within this chamber were imaged for ≤20 min. (f) Localization accuracy for different depths and different objectives at 30 Hz. Used laser powers are 400 and 100 mW for water immersion objective × 60/NA 1.1 and oil immersion objective × 100/NA 1.4, respectively. The oil immersion objective exhibits better localization accuracy but allows measurements within the first 20 μm only. Empty circles represent theoretical limit for the localization accuracy based on photon numbers, filled circles denote localization accuracy computed from the s.d. of Gaussian fits to immobile QDs in living brain slices (see Methods: ‘Image analysis and statistics’). Data are represented as means±s.d., five slice cultures for the water, seven slice cultures for the oil objective. The number of QDs decreased as a function of depth and ranged from 51 to 12 and from 70 to 5 for water and oil objective, respectively.
Figure 3
Figure 3. QD dynamics in membrane compartments.
(a) Image of dendrites expressing Homer1C-DsRed (green) and GPI–GFP (magenta). Positions of anti-GFP QDs, unspecific QDs are detected outside labelled neurits. (b) Individual trajectories of GPI molecules (red, dendrite; blue, axonal; yellow, extracellular), scale bar,10 μm (a,b). (c) Exemplary trajectories from b: unbound QD (black), axonal (blue) and spine (red); scale bar, 200 nm. (d) MSD for trajectories in c. (e) Probability of confinement for spine trajectory, dotted line indicates level above which particles are considered to be confined. (f) MSD for unbound (black), axonal (blue), dendritic (red) and synaptic (green) trajectories, corresponding data from cultured neurons are similar (grey triangle). Data are means±s.e.m., n trajectories of >29 time points are included from 115 unbound QDs, 246/349 axonal slice/primary culture, 580/483 dendritic and 540/71 synaptic trajectories (72 slices (10 slice cultures), 10 cells (3 cultures)). (g) Distribution of diffusion coefficients (D) within subcellular compartments (axons, blue; dendrites, red; synapses, green). Data represented as mean±s.e.m., 21,390 trajectories, 72 slices, 10 slice cultures. (h) Mobile fraction of GPI–GFP within different subcellular compartments as median and IQR, differences between axons, dendrites and synapses were tested by the Kruskal–Wallis test followed by a Dunn’s multiple comparison test, ***P<0.0001, data are from 89 unbound QD, 2880/828 axon slice/culture, 7,690/994 dendrite and 2,425/282 synapse trajectories. (i) Dendritic segment, transfected with Homer1C–GFP (green) and trajectories of anti-HA-QD-labelled Nlg1-HA (magenta). (j) Distribution of D of Nlg1-HA dendrites (red), synapses (green), β-neurexin–GFP axons (blue); error bars represent±s.e.m., data from 27 slices, 5 slice cultures. (k) Mobile fraction of Nlg1-HA and β-neurexin–GFP, median and IQR; differences were tested by the Kruskal–Wallis and Dunn’s multiple comparison test, ***P<0.0001, Nlg1-HA trajectories: 1,987 dendritic, 569 synaptic; β-neurexin trajectories: 2,529 axonal. (l) Exemplary trajectories of GPI–GFP (green) and Nlg1-HA (magenta) at co-transfected neuron, scale bars, 1 μm (il). (m) Distribution of D for Nlg1-HA (red) and GPI–GFP (black). (n) Mobile fraction of Nlg1-HA and GPI–GFP, median and IQR, data in m and n include 607 trajectories for Nlg1-HA, 1,221 for GPI–GFP, 7 slices, 5 slice cultures; differences were tested by the Mann–Whitney test, ***P<0.0001.

References

    1. Heine M. et al.. Surface mobility of postsynaptic AMPARs tunes synaptic transmission. Science 320, 201–205 (2008). - PMC - PubMed
    1. Ribrault C., Sekimoto K. & Triller A. From the stochasticity of molecular processes to the variability of synaptic transmission. Nat. Rev. Neurosci. 12, 375–387 (2011). - PubMed
    1. Dustin M. L. & Depoil D. New insights into the T cell synapse from single molecule techniques. Nat. Rev. Immunol. 11, 672–684 (2011). - PMC - PubMed
    1. Chan P. Y. et al.. Influence of receptor lateral mobility on adhesion strengthening between membranes containing LFA-3 and CD2. J. Cell Biol. 115, 245–255 (1991). - PMC - PubMed
    1. Missler M. et al.. Alpha-neurexins couple Ca2+ channels to synaptic vesicle exocytosis. Nature 423, 939–948 (2003). - PubMed

Publication types

LinkOut - more resources