. 2014:5:3061.
doi: 10.1038/ncomms4061.

Hypothalamic inhibition of socio-sexual behaviour by increasing neuroestrogen synthesis

Affiliations
Free PMC article

Hypothalamic inhibition of socio-sexual behaviour by increasing neuroestrogen synthesis

Takayoshi Ubuka et al. Nat Commun. 2014.
Free PMC article

Abstract

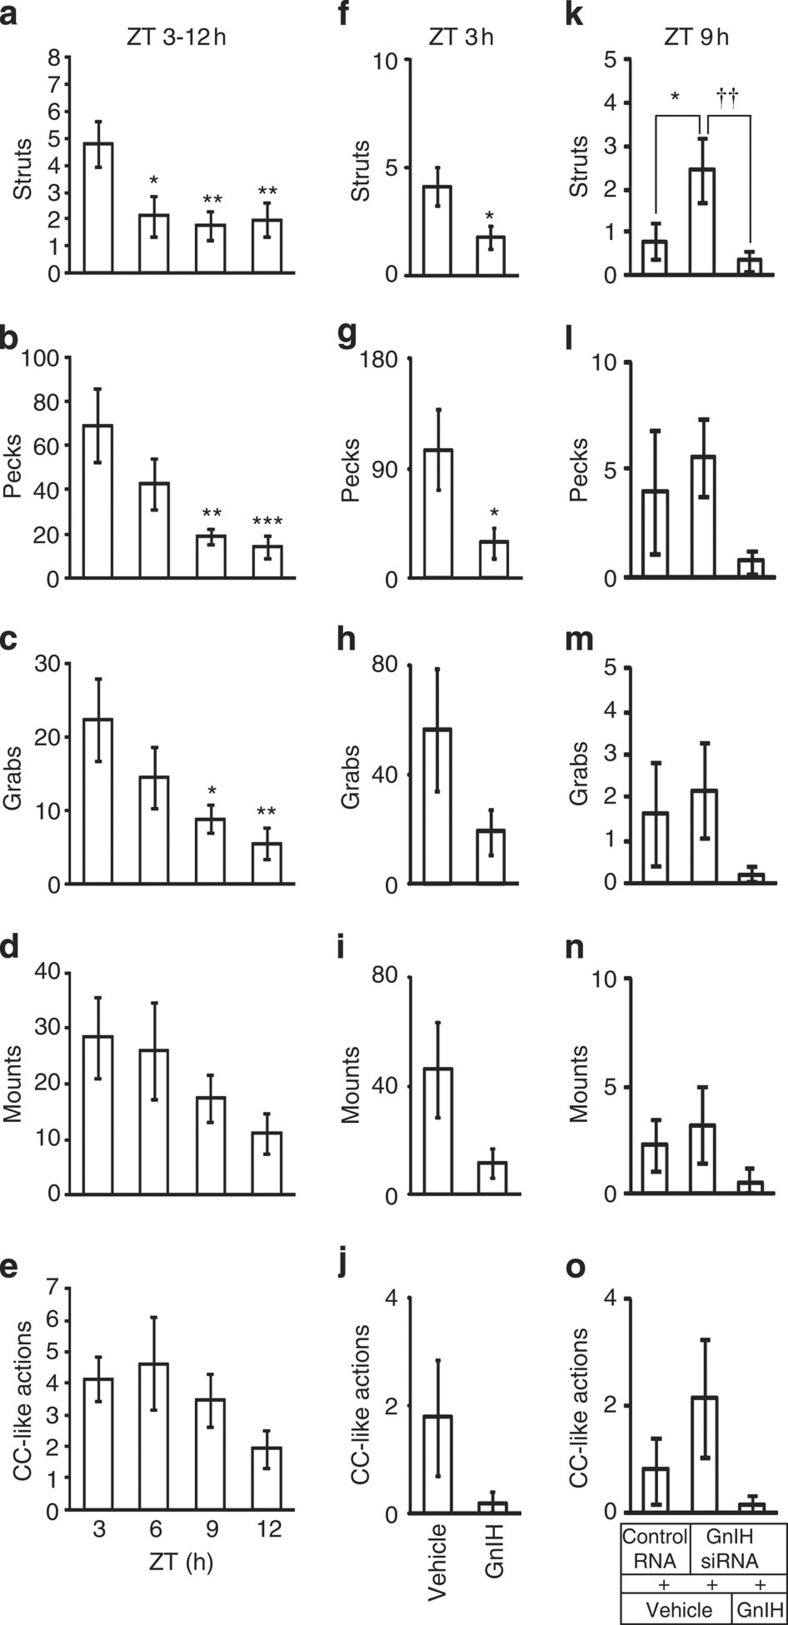
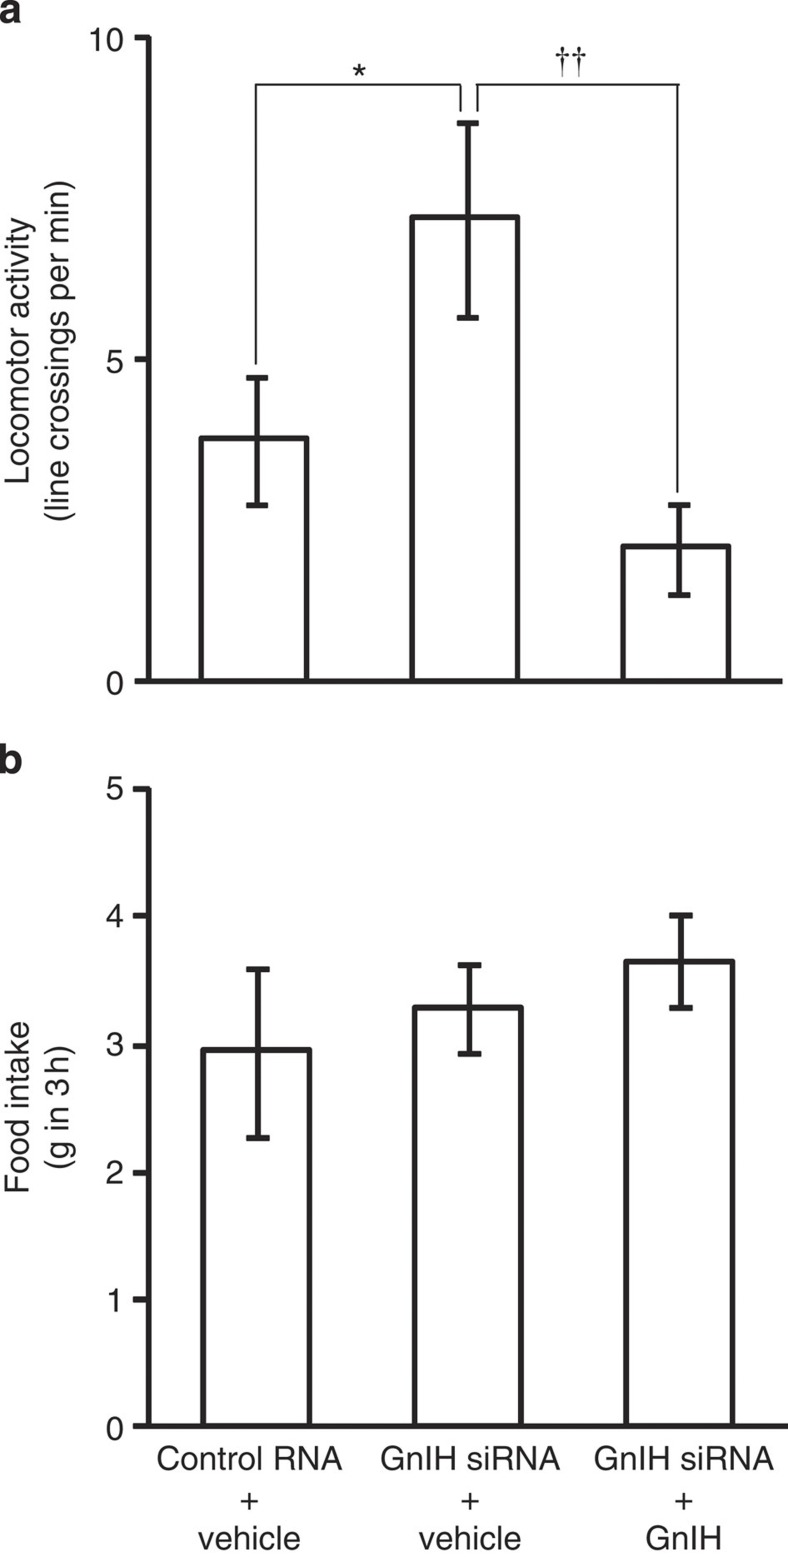
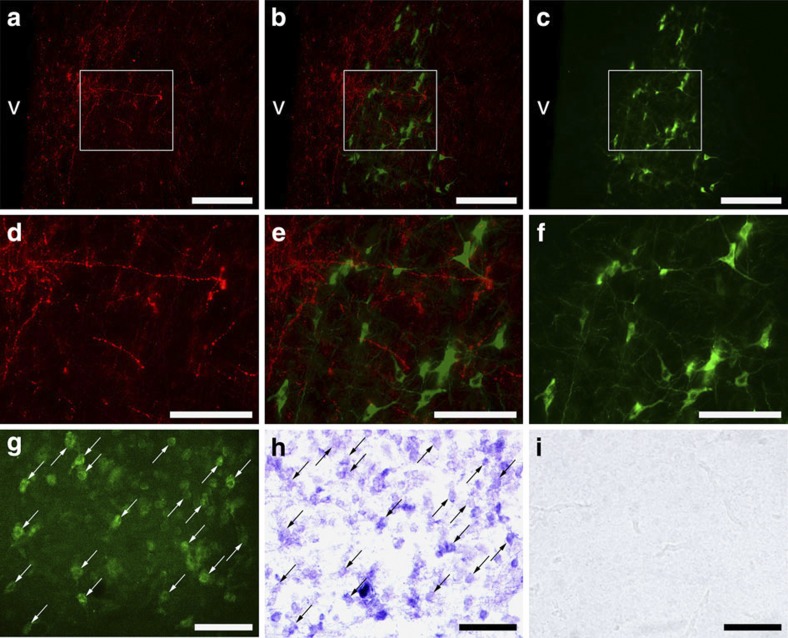
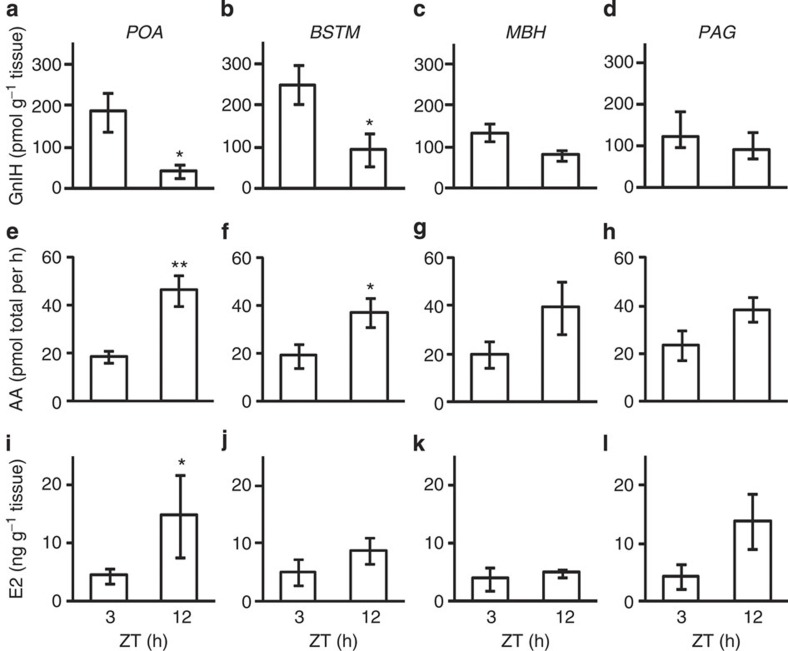
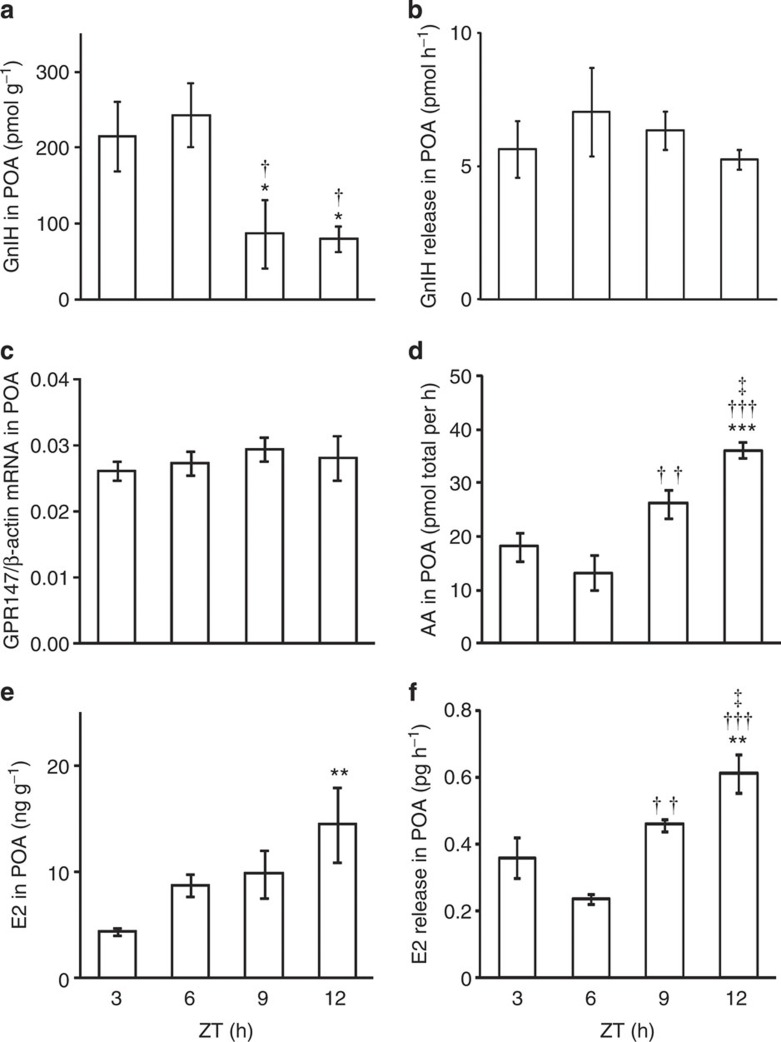
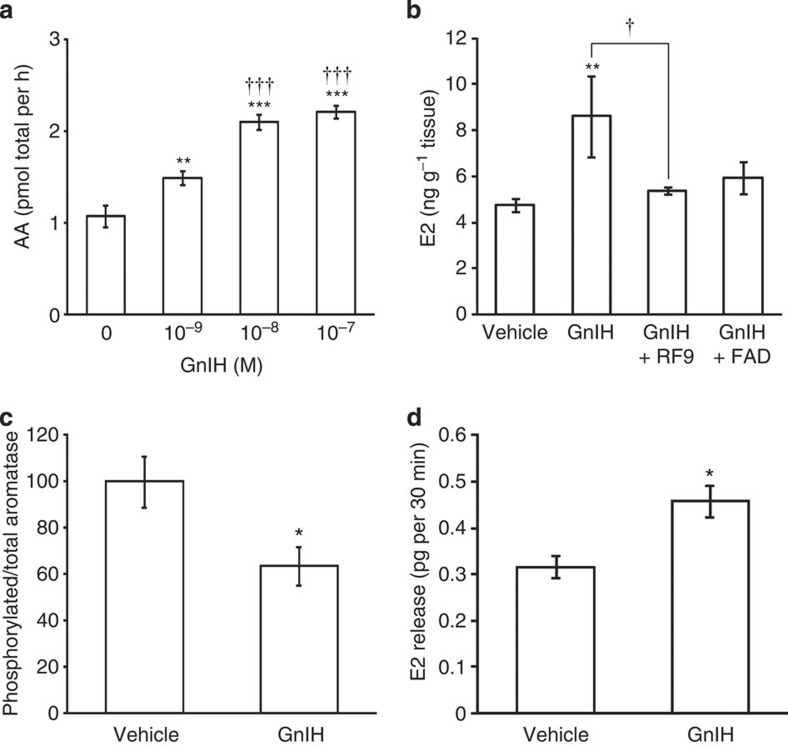
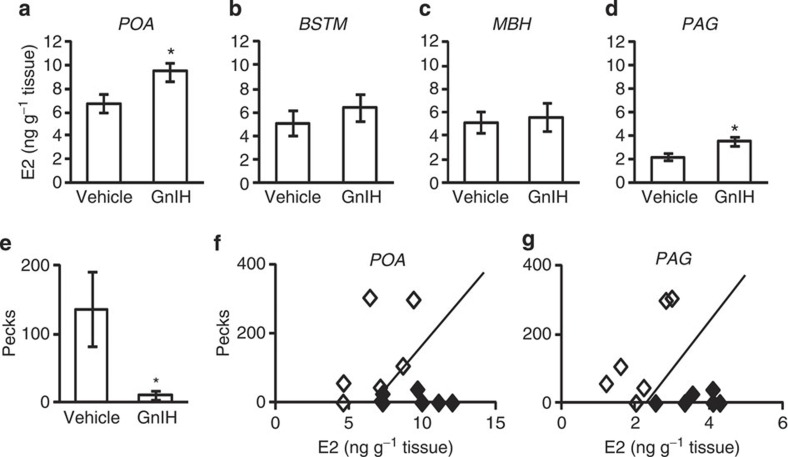
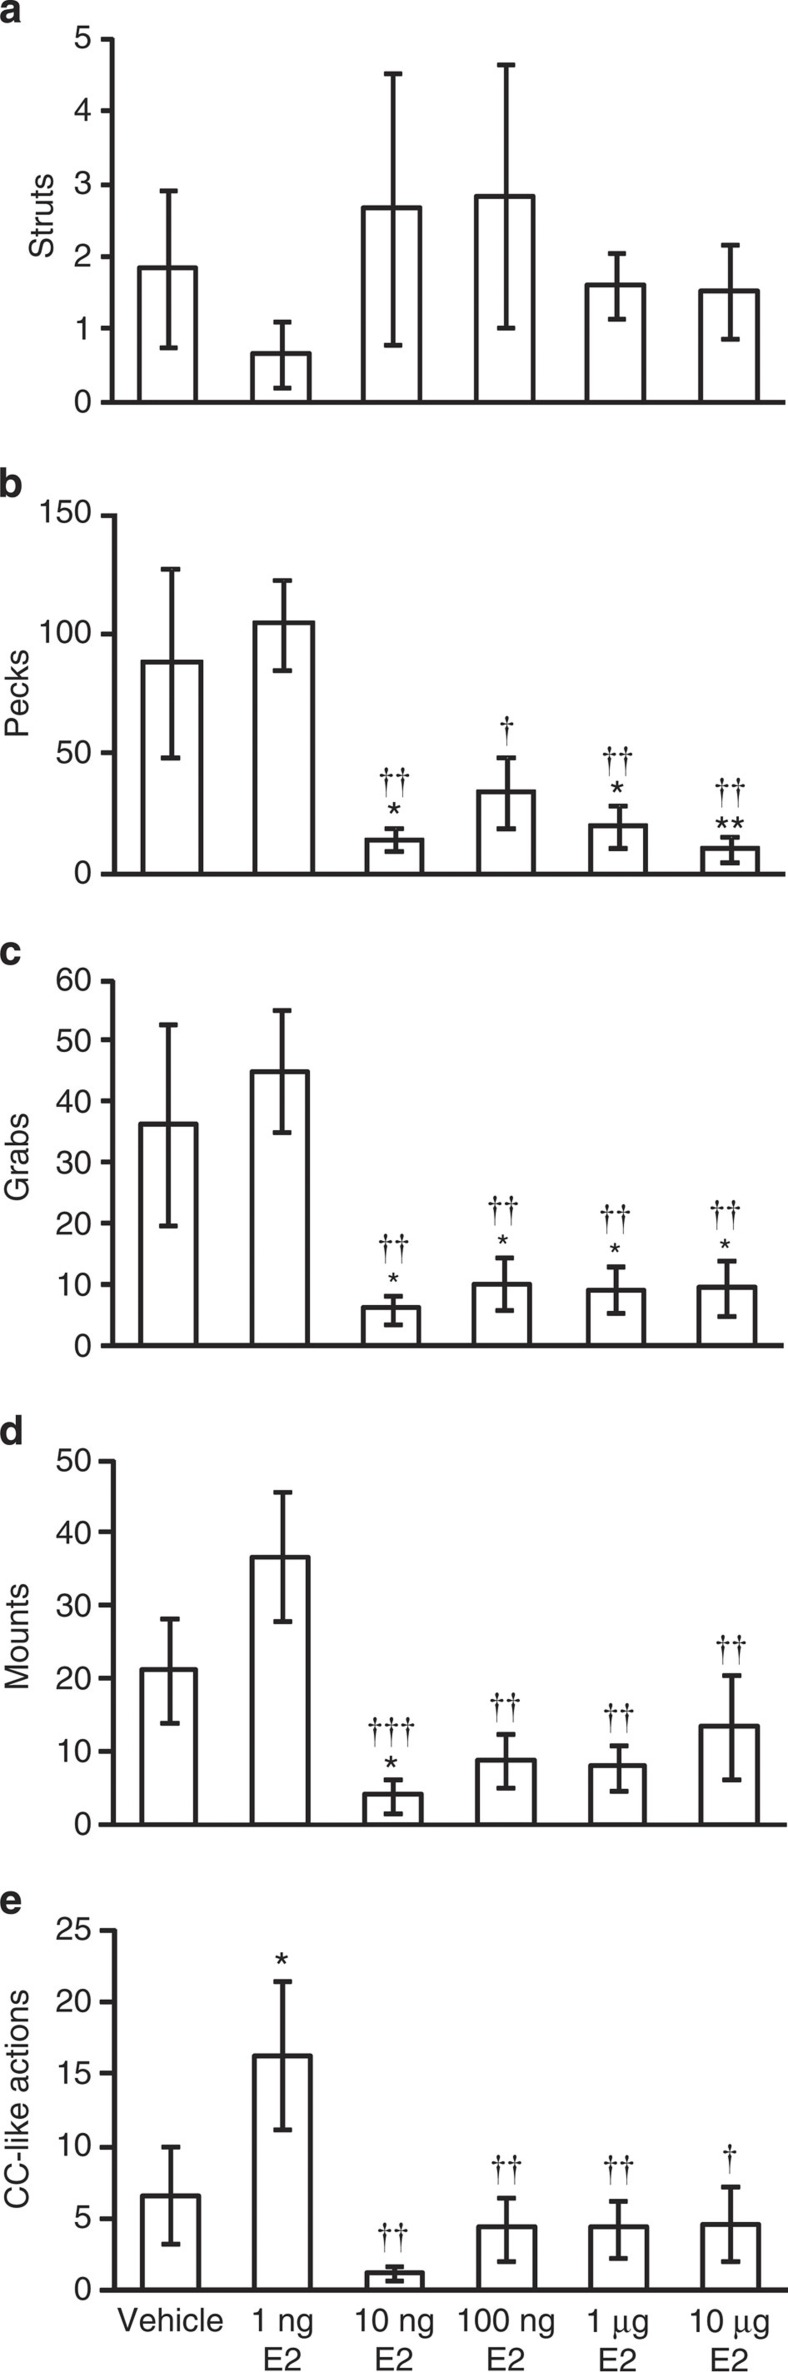
Gonadotropin-inhibitory hormone (GnIH) is a hypothalamic neuropeptide that inhibits gonadotropin secretion and socio-sexual behaviours. Oestrogen (neuroestrogen) synthesized in the brain from androgen by aromatase regulates male socio-sexual behaviours. Here we show that GnIH directly activates aromatase and increases neuroestrogen synthesis in the preoptic area (POA) and inhibits socio-sexual behaviours of male quail. Aromatase activity and neuroestrogen concentration in the POA are low in the morning when the birds are active, but neuroestrogen synthesis gradually increases until the evening when the birds become inactive. Centrally administered GnIH in the morning increases neuroestrogen synthesis in the POA and decreases socio-sexual behaviours. Centrally administered 17β-oestradiol at higher doses also inhibits socio-sexual behaviours in the morning. These results suggest that GnIH inhibits male socio-sexual behaviours by increasing neuroestrogen synthesis beyond its optimum concentration for the expression of socio-sexual behaviours. This is the first demonstration of any hypothalamic neuropeptide that directly regulates neuroestrogen synthesis.


Figures

Figure 1
Figure 1. Diurnal changes and the effects of GnIH and/or GnIH RNAi on socio-sexual actions of male quail.
Number of Struts (a,f,k), Pecks (b,g,l), Grabs (c,h,m), Mounts (d,i,n), and Cloacal contact-like (CC-like) actions (e,j,o) was counted in 5 min. (ae) Diurnal socio-sexual behaviours were recorded during ZT 2.5 and 3.5 h (ZT 3), ZT 5.5 and 6.5 h (ZT 6), ZT 8.5 and 9.5 h (ZT 9), and ZT 11.5 and 12.5 h (ZT 12). The columns and the vertical lines represent the mean±s.e.m. (n=8). (a) Degrees of freedom (DOF)=31, F=4.2, P=0.015 by one-way ANOVA; *P<0.05, **P<0.01 versus ZT 3 by Fisher’s PLSD. (b) DOF=31, F=5.8, P=0.0032 by one-way ANOVA; **P<0.01, ***P<0.001 versus ZT 3 by Fisher’s PLSD. (c) DOF=31, F=3.8, P=0.020 by one-way ANOVA; *P<0.05, **P<0.01 versus ZT 3 by Fisher’s PLSD. (fj) Effect of central administration of GnIH on socio-sexual activities of male quail. The columns and the vertical lines represent the mean±s.e.m. (n=12). (f) DOF=22, t=2.2, *P=0.041 by two-tailed Student’s t-test. (g) DOF=22, t=2.1, *P=0.045 by two-tailed Student’s t-test. (ko) Effect of GnIH RNAi and GnIH administration on socio-sexual activities of male quail. The columns and the vertical lines represent the mean±s.e.m. (n=8). (k) DOF=23, F=4.5, P=0.024 by one-way ANOVA; *P<0.05, ††P<0.01 by Fisher’s PLSD.
Figure 2
Figure 2. Effect of GnIH RNAi and central administration of GnIH on locomotor activity and food intake.
(a) Effect of GnIH RNAi and central administration of GnIH on locomotor activity. The columns and the vertical lines represent the mean ±s.e.m. (n=8). DOF=23, F=5.2, P=0.015 by one-way ANOVA; *P<0.05, ††P<0.01 by Fisher’s PLSD. (b) Effects of GnIH RNAi and central administration of GnIH on food intake. The columns and the vertical lines represent the mean±s.e.m. (n=12).
Figure 3
Figure 3. Distribution of GnIH-ir fibres and aromatase-ir cells and GnIH receptor mRNA in the POA.
(a) Abundant GnIH-ir neuronal fibres were observed in the POA. v, third ventricle. Bar, 100 μm. (c) A cluster of aromatase-ir cells was observed in the POA. v, third ventricle. Bar, 100 μm. (b) The merged image of the pictures (a) and (c) showed abundant GnIH-ir neuronal fibres in the vicinity of aromatase-ir cells. v, third ventricle. Bar, 100 μm. Similar results were obtained in repeated experiments using four different birds. (df) Higher magnification of the blocked area in (ac). Bar, 50 μm. (gi) Aromatase immunohistochemistry (g) and in situ hybridization for GnIH receptor (GPR147) mRNA on the same sections showed that almost all aromatase-ir cells express GPR147 mRNA. Arrows in (g) and (h) indicate identical cells in the POA. Bar, 50 μm. In situ hybridization using sense RNA probe (i) served as controls. Similar results were obtained in repeated experiments using three different birds.
Figure 4
Figure 4. Diurnal changes in GnIH content and AA and E2 content in the quail brain.
The quail brains were collected between ZT 2.5 and 3.5 h (ZT 3) or ZT 11.5 and 12.5 h (ZT 12). The brain regions including preoptic area (POA), bed nucleus of the stria terminalis (BSTM), mediobasal hypothalamus (MBH) and periaqueductal grey (PAG) were separated according to the regions described in Supplementary Fig. 5. (ad) Diurnal changes in GnIH concentration in the quail brain. The columns and the vertical lines represent the mean±s.e.m. (n=5). (a), DOF=8, t=2.9, *P=0.021 by two-tailed Student’s t-test. (b) DOF=8, t=2.5, *P=0.036 by two-tailed Student’s t-test. (eh) Diurnal changes in AA in the quail brain. The columns and the vertical lines represent the mean±s.e.m. (n=5). (e) DOF=8, t=−4.1, **P=0.0036 by two-tailed Student’s t-test. (f) DOF=8, t=−2.4, *P=0.045 by two-tailed Student’s t-test. (il) Diurnal changes in E2 concentration in the quail brain. The columns and the vertical lines represent the mean±s.e.m. (n=5). (i) U=3, Z=−2.0, *P=0.047 by Mann–Whitney U-test.
Figure 5
Figure 5. Diurnal changes in GnIH content and release and GnIH receptor mRNA expression and AA and E2 content and release in the POA.
(a) Diurnal changes in GnIH concentration in the POA. The columns and the vertical lines represent the mean±s.e.m. (n=4). DOF=15, F=4.7, P=0.022 by one-way ANOVA; *P<0.05 versus ZT 3, P<0.05 versus ZT 6 by Fisher’s PLSD. (b) Diurnal changes in GnIH release in the POA. The columns and the vertical lines represent the mean±s.e.m. (n=3). (c) Diurnal changes in GnIH receptor (GPR147) mRNA expression in the POA. The columns and the vertical lines represent the mean±s.e.m. (n=4). (d) Diurnal changes in AA in the POA. The columns and the vertical lines represent the mean±s.e.m. (n=4). DOF=15, F=14, P=0.00029 by one-way ANOVA; ***P<0.001 versus ZT 3, ††P<0.01, †††P<0.001 versus ZT 6, , P<0.05 versus ZT 9 by Fisher’s PLSD. (e) Diurnal changes in E2 concentration in the POA. The columns and the vertical lines represent the mean±s.e.m. (n=5). DOF=19, F=3.8, P=0.032 by one-way ANOVA; **P<0.01 versus ZT 3 by Fisher’s PLSD. (f) Diurnal changes in E2 release in the POA. The columns and the vertical lines represent the mean±s.e.m. (n=3). DOF=11, F=14, P=0.0016 by one-way ANOVA; **P<0.01 versus ZT 3, ††P<0.01, †††P<0.001 versus ZT 6, P<0.05 versus ZT 9 by Fisher’s PLSD.
Figure 6
Figure 6. Effect of GnIH administration on AA and E2 content and phosphorylated aromatase and E2 release in the POA.
(a) AA was measured in the brain blocks including the POA that were incubated with GnIH at various concentrations. The columns and the vertical lines represent the mean±s.e.m. (n=6). DOF=23, F=37, P=2.6 × 10⁻⁸ by one-way ANOVA; **P<0.01; ***P<0.001 versus control, †††P<0.001 versus 10−9 M GnIH by Fisher’s PLSD. (b) E2 concentration was measured in the brain blocks including the POA that were incubated with 10−7 M GnIH alone (GnIH) or with 10−6 M RF9 (GnIH+RF9) or 10−6 M fadrozole (GnIH+FAD) or vehicle (Vehicle). The columns and the vertical lines represent the mean±s.e.m. (n=6). DOF=23, F=3.2, P=0.046 by one-way ANOVA; **P<0.01 versus vehicle. P<0.05 by Fisher’s PLSD. (c) Effect of central administration of GnIH on phosphorylated aromatase in the POA. The columns and the vertical lines represent the mean±s.e.m. (n=4). DOF=6, t=2.6, *P=0.040 by two-tailed Student’s t-test. (d) Effect of GnIH administration on E2 release in the POA by retromicrodialysis. The columns and the vertical lines represent the mean±s.e.m. (n=3). DOF=4, t=−3.4, *P=0.027 by two-tailed Student’s t-test.
Figure 7
Figure 7. Effect of central administration of GnIH on E2 content in the brain and the frequency of Pecks.
(a) Effect of GnIH administration on E2 concentration in the POA. The columns and the vertical lines represent the mean±s.e.m. (n=6). DOF=10, t=−2.4,*P=0.037 by two-tailed Student’s t-test. (b) Effect of GnIH administration on E2 concentration in the BSTM. The columns and the vertical lines represent the mean±s.e.m. (n=6). (c) Effect of GnIH administration on E2 concentration in the MBH. The columns and the vertical lines represent the mean±s.e.m. (n=6). (d) Effect of GnIH administration on E2 concentration in the PAG. The columns and the vertical lines represent the mean±s.e.m. (n=6). DOF=10, t=−3.0,*P=0.015 by two-tailed Student’s t-test. (e) Effect of GnIH administration on the number of Pecks in 5 min. The columns and the vertical lines represent the mean±s.e.m. (n=6). DOF=10, t=2.3,*P=0.047 by two-tailed Student’s t-test. (f) E2 concentration in the brain blocks including the POA (a) was plotted against the number of Pecks (e). Open diamonds indicate the results of vehicle administered birds, whereas closed diamonds indicate the results of GnIH administered birds. The line is the discrimination lines by linear discriminant analysis; P=0.025. (g) E2 concentration in the brain blocks including the PAG (d) was plotted against the number of Pecks (e). Open diamonds indicate the results of vehicle administered birds, whereas closed diamonds indicate the results of GnIH administered birds. The line is the discrimination lines by linear discriminant analysis; P=0.009.
Figure 8
Figure 8. Effect of central administration of E2 on socio-sexual actions of male quail.
(a) Effect of E2 administration on the number of Struts in 5 min. The columns and the vertical lines represent the mean±s.e.m. (n=5). (b) Effect of E2 administration on the number of Pecks in 5 min. The columns and the vertical lines represent the mean±s.e.m. (n=5). DOF=29, F=4.3, P=0.0059 by one-way ANOVA; *P<0.05, **P<0.01 versus vehicle, P<0.05, ††P<0.01 versus 1 ng E2 by Fisher’s PLSD. (c) Effect of E2 administration on the number of Grabs in 5 min. The columns and the vertical lines represent the mean±s.e.m. (n=5). DOF=29, F=4.0, P=0.0093 by one-way ANOVA; *P<0.05 versus vehicle, ††P<0.01 versus 1 ng E2 by Fisher’s PLSD. (d) Effect of E2 administration on the number of Mounts in 5 min. The columns and the vertical lines represent the mean±s.e.m. (n=5). DOF=29, F=4.2, P=0.0071 by one-way ANOVA; *P<0.05 versus vehicle, ††P<0.01, †††P<0.001 versus 1 ng E2 by Fisher’s PLSD. (e) Effect of E2 administration on the number of CC-like actions in 5 min. The columns and the vertical lines represent the mean±s.e.m. (n=5). DOF=29, F=3.1, P=0.027 by one-way ANOVA; *P<0.05 versus vehicle, P<0.05, ††P<0.01 versus 1 ng E2 by Fisher’s PLSD.

Similar articles

Cited by

References

    1. Tsutsui K. et al. A novel avian hypothalamic peptide inhibiting gonadotropin release. Biochem. Biophys. Res. Commun. 275, 661–667 (2000). - PubMed
    1. Ubuka T., Ukena K., Sharp P. J., Bentley G. E. & Tsutsui K. Gonadotropin-inhibitory hormone inhibits gonadal development and maintenance by decreasing gonadotropin synthesis and release in male quail. Endocrinology 147, 1187–1194 (2006). - PubMed
    1. Tsutsui K. et al. Gonadotropin-inhibitory hormone (GnIH) and its control of central and peripheral reproductive function. Front. Neuroendocrinol. 31, 284–295 (2010). - PubMed
    1. Ubuka T. & Bentley G. E. in: Hormones and Reproduction of Vertebrates, Birds Vol 4 eds Norris D. O., Lopez K. H. 1–25Academic Press (2010).
    1. Tsutsui K. & Ubuka T. Gonadotropin-inhibitory Hormone, in Handbook of biologically active peptides. Section on brain peptides eds Kastin A. J., Vaudry H. 802–811Academic Press (2013).

Publication types

MeSH terms

LinkOut - more resources