. 2014 Feb;124(2):812-23.
doi: 10.1172/JCI66776. Epub 2014 Jan 16.

Macrophages eliminate circulating tumor cells after monoclonal antibody therapy

Macrophages eliminate circulating tumor cells after monoclonal antibody therapy

Nuray Gül et al. J Clin Invest. 2014 Feb.

Abstract

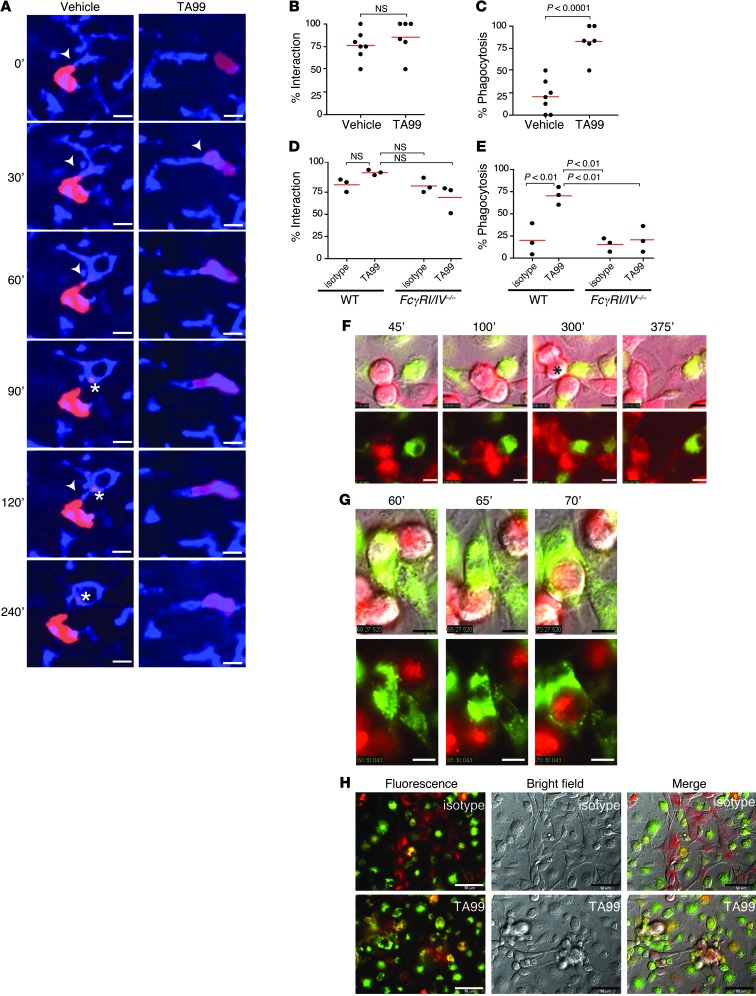
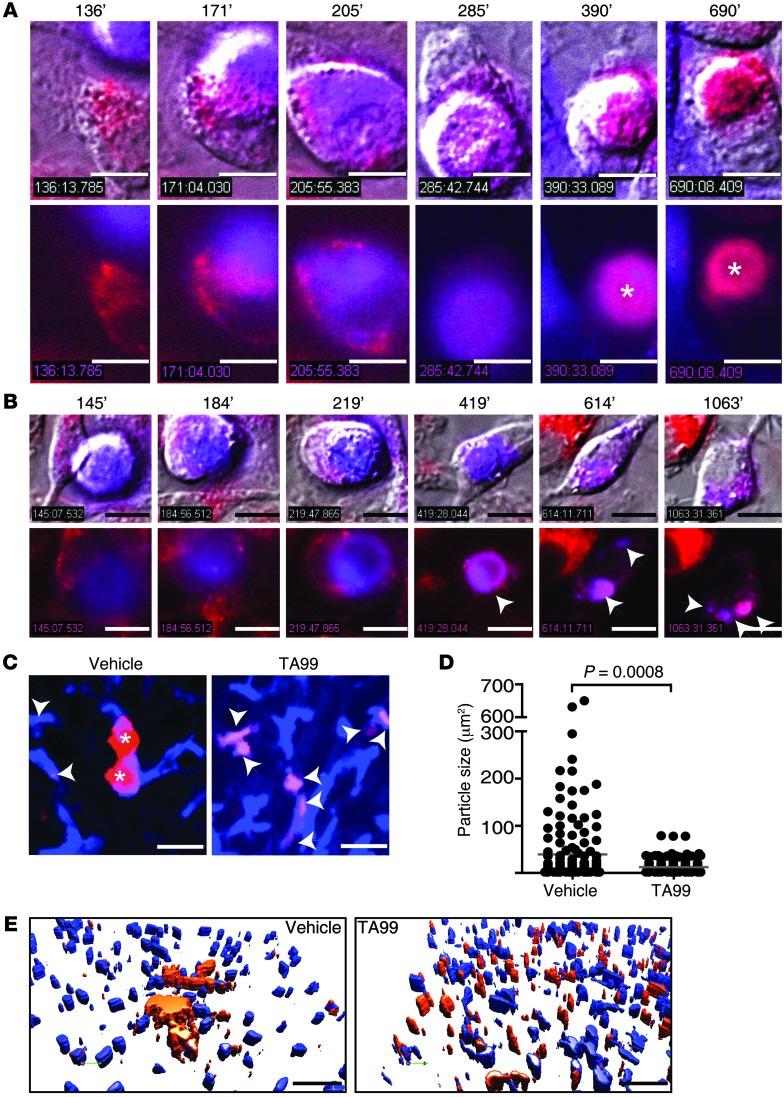
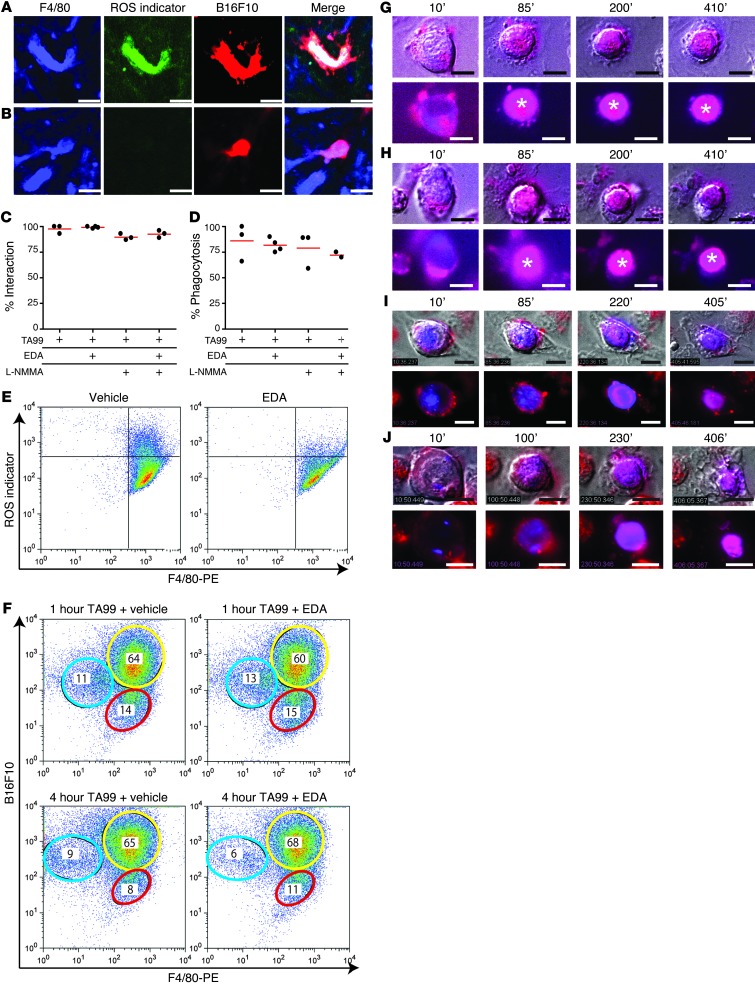
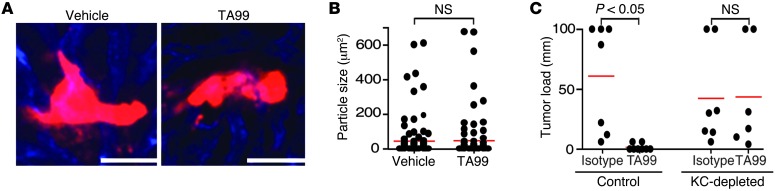
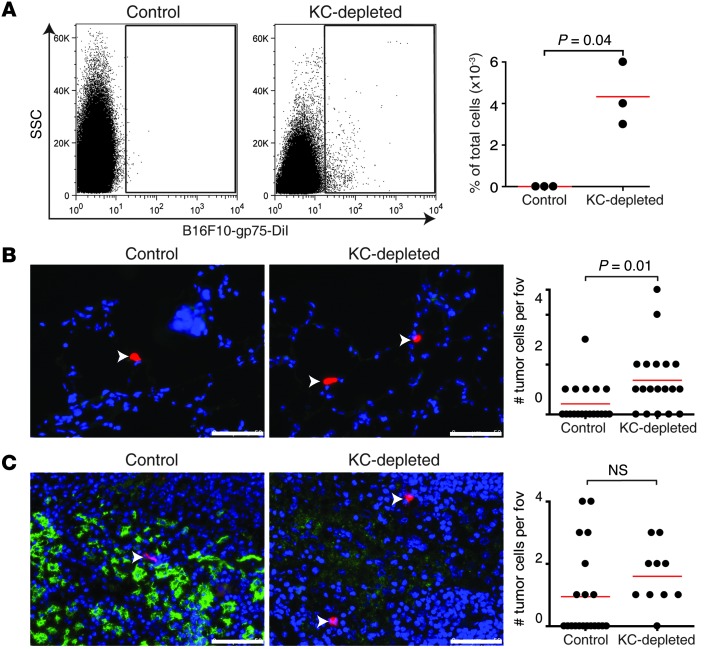
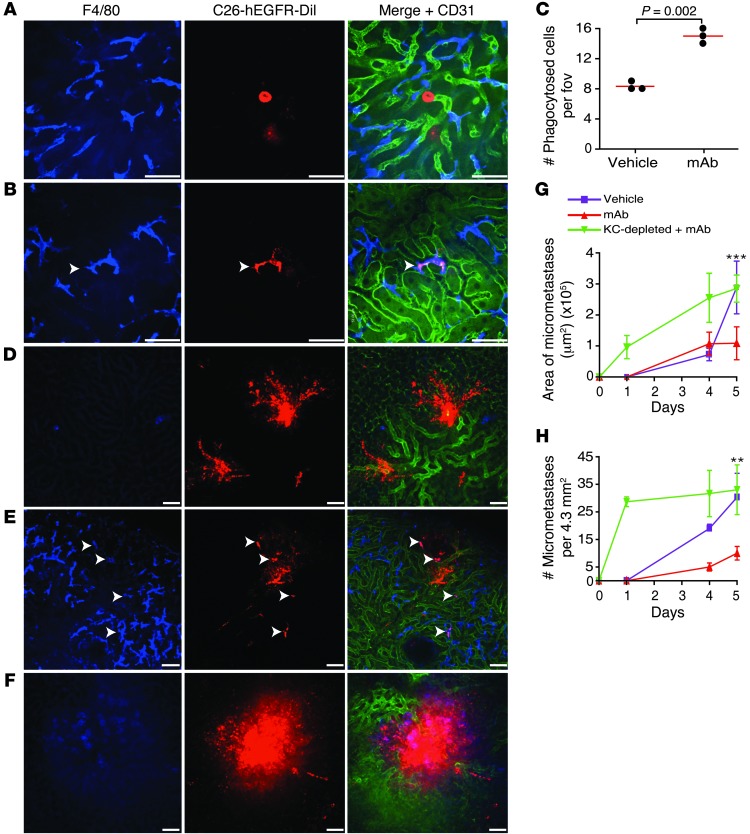
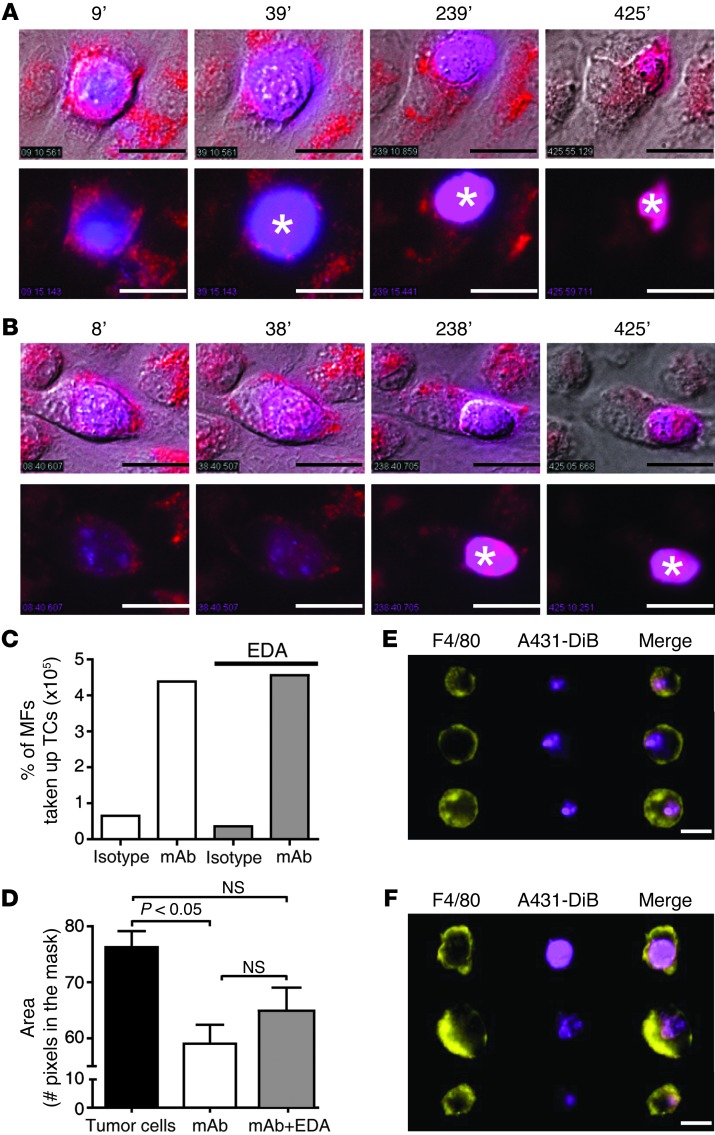
The use of monoclonal antibodies (mAbs) as therapeutic tools has increased dramatically in the last decade and is now one of the mainstream strategies to treat cancer. Nonetheless, it is still not completely understood how mAbs mediate tumor cell elimination or the effector cells that are involved. Using intravital microscopy, we found that antibody-dependent phagocytosis (ADPh) by macrophages is a prominent mechanism for removal of tumor cells from the circulation in a murine tumor cell opsonization model. Tumor cells were rapidly recognized and arrested by liver macrophages (Kupffer cells). In the absence of mAbs, Kupffer cells sampled tumor cells; however, this sampling was not sufficient for elimination. By contrast, antitumor mAb treatment resulted in rapid phagocytosis of tumor cells by Kupffer cells that was dependent on the high-affinity IgG-binding Fc receptor (FcγRI) and the low-affinity IgG-binding Fc receptor (FcγRIV). Uptake and intracellular degradation were independent of reactive oxygen or nitrogen species production. Importantly, ADPh prevented the development of liver metastases. Tumor cell capture and therapeutic efficacy were lost after Kupffer cell depletion. Our data indicate that macrophages play a prominent role in mAb-mediated eradication of tumor cells. These findings may help to optimize mAb therapeutic strategies for patients with cancer by helping us to aim to enhance macrophage recruitment and activity.


Figures

Figure 1
Figure 1. Opsonization with specific mAbs results in rapid phagocytosis of tumor cells by macrophages.
(A) Intravital microscopy images in time series (minutes) of B16F10 cells (red) and Kupffer cells (blue) in livers of mice that were treated with either vehicle or TA99 mAbs. Arrowheads indicate contact sites between Kupffer cells and tumor cells. Asterisks indicate uptake of small tumor cell particles. Scale bar: 25 μm. (B) Percentage of B16F10 tumor cells that interact with Kupffer cells. (C) Percentage phagocytosis of B16F10 tumor cells by Kupffer cells. (D) Percentage of B16F10 tumor cells that interact with Kupffer cells in wild-type mice or FcγRI/IV–/– mice. (E) Percentage phagocytosis of B16F10 tumor cells by Kupffer cells in wild-type mice or FcγRI/IV–/– mice. (F and G) In vitro live-cell microscopy of DiO-labeled (green) macrophages and DiI-labeled (red) B16F10 cells in the presence of (F) isotype or (G) TA99. Scale bar: 10 μm. Time points are indicated (minutes). The asterisk in F indicates tumor cell division. (H) In vitro microscopy images after 24 hours. Scale bar: 50 μm. Data are representative of at least 3 independent experiments.
Figure 2
Figure 2. Rapid phagocytosis of mAb-opsonized tumor cells by macrophages is followed by slow degradation.
(A and B) Phagocytosis of DiB-labeled (blue) B16F10gp75 cells by (A) LysoID-labeled (red) or (B) DiI-labeled (red) macrophages in the presence of TA99 mAb. Asterisks in A indicate the phagolysosome (red dye intensifies at lower pH). Arrowheads in B indicate degraded tumor cell particles within macrophages. Time points are indicated (minutes). The top rows show overlay of bright field and fluorescence, and the bottom rows show fluorescence only. Scale bar: 10 μm. (C) Kupffer cells (blue) and B16F10 cells (red) observed in vivo by intravital microscopy 24 hours after injection of tumor cells in livers of vehicle- or TA99-treated mice. Scale bar: 25 μm. Arrowheads indicate tumor cell particles within Kupffer cells. Asterisks indicate whole tumor cells. (D) Size of tumor cell particles in livers of vehicle- or TA99-treated mice. (E) 3D reconstruction of Kupffer cells (blue) and B16F10 cells (red) in vehicle- or TA99-treated mice. Colors are artificial. Scale bar: 50 μm. Data are representative of 3 independent experiments.
Figure 3
Figure 3. ROS or RNS are not required for ADPh.
(A and B) Formation of ROS after ADPh of opsonized tumor cells by Kupffer cells in livers of mice treated with (A) TA99 or (B) TA99, EDA, and L-NMMA. Scale bar: 25 μm. (C) Percentage of tumor cells interacting with Kupffer cells and (D) percentage phagocytosis of tumor cells by Kupffer cells in the livers of mice that were treated with TA99, TA99 and EDA, TA99 and L-NMMA, or TA99, EDA, and L-NMMA. (E) ROS production by macrophages after stimulation with 50 μg/ml peptidoglycan with and without EDA. Gates in the top right corners indicate ROS-producing macrophages. (F) Macrophages were incubated for 1 or 4 hours with B16F10-DiB cells and TA99 in the absence or presence of EDA. Macrophages were stained with F4/80-PE. Yellow circles denote double-positive cells (indicative of phagocytosis); red circles denote F4/80-PE+ macrophages; and blue circles denote nonphagocytosed B16F10-DiB cells. Numbers indicate percentage of total cells. (GJ) Phagocytosis of DiB-labeled (blue) B16F10gp75 cells by (G and H) LysoID-labeled (red) or (I and J) DiI-labeled (red) macrophages in the presence of (G and I) TA99 or (H and J) TA99 and EDA. Asterisks in G and H indicate the phagolysosome. Time points are indicated (minutes). The top rows show overlay of bright field and fluorescence, and the bottom rows show fluorescence only. Scale bar: 10 μm.
Figure 4
Figure 4. Kupffer cells are the main effector cells in mAb-mediated elimination of tumor cells.
(A) B16F10 cells (red) 24 hours after treatment with either vehicle or TA99 in livers of Kupffer cell–depleted mice visualized by intravital microcopy. Scale bar: 50 μm. (B) Size of tumor cell particles 24 hours after vehicle or TA99 treatment in Kupffer cell–depleted mice. (C) Liver metastases development after 3 weeks in control or Kupffer cell–depleted mice that were treated with isotype control or TA99 antibody. Data are representative of 3 independent experiments. KC, Kupffer cell.
Figure 5
Figure 5. Kupffer cells are essential in arresting tumor cells in the liver after TA99 mAb therapy.
(A) Representative FACS scatter plots of circulating tumor cells in control or Kupffer cell–depleted mice after TA99 mAb therapy and quantification of tumor cells in blood from control and Kupffer cell–depleted mice. SSC, side scatter. (B and C) Representative images from (B) lungs and (C) spleens of control and Kupffer cell–depleted mice and quantification of numbers of tumor cells per field of view (fov). Arrowheads indicate red tumor cells. Blue, cell nuclei; red, B16F10; green, F4/80+ macrophages. (Note that alveolar macrophages express very low levels of F4/80; ref. .) Scale bar: 50 μm.
Figure 6
Figure 6. Anti-EGFR mAbs reduce outgrowth of C26-hEGFR liver metastases.
(AD) Kupffer cell–dependent phagocytosis of tumor cells in sinusoids of the liver 1 day after inoculation. Representative images of livers (A) in mice receiving vehicle or (B and D) anti-EGFR mAb–opsonized C26-hEGFR cells and (D) in Kupffer cell–depleted mice. (C) Number of phagocytosed tumor cells per field of view in livers of mice that received vehicle or anti-EGFR mAb–opsonized C26-hEGFR cells. (EH) Reduced formation of micrometastases and outgrowth in the livers of mice is Kupffer cell dependent. (E and F) Representative images from livers of (E) control or (F) Kupffer cell–depleted mice, which received anti-hEGFR mAb–opsonized C26-hEGFR cells, 4 days after injection of tumor cells. (G and H) Area and number of micrometastases in livers of control or Kupffer cell–depleted mice, which were either injected with vehicle or anti-EGFR mAb–coated tumor cells. Arrowheads indicate uptake of tumor cells by Kupffer cells. Blue, F4/80+ Kupffer cells; red, C26-hEGFR-DiI; green, CD31. Scale bar: 50 mm. **P < 0.01, ***P < 0.001 vehicle vs. anti-EGFR mAbs.
Figure 7
Figure 7. Anti-EGFR mAbs induce ADPh of human epithelial carcinoma A431 cells by macrophages.
(A and B) Phagocytosis of DiB-labeled (blue) B16F10gp75 cells by LysoID-labeled (red) macrophages in the presence of (A) anti-EGFR mAbs or (B) anti-EGFR mAbs and EDA. Asterisks indicate the phagolysosome. The top rows show overlay of bright field and fluorescence, and the bottom rows show fluorescence only. Scale bar: 20 μm. (C) Percentage of macrophages that have phagocytosed A431 cells in the presence of an isotype or anti-EGFR mAb with or without EDA. MF, macrophage; TC, tumor cell. (D) Quantification of tumor cell size. (E and F) Representative images of anti-EGFR mAb–opsonized A431 tumor cells that have been phagocytosed and degraded by (E) control macrophages or (F) EDA-treated macrophages. Scale bar: 14 μm.

References

    1. Scott AM, Wolchok JD, Old LJ. Antibody therapy of cancer. Nat Rev Cancer. 2012;12(4):278–287. doi: 10.1038/nrc3236. - DOI - PubMed
    1. Weiner LM, Surana R, Wang S. Monoclonal antibodies: versatile platforms for cancer immunotherapy. Nat Rev Immunol. 2010;10(5):317–327. doi: 10.1038/nri2744. - DOI - PMC - PubMed
    1. Amoroso A, et al. Understanding rituximab function and resistance: implications for tailored therapy. Front Biosci. 2011;16:770–782. doi: 10.2741/3719. - DOI - PubMed
    1. Hogarth PM, Pietersz GA. Fc receptor-targeted therapies for the treatment of inflammation, cancer and beyond. Nat Rev Drug Discov. 2012;11(4):311–331. - PubMed
    1. Weiner LM, Murray JC, Shuptrine CW. Antibody-based immunotherapy of cancer. Cell. 2012;148(6):1081–1084. doi: 10.1016/j.cell.2012.02.034. - DOI - PMC - PubMed

Publication types

MeSH terms