. 2014:5:3168.
doi: 10.1038/ncomms4168.

Mitochondrial reactive oxygen species regulate the strength of inhibitory GABA-mediated synaptic transmission

Affiliations

Mitochondrial reactive oxygen species regulate the strength of inhibitory GABA-mediated synaptic transmission

Michael V Accardi et al. Nat Commun. 2014.

Abstract

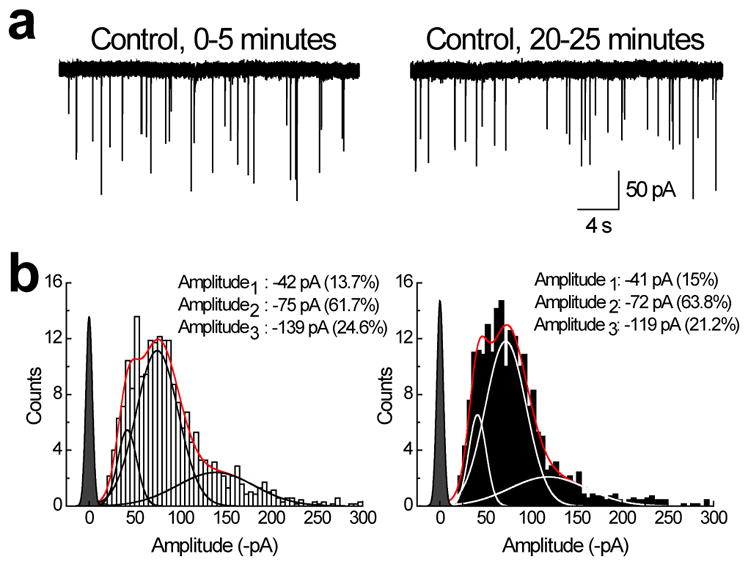
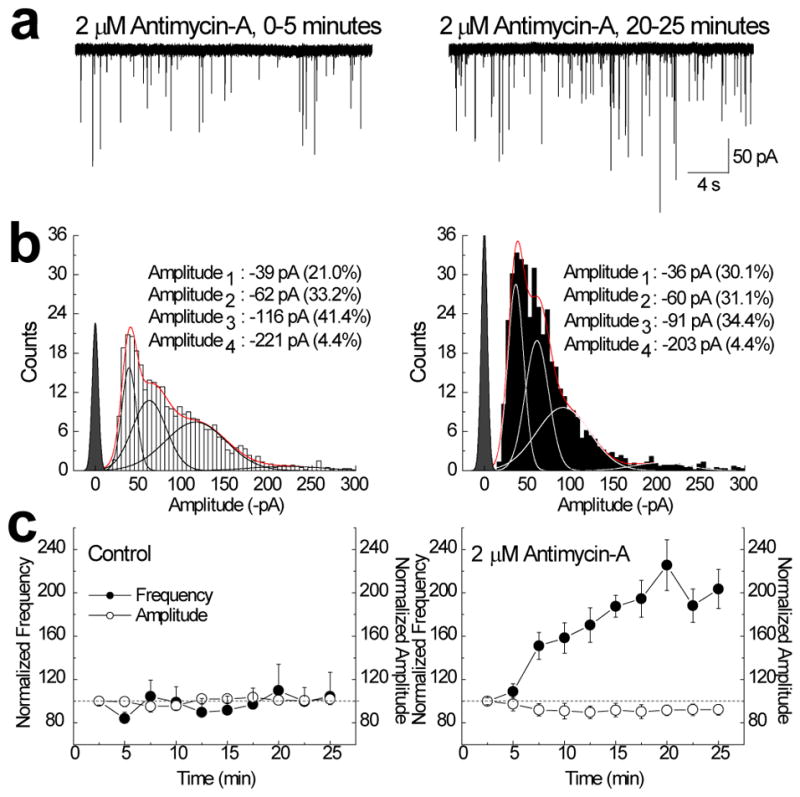
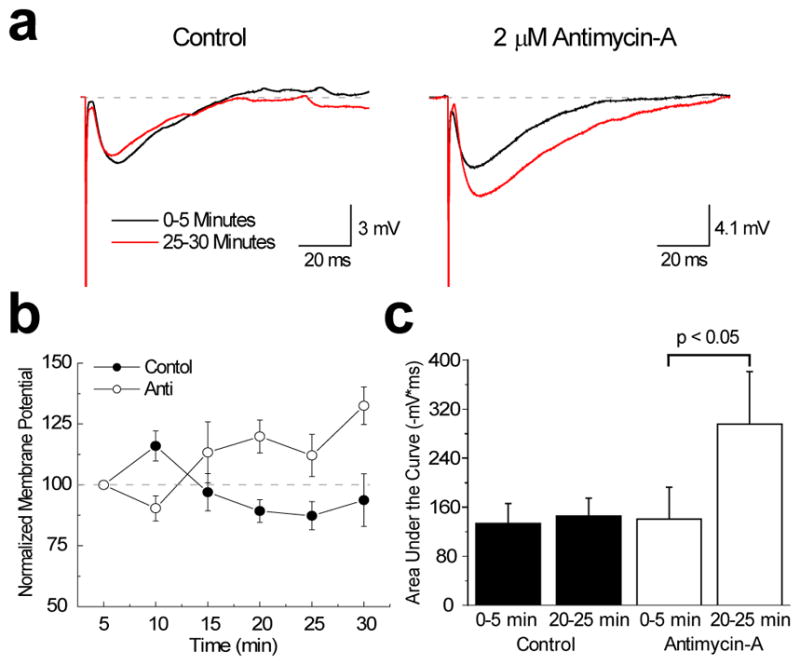
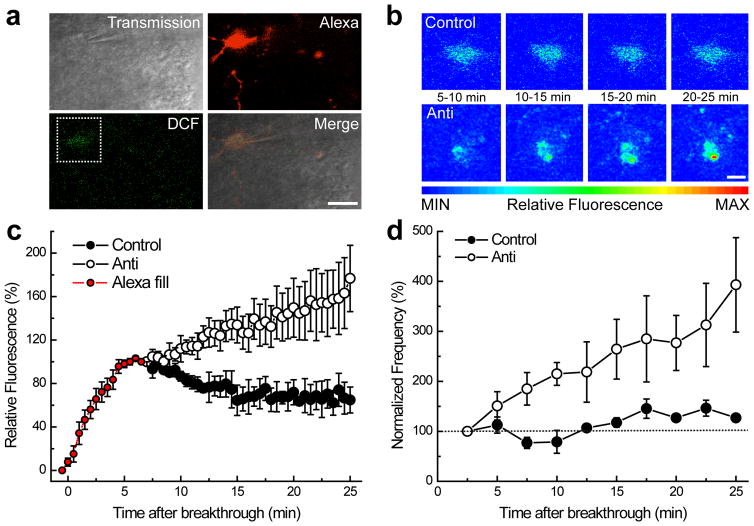
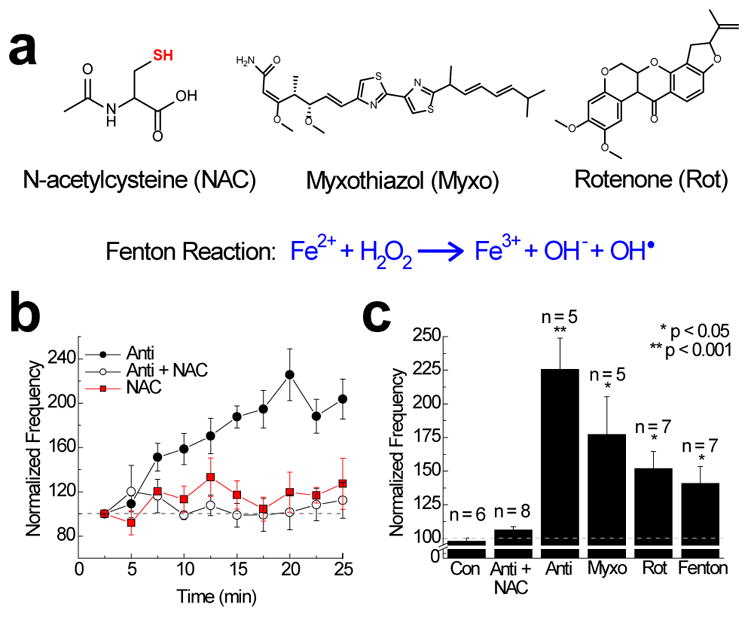
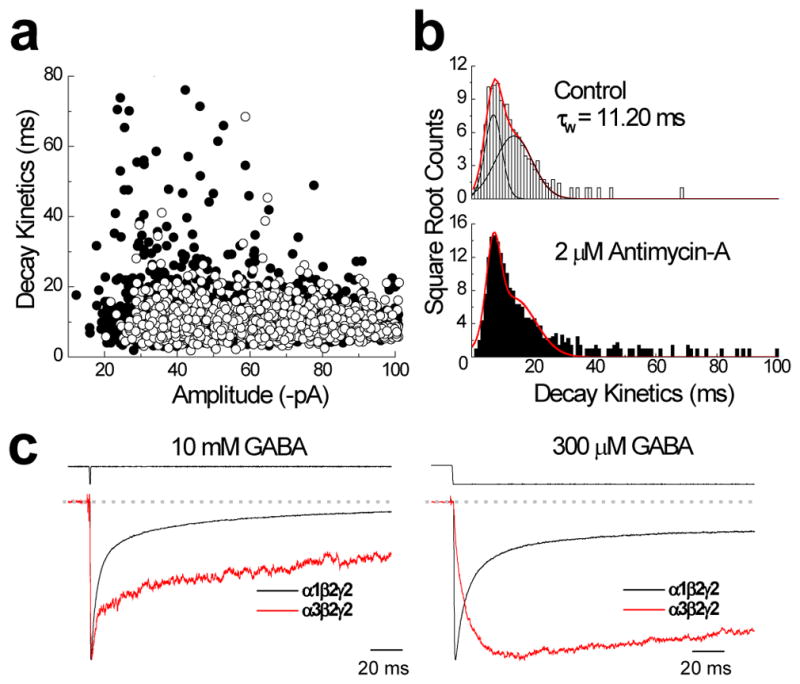
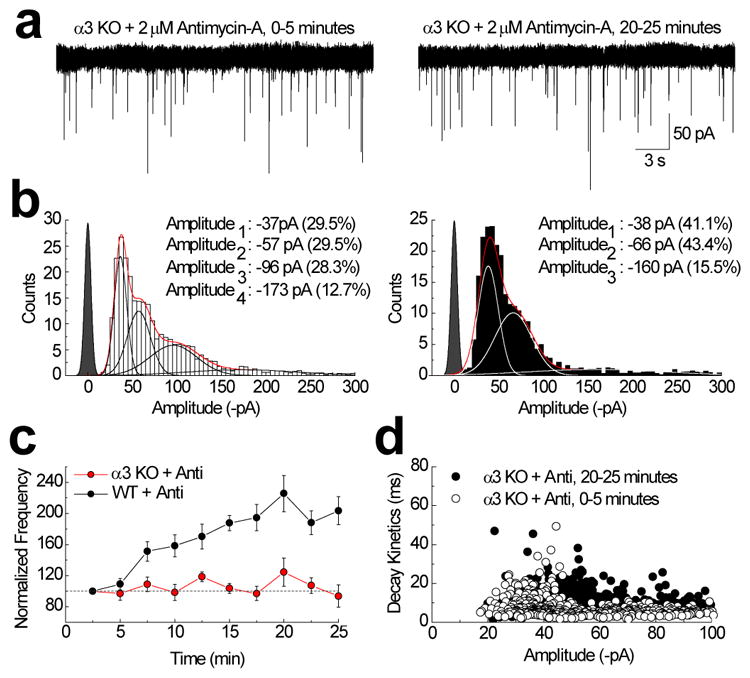
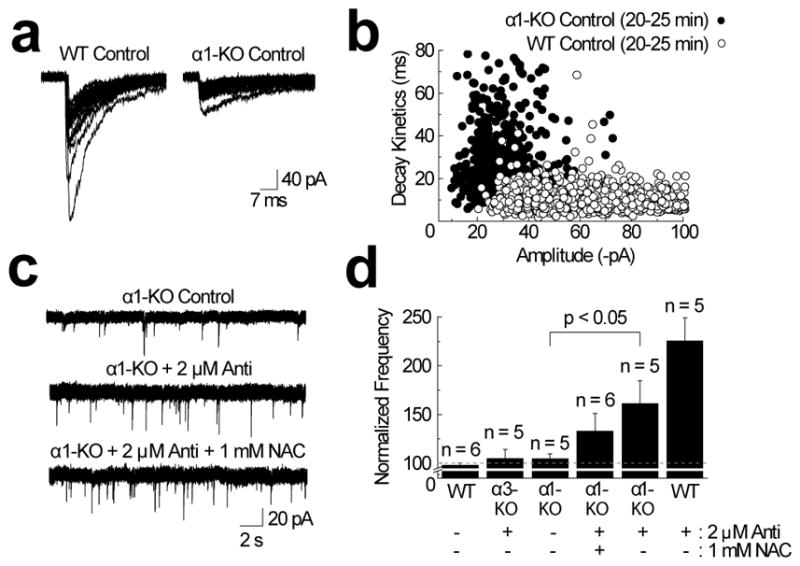
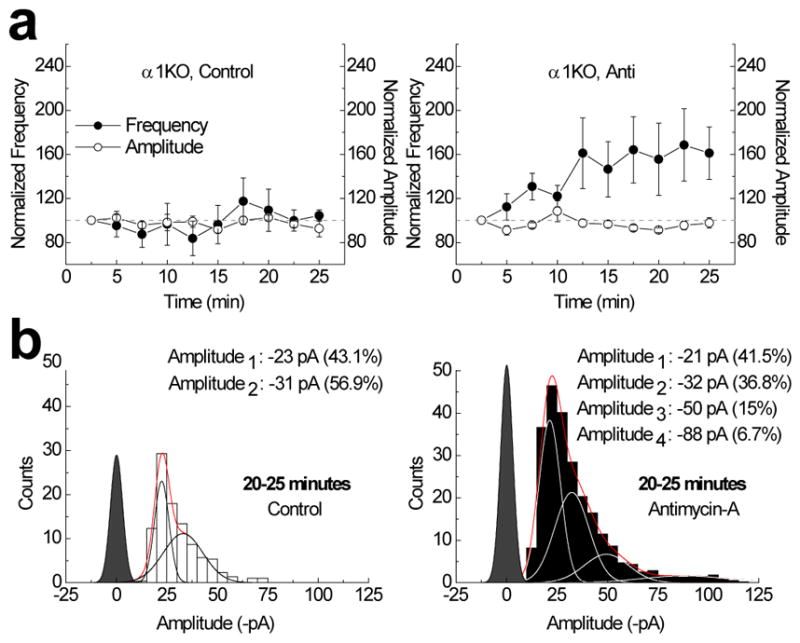
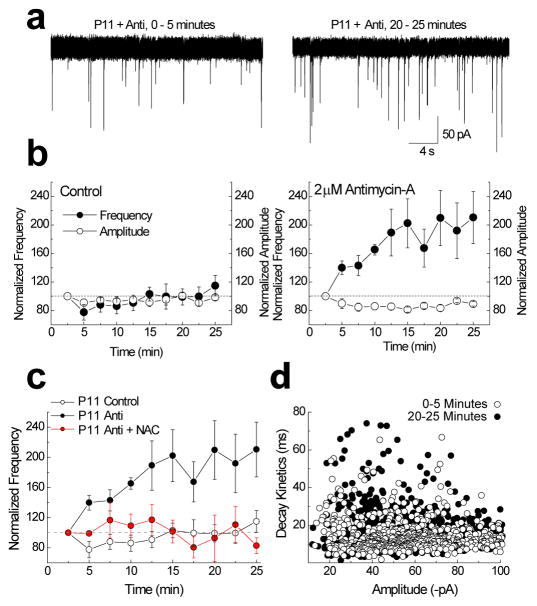
Neuronal communication imposes a heavy metabolic burden in maintaining ionic gradients essential for action potential firing and synaptic signalling. Although cellular metabolism is known to regulate excitatory neurotransmission, it is still unclear whether the brain's energy supply affects inhibitory signalling. Here we show that mitochondrial-derived reactive oxygen species (mROS) regulate the strength of postsynaptic GABA(A) receptors at inhibitory synapses of cerebellar stellate cells. Inhibition is strengthened through a mechanism that selectively recruits α3-containing GABA(A) receptors into synapses with no discernible effect on resident α1-containing receptors. Since mROS promotes the emergence of postsynaptic events with unique kinetic properties, we conclude that newly recruited α3-containing GABA(A) receptors are activated by neurotransmitter released onto discrete postsynaptic sites. Although traditionally associated with oxidative stress in neurodegenerative disease, our data identify mROS as a putative homeostatic signalling molecule coupling cellular metabolism to the strength of inhibitory transmission.


Conflict of interest statement

Competing Financial Interests. The authors declare no competing financial interests

Figures

Figure 1
Figure 1. Inhibitory transmission onto cerebellar stellate cells is stable
(a) mIPSCs recorded from the same stellate cell (cell # 120202p2) at two time periods showing that event amplitude and frequency were similar throughout. (b) Amplitude distributions of inhibitory events from stellate cell recordings (n = 6) comparing early (i.e. 0–5 minutes) and later (i.e. 20–25 minutes) events. Averaged data has been fit with the sum of 3 Gaussian functions (red line) with individual Gaussians shown in either black (left panel) or white (right panel). In this figure and other figures, closed point distribution (filled) has been scaled to the fitted peak of the lowest event amplitude and represents the average noise observed during the recordings.
Figure 2
Figure 2. Antimycin-A selectively enhances the occurrence of small amplitude inhibitory events
(a) mIPSCs from the same stellate cell (cell # 111118p1) at two time periods in the presence of 2 μM antimycin-A. (b) Amplitude histograms comparing the data obtained at two time periods (0–5 minutes, left; 20–25 minutes, right) following the introduction of 2 μM antimycin-A (n = 5). Averaged data has been fit with the sum of 4 Gaussian functions (red line) with individual Gaussians shown in either black (left panel) or white (right panel). (c) Summary plot showing how normalized small event (i.e. < −100 pA) amplitude (open circle) or frequency (filled circle) changed with time in the presence (n = 5) and absence (n = 6) of antimycin-A. Error bars, s.e.m. For clarity, the lower (frequency) and upper (amplitude) error bars were removed in the control panel (left).
Figure 3
Figure 3. Antimycin-A increases the amplitude of eIPSPs in the presence of physiological levels of chloride
(a) eIPSPs obtained in the presence (right) or absence (left) of 2 μM antimycin-A while cytosolic levels of chloride where maintained at physiological levels (i.e. [Cl]I = 4.5 mM). The black traces represent the average response during the first 5 minutes (i.e. 0–5 minutes). The red traces represent the average response during the last 5 minutes (i.e. 25–30 minutes). (b) Summary plot showing the change of normalized membrane potentials of eIPSPs in the presence (white circle; n = 5) or absence (black circle; n = 3) of 2 μM antimycin-A (Anti). (c) Summary bar graph comparing the change in the area under the curve for the control and 2 μM antimycin-A condition at two time points. When compared to the first 5 minutes (0–5 min), antimycin-A elicits a significant increase (P = 0.043, paired two-tailed Student’s t-test) in total area under the curve.
Figure 4
Figure 4. Simultaneous fluorescence and electrophysiological measurements confirm that Antimycin-A increases intracellular ROS
(a) Representative scanning confocal images of a stellate cell loaded via the recording pipette with 100 μM Alexa 594 to assess the extent of cell filling and 100 μM H2DCF-DA (DCF) to measure increases in intracellular ROS. The inset is the area depicted in panel b (Control) at 2 min after breakthrough. Scale bar, 10 μm. (b) Example DCF images from two separate experiments in the absence (Control) and presence of Antimycin-A (Anti) in the recording pipette. The images are displayed using a range indicator from blue, pixels with no fluorescence, to red, the maximum signal for any pixel over the course of an individual experiment. Scale bar, 5 μm (c) The time course of mean intracellular DCF fluorescence in control (n = 3) and Antimycin-A (n = 4) experiments. Fluorescence was normalized based on the time it took to acquire a stable Alexa signal (5–7 min, Alexa fill). Error bars, s.e.m. (d) Normalized mean frequency time course of small amplitude mIPSCs (<100 pA) recorded concomitantly from the same cells in panel c. Error bars, s.e.m
Figure 5
Figure 5. Mitochondrial ROS increases the occurrence of small inhibitory events
(a) N-acetylcysteine (NAC), myxothiazol (Myxo), rotenone (Rot) structures as well as the Fenton reaction. The thiol group (highlighted in red) of NAC confers antioxidant properties. (b) Summary plot of antagonistic effect of NAC on the increase in small event frequency elicited by antimycin-A (2 μM Anti, n = 5; 2 μM Anti + 1 mM NAC, n = 8 and 1 mM NAC, n = 5). Error bars, s.e.m. (c) Summary bar graph comparing the normalized small event frequency (i.e. < −100 pA) in different experimental conditions. When compared to control conditions (Con), the increase in event frequency observed with 2 μM antimycin-A (n = 5, P = 0.0002), 5 μM myxothiazol (n = 5, P = 0.0123), 2 μM rotenone (n = 7, P = 0.0028) and the Fenton reaction (n = 7, P = 0.0072) all reached statistical significance. All statistics were determined using an unpaired, two-tailed Student’s t-test with Bonferroni correction. Error bars, s.e.m.
Figure 6
Figure 6. Slow mIPSCs and recombinant α3-GABAA receptors have similar kinetics
(a) Plot of mIPSC amplitude and decay kinetics of small amplitude (i.e. < −100 pA) events observed in control (white circles, n = 6) or 2 μM antimycin-A (black circles, n = 5) conditions. (b, upper panel) Histograms showing the distribution of mIPSC decay kinetics fit with the sum of 2 Gaussian functions (red line). Individual Gaussians are shown in black. (b, lower panel) Similar plot of the distribution of decay kinetics observed in the presence of antimycin-A. The Gaussian fit (red line) from the upper panel has been scaled onto the data to identify the many more slow-decaying mIPSCs observed with antimycin-A exposure. (c) Overlay of typical membrane currents elicited by short 1 ms (left) or long 250 ms (right) applications of 10 mM or 300 μM GABA acting on recombinant α1β2γ2 (black line, patch # 130322p7) or α3β2γ2 (red line, patch # 130308p3) receptors. Response amplitudes have been normalized to allow a comparison of decay kinetics.
Figure 7
Figure 7. Mitochondrial ROS does not strengthen inhibitory synapses lacking the α3 subunit
(a) mIPSCs recorded from the same stellate cell (cell # 121130p1) in a α3 null mouse during internal perfusion with 2 μM Antimycin-A. (b) Amplitude histograms comparing data (n = 5) obtained at two time periods (i.e. 0–5 minutes, left; 20–25 minutes, right). Pooled data has been fit with the sum of 3–4 Gaussian functions (red line) with individual Gaussians shown in either black (left panel) or white (right panel). (c) Summary plot comparing the effect of antimycin-A on small amplitude event frequency in wild-type (n = 6) and α3-KO (n = 5) mice. Error bars, s.e.m. (d) Scatter plot comparing decay kinetics and mIPSC amplitudes at two time points in stellate cells from α3-null mice (n = 5).
Figure 8
Figure 8. Mitochondrial ROS increases mIPSC frequency in stellate cells lacking the α1-subunit
(a) Comparison of fifteen randomly-selected mIPSCs recorded in wild-type (left) and α1-KO (right) stellate cells. (b) Scatter plot comparing decay kinetics and amplitudes of mIPSCs from stellate cells in wild-type (n = 6) and α1-null mice (n = 5). (c) Representative mIPSCs showing the effect of internal perfusion with 2 μM antimycin-A (top trace, cell # 121025p2; middle trace, cell # 121016p1 and bottom trace, cell #121206p1). (d) Bar graph summarizing the effect of antimycin-A on mIPSC frequency in wild-type and α1-KO cells. Statistics were determined using an unpaired, two-tailed Student’s t-test; P = 0.0484. Error bars, s.e.m.
Figure 9
Figure 9. ROS increases mIPSC frequency and amplitude in α1-KO mice
(a and b) Summary plots comparing mIPSC frequency and amplitude (i.e. < −100 pA) in α1-KO mice in the presence (right, n = 5) and absence (left, n = 5) of 2 μM antimycin-A. Error bars, s.e.m. (b) Amplitude distributions of mIPSCs observed during the last 5 minutes (i.e. 20–25 minutes) of stellate cell recordings from α1-KO mice both in the presence (right) and absence (left) of 2 μM antimycin-A. Averaged data has been fit with the sum of 2 or 4 Gaussian functions (red line) with individual Gaussians shown in either black (left panel) or white (right panel).
Figure 10
Figure 10. Antimycin-A increases the occurrence of small inhibitory events during early stellate cell development
(a) mIPSCs from the same stellate cell (cell # 138050p3) at two time periods in the presence of 2 μM antimycin-A (Anti). (b)Summary plot showing how normalized small event (i.e. < −100 pA) amplitude (open circle) or frequency (filled circle) changed with time in the presence (n = 7) and absence (n = 8) of antimycin-A. Error bars, s.e.m. (c) Summary plot showing the time-course of the small mIPSC frequency increase elicited by 2 μM antimycin-A (Anti, black circle) and the antagonistic effect of N-acetylcysteine (NAC, red circle, n = 7). The control condition (white circle) did not change over time. Error bars, s.e.m. (d) Plot of mIPSC amplitude and decay kinetics of small amplitude (i.e. < −100 pA) events observed in the first (i.e. 0–5 minutes, white circles) and last (i.e. 20–25 minutes, black circles) 5 minutes of young (P11) mice in the presence of 2 μM antimycin-A.

Similar articles

Cited by

References

    1. Ames A., III CNS energy metabolism as related to function. Brain Res Brain Res Rev. 2000;34:42–68. - PubMed
    1. Attwell D, Laughlin SB. An energy budget for signaling in the grey matter of the brain. J Cereb Blood Flow Metab. 2001;21:1133–1145. - PubMed
    1. Navarrete A, van Schaik CP, Isler K. Energetics and the evolution of human brain size. Nature. 2011;480:91–93. - PubMed
    1. Mitchison G. Axonal trees and cortical architecture. Trends Neurosci. 1992;15:122–126. - PubMed
    1. Levy WB, Baxter RA. Energy efficient neural codes. Neural Comput. 1996;8:531–543. - PubMed

Publication types

Grants and funding

LinkOut - more resources