. 2014 Mar;25(6):936-47.
doi: 10.1091/mbc.E13-08-0502. Epub 2014 Jan 15.

SLC25A23 augments mitochondrial Ca²⁺ uptake, interacts with MCU, and induces oxidative stress-mediated cell death

Affiliations

SLC25A23 augments mitochondrial Ca²⁺ uptake, interacts with MCU, and induces oxidative stress-mediated cell death

Nicholas E Hoffman et al. Mol Biol Cell. 2014 Mar.

Abstract

Emerging findings suggest that two lineages of mitochondrial Ca(2+) uptake participate during active and resting states: 1) the major eukaryotic membrane potential-dependent mitochondrial Ca(2+) uniporter and 2) the evolutionarily conserved exchangers and solute carriers, which are also involved in ion transport. Although the influx of Ca(2+) across the inner mitochondrial membrane maintains metabolic functions and cell death signal transduction, the mechanisms that regulate mitochondrial Ca(2+) accumulation are unclear. Solute carriers--solute carrier 25A23 (SLC25A23), SLC25A24, and SLC25A25--represent a family of EF-hand-containing mitochondrial proteins that transport Mg-ATP/Pi across the inner membrane. RNA interference-mediated knockdown of SLC25A23 but not SLC25A24 and SLC25A25 decreases mitochondrial Ca(2+) uptake and reduces cytosolic Ca(2+) clearance after histamine stimulation. Ectopic expression of SLC25A23 EF-hand-domain mutants exhibits a dominant-negative phenotype of reduced mitochondrial Ca(2+) uptake. In addition, SLC25A23 interacts with mitochondrial Ca(2+) uniporter (MCU; CCDC109A) and MICU1 (CBARA1) while also increasing IMCU. In addition, SLC25A23 knockdown lowers basal mROS accumulation, attenuates oxidant-induced ATP decline, and reduces cell death. Further, reconstitution with short hairpin RNA-insensitive SLC25A23 cDNA restores mitochondrial Ca(2+) uptake and superoxide production. These findings indicate that SLC25A23 plays an important role in mitochondrial matrix Ca(2+) influx.


Figures

FIGURE 1:
FIGURE 1:
RNA interference–mediated silencing of SLC25A23, SLC25A24, and SLC25A25 reveals that SLC25A23 reduces mitochondrial Ca2+ uptake. (A) qRT-PCR results of SLC25A23 KD, (B) SLC25A24 KD, and (C) SLC25A25 KD clones. SLC25A23 KD clones #864 and #867 show reduced mRNA levels by 95 and 95.2%, respectively. (D) HeLa cells were stimulated with 100 μM histamine at 50 s. SLC25A23 clone 864 shRNA cytosolic Ca2+ trace (top left), mitochondrial Ca2+ trace (bottom left), and quantitation of mitochondrial rhod-2 fluorescence (right). (E) SLC25A24 clone 594 shRNA cytosolic Ca2+ trace (top left), mitochondrial Ca2+ trace (bottom left), and quantitation of mitochondrial Ca2+ uptake (right). (F) SLC25A25 clone 739 shRNA cytosolic Ca2+ trace (top left), mitochondrial Ca2+ trace (bottom left), and quantitation of mitochondrial Ca2+ uptake (right). (G) Representative image of transiently transfected HeLa cells expressing mitochondria-targeted Ca2+ indicator GCaMP2. (H) GCaMP2-mt HeLa cells were stimulated with 100 μM histamine at 60 s. SLC25A23 clone 864 mitochondrial Ca2+ trace (GCaMP2; scale 0–4096 f.a.u.). (I) SLC25A24 KD mitochondrial Ca2+ trace. (J) SLC25A25 KD mitochondrial Ca2+ trace. (K) SLC25A23 KD and Neg shRNA HeLa cells cytosolic Ca2+ clearance trace (Fluo-4; scale 0–4096 f.a.u.). (L) Quantitation of cytosolic Ca2+ clearance as area under the curve. Data are mean ± SEM (n = 3–5). *p < 0.05 compared with Neg shRNA.
FIGURE 2:
FIGURE 2:
Knockdown of SLC25A23 reduces mitochondrial Ca2+ uptake rate. (A) Average traces with mean data point for each time point plotted with SE of permeabilized (40 μg/ml digitonin) HeLa cells loaded with the ratiometric Ca2+ indicator Fura2-FF and pulsed with 10 μM Ca2+ at 350 s to measure mitochondrial Ca2+ uptake, followed by addition of 1 mM RU360 at 550 s, 10 μM CGP37157 at 610 s and 2 μM uncoupler CCCP at 750 s. SLC25A23 KD showed reduced extra mitochondrial Ca2+ clearance. (B) Zoom of Ca2+ uptake from A (between 300 and 550 s). (C) Quantitation of Ca2+ influx rate. (D) Quantitation of Ca2+ efflux rate after addition of Ru360. (E) Quantitation of CCCP-induced Ca2+ release shows no significant difference in total Ca2+. Data are mean ± SEM (n = 3). **p < 0.01 compared with Neg shRNA; n.s., not significant.
FIGURE 3:
FIGURE 3:
SLC25A23 EF-hand mutants dampen mitochondrial Ca2+ uptake. (A) Scheme depicting EF1 and EF2 mutant constructs. (B) HeLa cells were transfected with EF-hand mutants, and localization to the mitochondria was visualized with mitochondrial indicator TMRE. (C) EF1 and EF2 mutants show decreased mitochondrial Ca2+ uptake assessed by confocal imaging after histamine stimulation. (D) Quantitation of mitochondrial Ca2+ peak uptake using mitochondrial Ca2+ indicator Rhod-2 AM. Data are mean ± SEM (n = 3). *p < 0.05 compared with Neg shRNA.
FIGURE 4:
FIGURE 4:
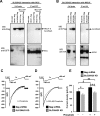
SLC25A23 interacts with MCU and MICU1 and modulates IMCU. (A) Stably MCU-GFP–expressing COS7 cells were transfected with Flag-tagged, full-length MICU1 or SLC25A23. After immunoprecipitation with GFP antibody, total cell lysates and immunoprecipitated materials were subjected to Western blot analysis. Cell lysates were probed with anti-Flag (top left) or anti-GFP antibodies (bottom left) to serve as inputs. Immunoprecipitated samples were probed with anti-Flag (top right) or anti-GFP antibodies (bottom right). Anti-GFP antibodies coimmunoprecipitate full-length MICU1 and SLC25A23. n = 3. (B) Stably MICU1-HA–expressing COS7 cells were transfected with Flag-tagged SLC25A23. After immunoprecipitation with HA antibody, total cell lysates and immunoprecipitated materials were subjected to Western blot analysis. Cell lysates were probed with anti-Flag (top left) or anti-HA antibodies (bottom left) to serve as inputs. Immunoprecipitated samples were probed with anti-Flag (top right) or anti-HA antibodies (bottom right). Anti-HA antibodies to MICU1-HA coimmunoprecipitate Flag-tagged SLC25A23. n = 3. (C) Mitoplast current (IMCU) from HeLa cells was recorded before and after application of 5 mM Ca2+ to the bath medium. Currents were measured during a voltage ramp as indicated. Traces are a representative single recording of IMCU from Neg shRNA (black) and SLC25A23 KD (gray). n = 5 or 6. (D) Traces are a representative single recording of IMCU. The IMCU was recorded in the presence of 5 mM Ca2+ and 300 μM Pi in Neg shRNA (black) and SLC25A23 KD (gray). n = 6. (E) IMCU densities (pA/pF) for Neg shRNA (black) and SLC25A23 KD (gray). Mean ± SEM; *p < 0.05, ***p < 0.001; ns, not significant; n = 5 or 6.
FIGURE 5:
FIGURE 5:
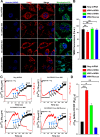
SLC25A23 knockdown prevents mitochondrial Ca2+ uptake and subsequently preserves ΔΨm. (A) Mitochondrial morphology and ΔΨm was assessed by confocal microscopy using TMRE and rhodamine 123. Hoechst 33342 was used as a nuclear marker. (B) Quantitation of confocal TMRE fluorescence. (C) Representative traces of permeabilized (40 μg/ml digitonin) HeLa cells loaded with the ratiometric Ca2+ indicator Fura-2FF and ratiometric ΔΨm fluorophore JC-1 and pulsed with 10 μM Ca2+ to trigger ΔΨm loss, followed by addition of the uncoupler CCCP (1 μM). ΔΨm loss was similar between Neg shRNA control and partial knockdown clone 863. Clone 864 shows abrogated ΔΨm loss after six Ca2+ pulses, and the first pulse is not completely cleared from the cytosol. (D) Quantitation after the addition of the uncoupler CCCP shows ΔΨm preservation in clone 864. Data are mean ± SEM (n = 3–5). *p < 0.05, **p < 0.01, and ns, not significant compared with Neg shRNA.
FIGURE 6:
FIGURE 6:
Knockdown of SLC25A23 lowers basal mitochondrial ROS production. (A) HeLa cells were transfected with mito-GFP (green), and cells were immunostained with anti-DNA antibody (red). Images were acquired using a Zeiss LSM 710 META NLO imaging system. Representative images of Neg shRNA (top), clone 863 (middle), and clone 864 (bottom). (B) Quantitation of total mitochondrial anti-DNA spots per cell as determined by ImageJ Particle Analyzer counting all resolvable (>0.37 μm) binary-colored particles. (C) HeLa cells were loaded with the mitochondrial superoxide indicator MitoSOX Red and the nuclear marker Hoechst 33342. (D) Quantitation of MitoSOX Red fluorescence. (E) HeLa cells were loaded with the reduced glutathione indicator monochlorobimane (mBCl) and imaged using a Zeiss LSM 510 with 405-nm excitation. (F) Quantitation of mBCl-GSH fluorescence. Data are mean ± SEM (n = 3). *p < 0.05, **p < 0.01, ***p < 0.001 compared with #864 shRNA or Neg shRNA.
FIGURE 7:
FIGURE 7:
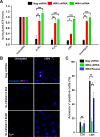
Knockdown of SLC25A23 preserves cellular ATP levels and cell viability. (A) Knock­down of SLC25A23 preserves ATP levels after oxidant challenge. HeLa cells (Neg shRNA, 863, and 864) were challenged with superoxide generation system (xanthine + xanthine oxidase), hydrogen peroxide (H2O2), t-butyl hydroperoxide, or ionomycin. After 6 h, cellular ATP levels were assessed using the CellTiter-Glo Luminescent kit. (B) HeLa cells (Neg shRNA, #863, and #864) were treated with t-butyl hydroperoxide for 6 h and then stained with the cell death markers annexin V and propidium iodide. (C) Quantitation of annexin V–positive staining. Data are mean ± SEM (n = 3). *p < 0.05, **p < 0.01, and ***p < 0.001, and ns, not significant compared with Neg shRNA or #864 shRNA.

References

    1. Amigo I, Traba J, Gonzalez-Barroso MM, Rueda CB, Fernandez M, Rial E, Sanchez A, Satrustegui J, Del Arco A. Glucagon regulation of oxidative phosphorylation requires an increase in matrix adenine nucleotide content through Ca2+ activation of the mitochondrial ATP-Mg/Pi carrier SCaMC-3. J Biol Chem. 2013;288:7791–7802. - PMC - PubMed
    1. Anunciado-Koza RP, Zhang J, Ukropec J, Bajpeyi S, Koza RA, Rogers RC, Cefalu WT, Mynatt RL, Kozak LP. Inactivation of the mitochondrial carrier SLC25A25 (ATP-Mg2+/Pi transporter) reduces physical endurance and metabolic efficiency in mice. J Biol Chem. 2011;286:11659–11671. - PMC - PubMed
    1. Aprille JR. Regulation of the mitochondrial adenine nucleotide pool size in liver: mechanism and metabolic role. FASEB J. 1988;2:2547–2556. - PubMed
    1. Bassi MT, Manzoni M, Bresciani R, Pizzo MT, Della Monica A, Barlati S, Monti E, Borsani G. Cellular expression and alternative splicing of SLC25A23, a member of the mitochondrial Ca2+-dependent solute carrier gene family. Gene. 2005;345:173–182. - PubMed
    1. Baughman JM, et al. Integrative genomics identifies MCU as an essential component of the mitochondrial calcium uniporter. Nature. 2011;476:341–345. - PMC - PubMed

Publication types

MeSH terms