. 2014 Mar;25(6):904-15.
doi: 10.1091/mbc.E13-10-0628. Epub 2014 Jan 15.

An H3K9/S10 methyl-phospho switch modulates Polycomb and Pol II binding at repressed genes during differentiation

Affiliations

An H3K9/S10 methyl-phospho switch modulates Polycomb and Pol II binding at repressed genes during differentiation

Pierangela Sabbattini et al. Mol Biol Cell. 2014 Mar.

Abstract

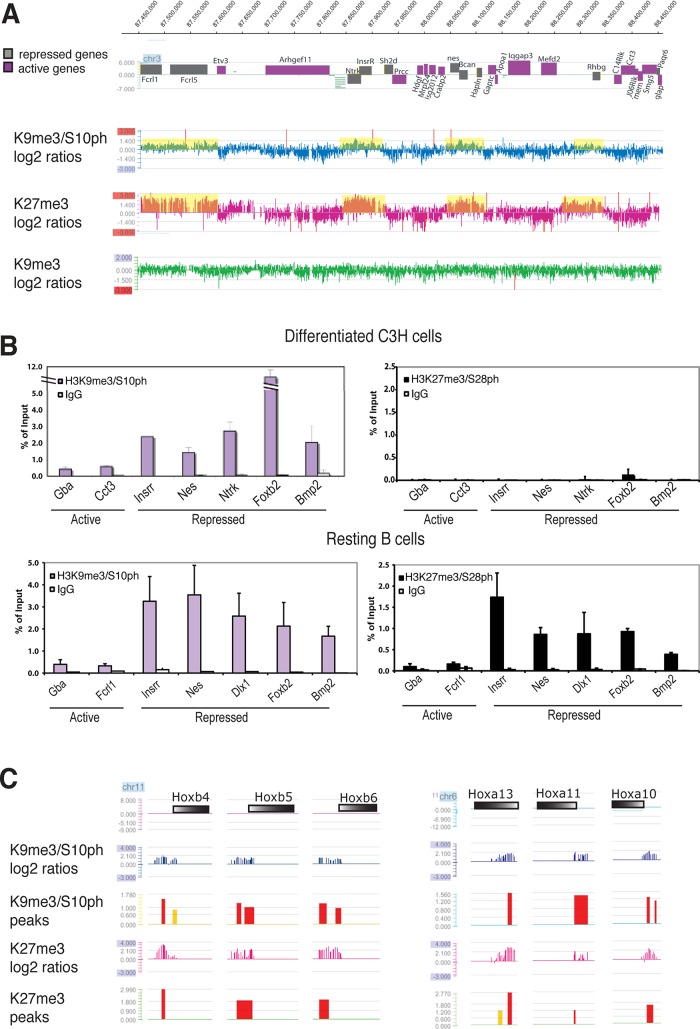
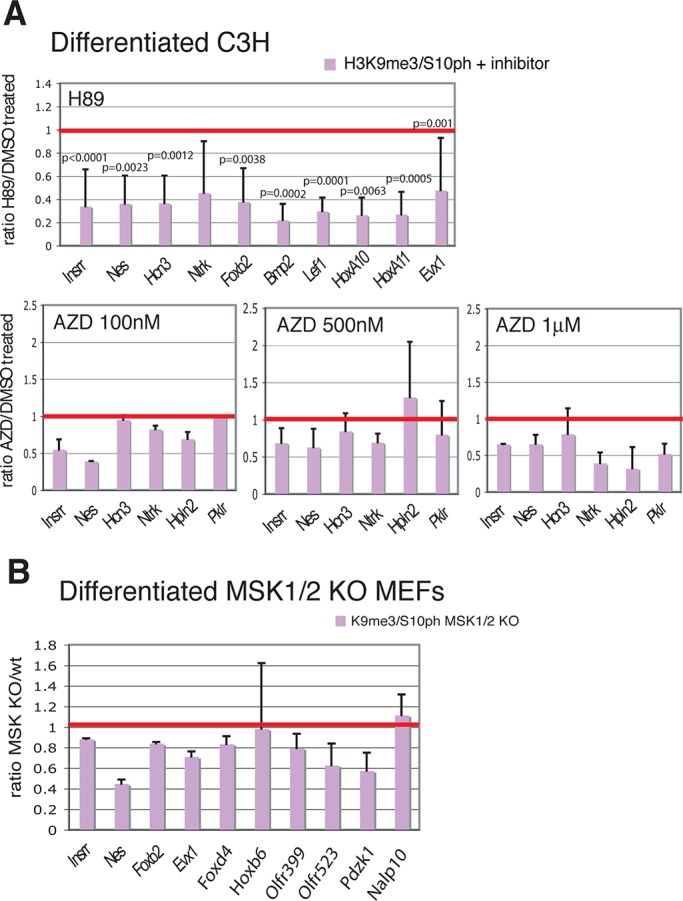
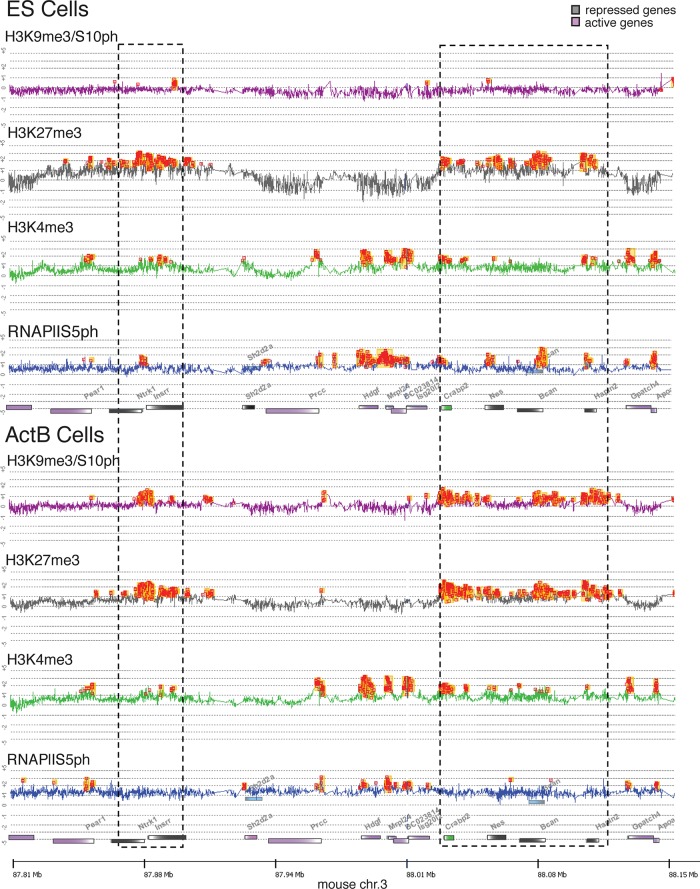
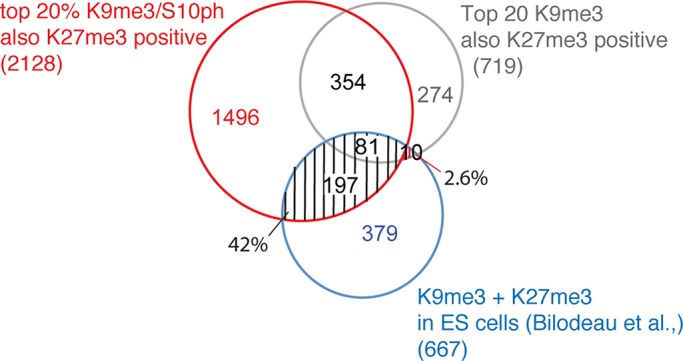
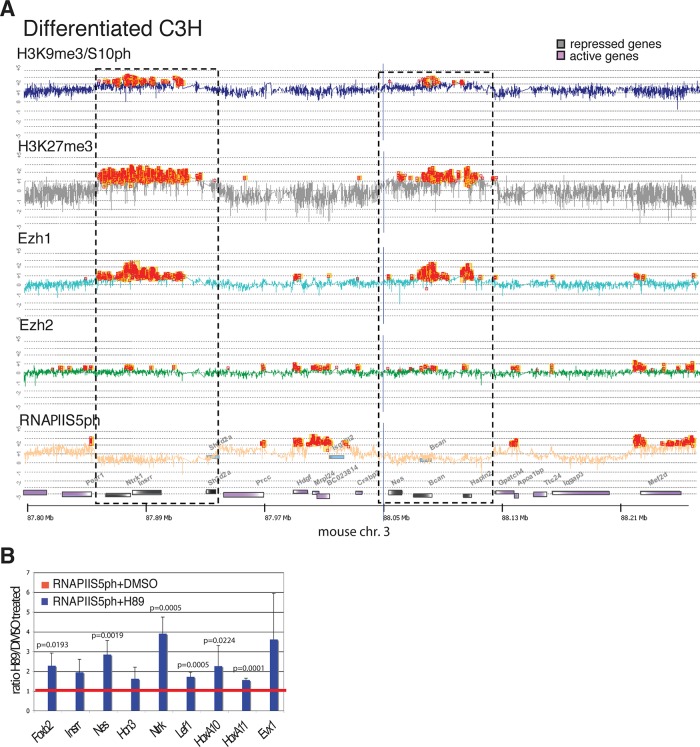
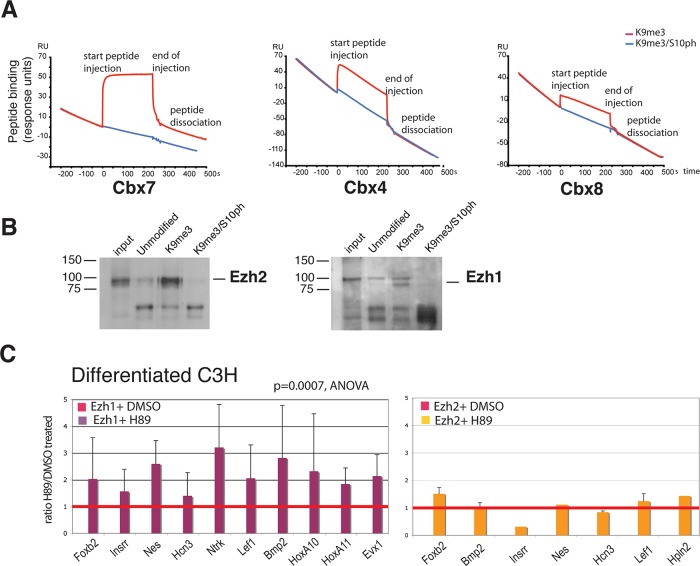
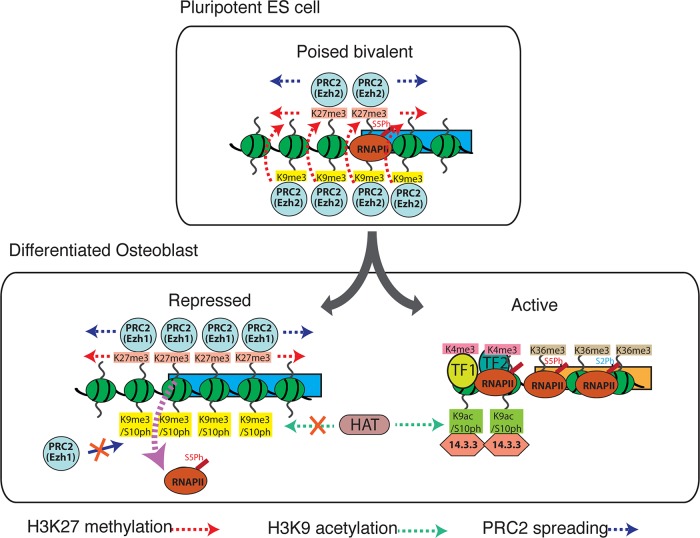
Methylated histones H3K9 and H3K27 are canonical epigenetic silencing modifications in metazoan organisms, but the relationship between the two modifications has not been well characterized. H3K9me3 coexists with H3K27me3 in pluripotent and differentiated cells. However, we find that the functioning of H3K9me3 is altered by H3S10 phosphorylation in differentiated postmitotic osteoblasts and cycling B cells. Deposition of H3K9me3/S10ph at silent genes is partially mediated by the mitogen- and stress-activated kinases (MSK1/2) and the Aurora B kinase. Acquisition of H3K9me3/S10ph during differentiation correlates with loss of paused S5 phosphorylated RNA polymerase II, which is present on Polycomb-regulated genes in embryonic stem cells. Reduction of the levels of H3K9me3/S10ph by kinase inhibition results in increased binding of RNAPIIS5ph and the H3K27 methyltransferase Ezh1 at silent promoters. Our results provide evidence of a novel developmentally regulated methyl-phospho switch that modulates Polycomb regulation in differentiated cells and stabilizes repressed states.


Figures

FIGURE 1:
FIGURE 1:
The H3K9me3/S10ph double modification colocalizes with H3K27me3 at Polycomb-regulated genes in differentiated C3H10T1/2 cells. (A) Tiling microarray analysis spanning 1 Mb of mouse chromosome 3, with repressed genes represented in gray and expressed genes shown in purple. The profile of H3K27me3 in differentiated C3H10T1/2 cells is compared with our previously published data for H3K9me3/S10ph and H3K9me3 (Sabbattini et al., 2007). Domains of enrichment of H3K9m3/S10ph and H3K27me3, corresponding to log2 ratios > 0, are shadowed in yellow. Data are represented as the scaled log2 ratio (pull down/input) of the hybridization signal for the DNA immunoprecipitated with the indicated antibody. (B) ChIP analysis was carried out on chromatin from differentiated C3H10T1/2 mesenchymal cells and resting B cells using anti-H3K27me3/S28ph (black histograms) and anti-H3K9me3/S10ph (purple histograms). Immunoprecipitated chromatin was analyzed with primers for the promoters of a panel of silent and active genes. Differences between the panels of genes selected for analysis for each cell type reflect differences in expression profiles between the two cell types. Bars, mean ± SD. n = 2. (C) Examples of profiles extracted from the top 300 promoter signals for H3K9me3/S10ph obtained using the NimbleGen 24,000 mouse promoter array. The promoters of the Hoxb and Hoxa genes shows peaks of enrichment for both H3K9m3/S10ph and H3K27me3 (red peaks, high probability, false discovery rate [FDR] ≤ 0.05; yellow peaks, intermediate probability, FDR > 0.1 and ≤ 0.2). Peaks were obtained using the NimbleGen default algorithm (www.nimblegen.com/products/lit/nimblescan2.3users-guide.pdf). Gene bodies are represented by colored bars with the 5′ ends shown in white.
FIGURE 2:
FIGURE 2:
Inhibition of MSK1/2 and Aurora B reduces the levels of H3K9m3/S10ph on repressed genes. (A) ChIP analysis of differentiated C3H cells treated with H89 (top) or AZD1152 (bottom). Results are expressed as ratio of the percentages of input chromatin immunoprecipitated by H3K9m3/S10ph from treated cells and from control cells treated with vehicle. n = 5 biological replicates for the H89-treated cells, n = 2 for cells treated with 100 nM and 1 μM AZD1152, and n = 4 for cells treated with 500 nM AZD1152. The red line corresponds to a ratio of 1, which represents the value for the control cells. Statistical significance of the reductions observed after H89 treatment was assessed by paired t test. (B) Analysis of the levels of H3K9me3/S10ph at selected genes in differentiated MEFs derived from MSK1 and MSK2 double-knockout (MSK1/2 dKO) mice relative to wt cells. n = 2. The silent genes used in this study were selected because they are representative of the following categories: tissue-specific repressed genes located in a gene-dense, 2-Mb region of chromosome 3, chosen as a model of chromosomal organization (Fcrl1, Fcrl5, Insrr, Nes, Hcn3, Ntrk, Hpln2, Bcan, Pklr); genes previously been shown to be silenced by Polycomb complexes (Foxb2, Bmp2, Six1, Lef1, HoxA10, HoxA11; Bernstein et al., 2006b); genes identified by the mouse gene promoter array described in this study in Supplemental Table S1 as having highest H3K9me3/S10ph levels in differentiated C3HT101/2 cells (Foxd4, Evx1, Hoxb6, HoxA10); and repressed genes that are marked by H3K9me3/S10ph and have very low levels of poised RNApolIIS5ph in differentiated C3H101/2 cells (Olfr399, Olfr523, Pdzk1, Nalp10).
FIGURE 3:
FIGURE 3:
H3K9me3/S10ph is absent from Polycomb-regulated genes in pluripotent ES cells and correlates with loss of paused RNAPIIS5ph in activated B cells. Enrichment profiles of part of the 2-Mb, gene-dense region of mouse chromosome 3 in ES cells and activated B cells. The analysis was performed using tiled oligonucleotide microarray chips from Agilent (see the Supplemental Methods for details). Hybridization data were analyzed and visualized using DNA Analytics 4.0.85. For reasons of clarity, the alignment line between the traces was removed. Peaks of enrichment (orange squares) were obtained with the Whitehead per-array neighborhood model with the following settings: custom defined f-value, 0.2; maximum distance for two probes to be considered as neighbor, 1000 base pairs; a probe is considered bound if P(X)bar < 0.05; central probe has P(X) = 0.05; and at least one of the neighboring probe has P(X) = 0.1 or at least one neighbor has P(X) < 0.05. For H3K9me3/S10ph the hybridization was carried out with ChIP DNA from elutriated cells in the G1 phase of the cell cycle. Gene bodies are represented by colored bars with the 5′ ends shown in white. Repressed and active genes are colored gray and purple, respectively. Crabp2 is shown in green to indicate that it is expressed at low levels in ES cells. Blue boxes above the genes represent alternative transcripts. Regions containing repressed genes are indicated by dashed boxes.
FIGURE 4:
FIGURE 4:
Promoters that are marked by H3K9me3-H3K27me3 in ES cells convert into H3K9me3/S10ph-H3K27me3 in differentiated mesenchymal cells. Among the top 20% promoters enriched for H3K9me3/S10ph in two biological duplicates of differentiated C3H cells, the promoters that were also positive for H3K27me3 were identified and searched for overlap with the promoters identified by Bilodeau et al. (2009) as carrying H3K9me3-H3K27me3 in ES cells. The search was carried out using VENNY (http://bioinfogp.cnb.csic.es/tools/venny/). Of promoters that were identified as being enriched for the H3K9me3-H3K27me3 combination in ES cells, 42% have H3K9me3/S10ph-H3K27me3 in differentiated C3H cells, with only 2.6% maintaining the H3K9me3-H3K27me3 configuration.
FIGURE 5:
FIGURE 5:
Reduction of H3K9me3/S10ph is associated with in increased level of paused RNAPIIS5ph at repressed genes in differentiated C3H cells. (A) Chromatin from differentiated C3H cells was precipitated with antibodies that recognize H3K9me3/S10ph, H3K27me3, Ezh1, Ezh2, and RNAPIIS5ph and hybridized to an Agilent tiling oligonucleotide microarray covering the 2-Mb region of mouse chromosome 3 described in Figure 4. Peaks of enrichment are indicated by orange squares. Blue lines are alignment lines. Regions containing repressed genes are indicted by dashed boxes. (B) Effect of H89-induced reduction of H3K9me3/S10ph at repressed genes on binding of RNAPIIS5ph in differentiated C3H mesenchymal cells. The y-axis shows the ratio of enrichment of RNAPIIS5ph at the promoters of the indicated genes in H89- treated cells relative to enrichment cells treated with vehicle (dimethyl sulfoxide). Bars show mean ± SD. n = 5 biological replicates. Statistical significance was assessed by paired t test.
FIGURE 6:
FIGURE 6:
Binding of Polycomb proteins to H3K9me3 is affected by the H3S10ph modification. (A) SPR was used to measure binding of purified histidine (His)-tagged Cbx4, 7, and 8 to peptides corresponding to amino acids 1–15-Y of histone H3 containing the K9me3 or the K9me3/S10ph modifications. Peptides were injected over the indicated His-Cbx proteins immobilized on a Biacore flow cell (see Materials and Methods). Red and blue lines indicate binding of K9me3 and K9me3/S10ph peptides, respectively. (B) Binding of Ezh1- and Ezh2-containing PRC2 complexes to histone H3 peptides was assessed by peptide capture. Nuclear extracts from NIH3T3 fibroblasts were used for peptide capture assays as described in the Supplemental Methods. Pull downs were performed with biotinylated peptides derived from the N-terminus of histone H3, corresponding to amino acids 1–20. The peptides were unmodified or contained K9me3 or combined K9me3/S10ph. Captured proteins were identified by Western blot. (C) Reduction of the H3K9me3/S10ph modification by treatment with H89 increases recruitment of Ezh1 to Polycomb-repressed genes but has little effect on Ezh2 binding. Binding of Ezh1 and Ezh2 to promoters of repressed genes was analyzed after treatment with H89 or vehicle (dimethyl sulfoxide). The effect of H89 on the levels of Ezh1 binding across a panel of 13 genes was statistically significant (p = 0.0007, analysis of variance). Bars show mean ± SD. n = 7 biological replicates. No significant effect of H89 treatment was observed on binding of Ezh2 to repressed genes, consistent with its absence from silent genes in these cells.
FIGURE 7:
FIGURE 7:
Model describing the role of the H3K9me3 and H3K9me3/S10ph modifications in polycomb recruitment and gene silencing. In pluripotent ES cells (top), many bivalent genes are also marked by H3K9me3, which binds PRC2 with higher affinity than H3K27me3. The synergy between H3K9me3 and H3K27me3 enhances polycomb binding. In differentiated cells (bottom), phosphorylation of H3S10 blocks binding of PRC2 to H3K9me3 and reduces overall levels of Polycomb binding to genes that are marked by H3K27me3. This contributes to reducing the levels of paused RNAPIIS5ph at these genes. The presence of the H3K9me3 modification also blocks acetylation of H3K9 and formation of the H3K9ac/S10ph modification, which recruits 14-3-3 proteins to active promoters.

References

    1. Azuara V, et al. Chromatin signatures of pluripotent cell lines. Nat Cell Biol. 2006;8:532–538. - PubMed
    1. Banfalvi G. Cell cycle synchronization of animal cells and nuclei by centrifugal elutriation. Nat Protoc. 2008;3:663–673. - PubMed
    1. Bernstein BE, et al. A bivalent chromatin structure marks key developmental genes in embryonic stem cells. Cell. 2006a;125:315–326. - PubMed
    1. Bernstein E, Duncan EM, Masui O, Gil J, Heard E, Allis CD. Mouse Polycomb proteins bind differentially to methylated histone H3 and RNA and are enriched in facultative heterochromatin. Mol Cell Biol. 2006b;26:2560–2569. - PMC - PubMed
    1. Bilodeau S, Kagey MH, Frampton GM, Rahl PB, Young RA. SetDB1 contributes to repression of genes encoding developmental regulators and maintenance of ES cell state. Genes Dev. 2009;23:2484–2489. - PMC - PubMed

Publication types

MeSH terms