. 2014 Jan 15;6(219):219ra9.
doi: 10.1126/scitranslmed.3007361.

Cancer cell profiling by barcoding allows multiplexed protein analysis in fine-needle aspirates

Affiliations

Cancer cell profiling by barcoding allows multiplexed protein analysis in fine-needle aspirates

Adeeti V Ullal et al. Sci Transl Med. .

Abstract

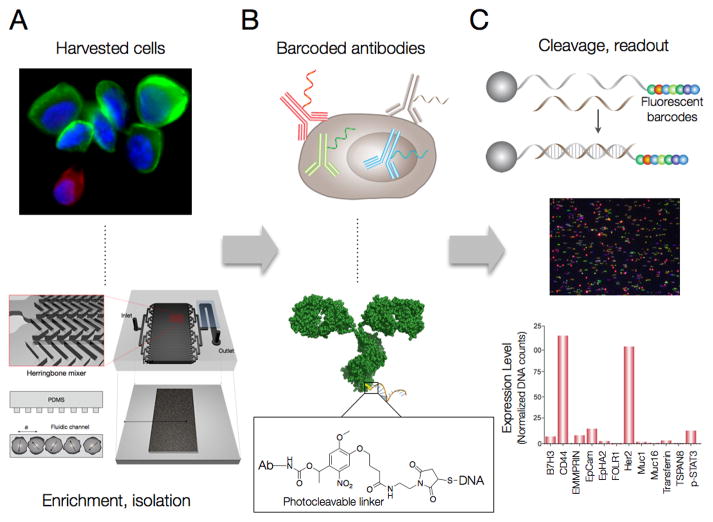
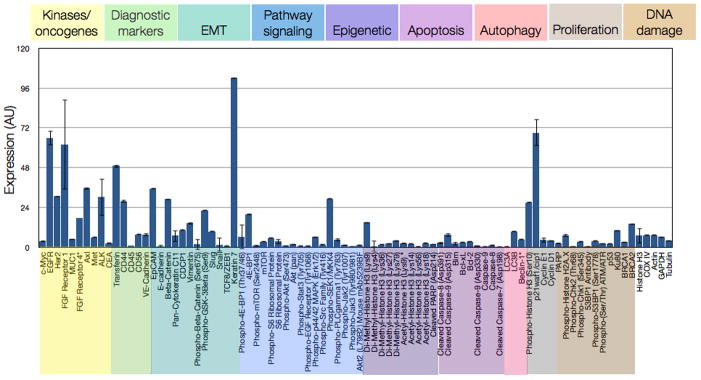
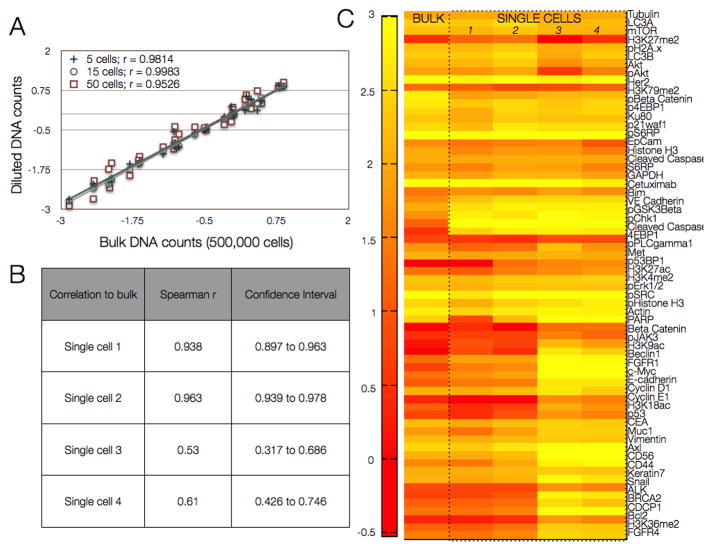
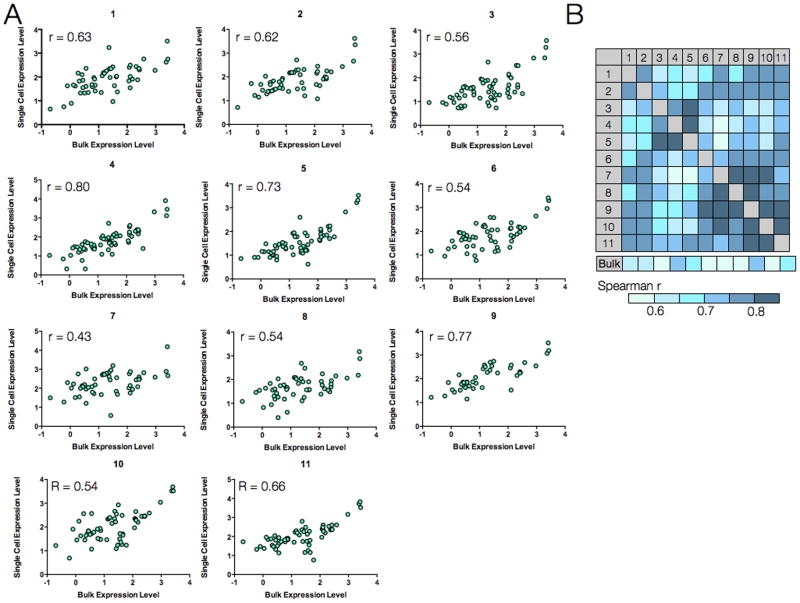
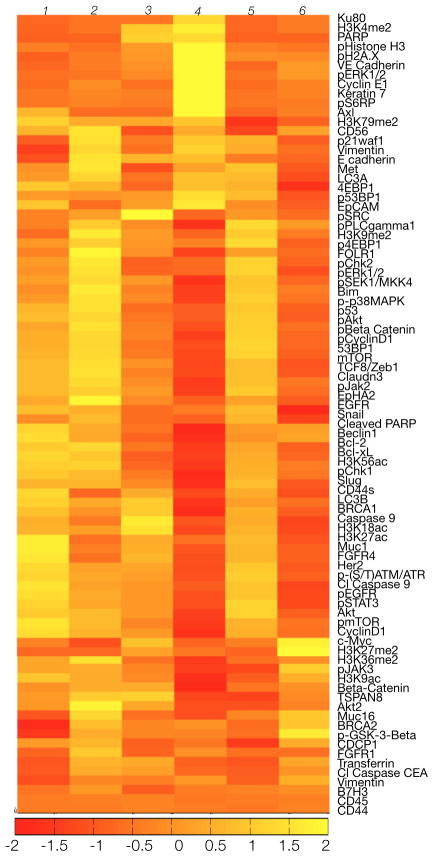
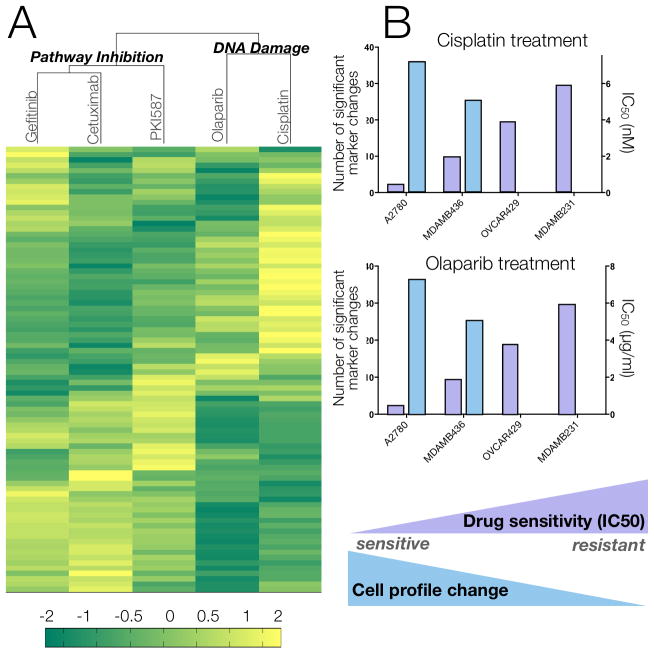
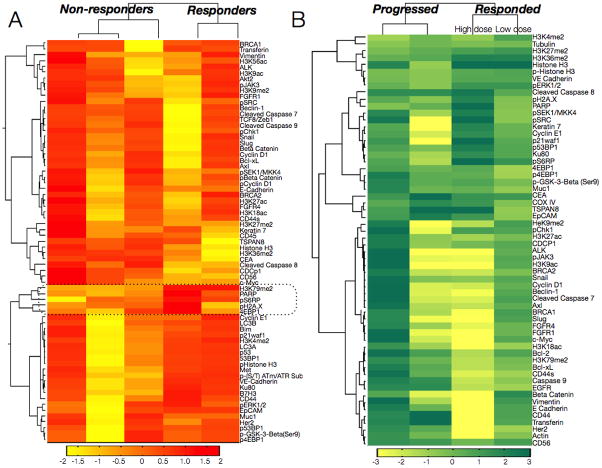
Immunohistochemistry-based clinical diagnoses require invasive core biopsies and use a limited number of protein stains to identify and classify cancers. We introduce a technology that allows analysis of hundreds of proteins from minimally invasive fine-needle aspirates (FNAs), which contain much smaller numbers of cells than core biopsies. The method capitalizes on DNA-barcoded antibody sensing, where barcodes can be photocleaved and digitally detected without any amplification steps. After extensive benchmarking in cell lines, this method showed high reproducibility and achieved single-cell sensitivity. We used this approach to profile ~90 proteins in cells from FNAs and subsequently map patient heterogeneity at the protein level. Additionally, we demonstrate how the method could be used as a clinical tool to identify pathway responses to molecularly targeted drugs and to predict drug response in patient samples. This technique combines specificity with ease of use to offer a new tool for understanding human cancers and designing future clinical trials.


Conflict of interest statement

Competing Interests: The authors have no competing interests. Different aspects of this work (assay and microfluidic device) have been assigned to the General Hospital Corporation for patenting.

Figures

Figure 1
Figure 1. Multiplexed protein analysis in single cells
(A) Cells were harvested from cancer patients by FNA. In this case, a heterogeneous population of EpCAM-positive cancer cells (green) is displayed alongside mesothelial cells (red) with nuclei shown in blue (Hoechst) from an abdominal cancer FNA. Cancer cells were enriched and isolated via magnetic separation in PDMS microfluidic devices with herringbone channels using both positive (e.g. EpCAM+/CK+) and negative (e.g. CD45−) selection modes. (B) Cells of interest were incubated with a cocktail of DNA-conjugated antibodies containing a photo-cleavable linker (fig. S1) to allow DNA release after exposure to ultraviolet light. (C) DNA-antibody conjugates released from lysed cells (fig. S2) were isolated using size-separation and IgG pull-down. Released “alien” DNA barcodes were processed with a fluorescent DNA barcoding platform (NanoString). Fluorescent barcodes were hybridized and imaged using a CCD camera. The quantified barcodes were translated to protein expression levels by normalizing to DNA per antibody and housekeeping proteins and subtracting non-specific binding from control IgGs. A representative profile of SKOV3 ovarian cancer cell lines shows high CD44 and high Her2 expression, characteristic of this cell line.
Figure 2
Figure 2. Multiplexed protein profiling of a human breast cancer cell line
Representative example of 88 different antibodies spanning cancer-relevant pathways (color-coded) profiled in triplicate (mean ± SEM) on the MDA-MB-231 triple-negative breast cancer cell line. DNA counts were converted to protein binding by normalizing to the amount of DNA per antibody. Non-specific binding from expression of six control IgGs was subtracted and expression was normalized by housekeeping proteins Cox IV, histone H3, tubulin, actin, and GAPDH (far right).
Figure 3
Figure 3. Detection sensitivity using a human epidermal cancer cell line
(A) A bulk 500,000 cells from the epidermoid carcinoma cell line A431 was lysed and processed as shown in Fig. 1. Dilutions corresponding to 5, 15, and 50 cells were then compared to the bulk measurement. (B) Correlation values for single A431 cells selected by micromanipulation are compared to the bulk measurements (500,000 cells). (C) Protein expression profiles (log 2 expression values) of four single cells compared with the bulk sample. Correlations were highly significant when comparing all single cells to bulk measurements (p<.0001, paired t-test, GraphPad Prism 6.0).
Figure 4
Figure 4. Single-cell protein analysis in a patient sample
An FNA was obtained from a patient with biopsy-proven lung adenocarcinoma. (A) Eleven harvested cells were analyzed individually, and protein expression levels in each cell (y-axis) were correlated with expression levels from the bulk tumor sample (x-axis). Each data point represents the expression for a given marker (n= 85 markers, 3 below detection threshold). (B) Spearman R correlation coefficient values for each of the single cells in (A) relative to each other and to the bulk measurement.
Figure 5
Figure 5. Inter-patient heterogeneity in lung cancer
FNAs were obtained from six patients with biopsy-proven lung adenocarcinoma, and bulk samples (~100 cells each) were processed as shown in Fig. 1 with 88 barcoded antibodies. Expression data were log2 normalized by row to show differences between each patient. Note the heterogeneity in expression profiles despite the identical histological type (upon genetic analysis, it was noted that patients 1 and 2 had EGFR exon 19 amplification and T790m mutations, patient 3 had an exon 20 EGFR mutation, patient 4 had an EGFR L858R mutation and an additional BRAF mutation, patient 5 had a KRAS mutation, and patient 6 had an EML4-ALK translocation).
Fig. 6
Fig. 6. Effect of different therapies on protein expression profiles in MDA-MB-436 triple negative breast cancer cell line
(A) MDA-MB-436 cells were treated with different agents and marker proteins were measured. Unsupervised hierarchical clustering based on Euclidean distance grouped drug treatments by their mechanisms of action (molecularly targeted vs. DNA-damaging) and primary targets (EGFR for gefitinib/cetuximab and mTOR/PI3K for PKI-587). Data shows the log2 fold change of marker expression in treated compared to untreated cells for n = 84 markers. All experiments were performed in triplicate. (B) Correlating drug sensitivity of 4 different cell lines with proteomic profile changes following treatment with cisplatin and olaparibs. IC50 values (black bars) were calculated based on viability curves (fig. S9A). The cell profile change after treatment is represented by the number of significant markers (grey bars) that were identified by a pairwise t-test of treated vs. untreated samples (FDR = 0.1).
Figure 7
Figure 7. Monitoring and predicting treatment response in patients receiving PI3K inhibitors
(A) Profiles of five drug-naïve cancer patients are shown with clustering based on correlation metrics with weighted linkage. The dotted box shows cluster including the marker that best separated responders and non-responders (H3K79me2). Other markers in the cluster include pS6RP (a downstream target of PI3K), phospho-H2A.X (DNA damage marker), PARP (DNA repair protein) and 4EBP1 (protein translation).(B) Four patients with biopsy-proven adenocarcinoma were treated with PI3Ki, and primary cancers were biopsied before and after treatment. The heat map is a pre–post treatment difference map showing log2 fold changes in protein expression (normalized by row to highlight differences between patients). Patient segregation is by correlation distance metric (weighted linkage). The patient in the third column received a higher dose of the PI3Ki (400 mg b.i.d.) than the patient in the fourth column (150 mg b.i.d.).

Similar articles

Cited by

References

    1. Basik M, Aguilar-Mahecha A, Rousseau C, Diaz Z, Tejpar S, Spatz A, Greenwood CM, Batist G. Biopsies: next-generation biospecimens for tailoring therapy. Nature reviews Clinical oncology. 2013;10:437–450. doi: 10.1038/nrclinonc.2013.101. published online EpubAug . - DOI - PubMed
    1. Vogelstein B, Papadopoulos N, Velculescu VE, Zhou S, Diaz LA, Jr, Kinzler KW. Cancer genome landscapes. Science. 2013;339:1546–1558. doi: 10.1126/science.1235122. published online EpubMar 29 . - DOI - PMC - PubMed
    1. Paez JG, Janne PA, Lee JC, Tracy S, Greulich H, Gabriel S, Herman P, Kaye FJ, Lindeman N, Boggon TJ, Naoki K, Sasaki H, Fujii Y, Eck MJ, Sellers WR, Johnson BE, Meyerson M. EGFR mutations in lung cancer: correlation with clinical response to gefitinib therapy. Science. 2004;304:1497–1500. doi: 10.1126/science.1099314. published online EpubJun 4 . - DOI - PubMed
    1. Soda M, Choi YL, Enomoto M, Takada S, Yamashita Y, Ishikawa S, Fujiwara S, Watanabe H, Kurashina K, Hatanaka H, Bando M, Ohno S, Ishikawa Y, Aburatani H, Niki T, Sohara Y, Sugiyama Y, Mano H. Identification of the transforming EML4-ALK fusion gene in non-small-cell lung cancer. Nature. 2007;448:561–566. doi: 10.1038/nature05945. published online EpubAug 2 . - DOI - PubMed
    1. Yaffe MB. The scientific drunk and the lamppost: massive sequencing efforts in cancer discovery and treatment. Science signaling. 2013;6:pe13. doi: 10.1126/scisignal.2003684. published online EpubApr 2 . - DOI - PubMed

Publication types

MeSH terms

LinkOut - more resources