. 2014 May 2;33(9):994-1010.
doi: 10.1002/embj.201386030. Epub 2014 Jan 15.

Miro1 regulates intercellular mitochondrial transport & enhances mesenchymal stem cell rescue efficacy

Affiliations

Miro1 regulates intercellular mitochondrial transport & enhances mesenchymal stem cell rescue efficacy

Tanveer Ahmad et al. EMBO J. .

Abstract

There is emerging evidence that stem cells can rejuvenate damaged cells by mitochondrial transfer. Earlier studies show that epithelial mitochondrial dysfunction is critical in asthma pathogenesis. Here we show for the first time that Miro1, a mitochondrial Rho-GTPase, regulates intercellular mitochondrial movement from mesenchymal stem cells (MSC) to epithelial cells (EC). We demonstrate that overexpression of Miro1 in MSC (MSCmiro(Hi)) leads to enhanced mitochondrial transfer and rescue of epithelial injury, while Miro1 knockdown (MSCmiro(Lo)) leads to loss of efficacy. Treatment with MSCmiro(Hi) was associated with greater therapeutic efficacy, when compared to control MSC, in mouse models of rotenone (Rot) induced airway injury and allergic airway inflammation (AAI). Notably, airway hyperresponsiveness and remodeling were reversed by MSCmiro(Hi) in three separate allergen-induced asthma models. In a human in vitro system, MSCmiro(Hi) reversed mitochondrial dysfunction in bronchial epithelial cells treated with pro-inflammatory supernatant of IL-13-induced macrophages. Anti-inflammatory MSC products like NO, TGF-β, IL-10 and PGE2, were unchanged by Miro1 overexpression, excluding non-specific paracrine effects. In summary, Miro1 overexpression leads to increased stem cell repair.


Figures

Figure 1
Figure 1. Stem cells show high-efficiency mitochondrial transfer and rescue of stressed airway epithelial cells
A Representative image of TNT between MSC containing mitochondria labeled with mGFP (green), TNT stained with phalloidin (red) and nuclei with DAPI (blue). B Increase in TNT formation as quantified among BEAS-2B cells and among mTEC with rotenone induction. C Quantitative FACS measurement of total percentage of mitochondria in LA-4 or mTEC, which were donated by healthy MSC or rotenone-stressed MSC (MSC (Rot)). D Quantitative FACS measurement of total percentage of mitochondria, which were donated by 3T3 or SMCs, in rotenone-treated LA-4 or NHBE cells. E Representative image of mitochondria transferred from mRFP labeled MSC to stress-induced mGFP-labeled LA-4. The encircled enlarged region, indicated by the black arrow, shows accumulation of red mitochondria in one of the green LA-4 cells, seen as yellow or red. The white arrow marks red mitochondria moving from MSC to the LA-4 (confirmed on time lapse images, see accompanying dataset 3). F Illustrative image of accumulation and migration of mitochondria (mRFP) via nanotubes (enlarged view in inset of “merged with DIC” panel) from MSC into mGFP-labeled stress-induced TEC; nucleus labeled with DAPI. G–J Total mtROS measured in rotenone-treated LA-4 (G), TEC (H), NHBE (I) and BEAS-2B (J) cells with or without co-culture with MSC, SMCs or A549. Cells were treated with or without rotenone (Rot), and mtROS were measured and expressed as mean fluorescence intensity (FMitoSOX) after 24 h of co-culture by gating on epithelial cells (LA-4, TEC, NHBE and BEAS-2B). Data information: In (A, E and F): scale bar, 10 μm. In (B–D) and (G–J): data are shown as mean ± s.e.m. of three independent experiments, *< 0.05 versus Con and #< 0.05 versus Rot.
Figure 2
Figure 2. In vivo transfer of mitochondria from exogenous MSC is critical in reversal of airway epithelial injury
A Representative image of mGFP signals in the bronchial epithelium in rotenone (Rot)-treated mice model lung sections post MSC administration. Bronchial epithelium stained with epithelial cell-specific marker, CCSP (red) and DAPI (nuclei, blue), enlarged region shows the presence of mGFP signal in CCSP+ cells. Scale bar, 20 μm. B Total percent mGFP positive cells in whole lungs as quantitated by FACS, y-axis showing the percent mGFP in CCSP positive bronchial epithelial (BE) cells. The control (Con) mice treated with MSC and rotenone-induced mice (Rot) treated with rotenone-induced MSC (MSC (Rot)) were associated with a much lower number of mGFP signals in the lung BE cells compared to rotenone-induced mice treated with un-induced MSC. C, D Representative images of TUNEL assay for apoptosis and Haematoxylin & Eosin staining for inflammation in lungs of control (con) or rotenone-treated (Rot) mice, which were further administered with healthy MSC (Rot + MSC) or rotenone-treated MSCs (Rot + MSC (Rot)). Scale bar, 50 μm. E Total ATP levels were measured in total lung protein (TLP), expressed as relative light units/milligram of total lung protein (RLU/mg). Rotenone (Rot) treatment led to a significant decrease in ATP levels, which was restored by MSC administration, but not by rotenone-treated MSC (MSC (Rot)). F–H To detect recovery of mitochondrial dysfunction, cytochrome c levels were measured in lung cytosolic extract (F), and complex I (G) and complex IV activity (H) was measured in mitochondrial extracts. The healthy MSC show suppression of cytochrome c release into cytosol and recovery of both complex I and complex IV activity, but these features deteriorated with administration of rotenone-treated MSC (MSC (Rot)). Data information: In (B) and (D–H): data are shown as mean ± s.e.m. of three independent experiments *< 0.05 versus Con, #< 0.05, versus Rot.
Figure 3
Figure 3. Miro1 overexpression enhances mitochondrial donation to injured epithelial cells
A Western blot of Miro1, Miro2, TRAK1, KHC and Myo19 with loading control α-tubulin in MSC under control and rotenone-treated conditions; 60 μg of total cell protein was used for Western blot. B Total cell protein prepared from different cells was used to check for the expression of Miro1. MSC expressed high levels of Miro1, as revealed by densitometry of the Western blot bands calculated by comparing the signal of Miro1 with GAPDH, in arbitrary units (AU). *< 0.05 versus LA-4. C Western blot of Miro1 in MSC transfected with scrambled shRNA (MSCmiroSc), specific Miro1 shRNA (MSCmiroLo), control cDNA (MSCmiroCc) and specific Miro1 cDNA (MSCmiroHi) with 30 μg of total cell protein per lane and α-tubulin used as loading control. D Quantitative FACS measurement of total percentage of mitochondria in LA-4 donated by mGFP-transfected naive MSC and Miro1-modulated MSC. MSC with upregulated expression of Miro1 (MSCmiroHi) show a high efficient transfer of mitochondria to rotenone-stressed LA-4 as compared to normal MSC (MSCmiroCc and MSCmiroSc); whereas MSC with Miro1 knock-down (MSCmiroLo) fail to transfer mitochondria to rotenone-stressed LA-4 cells. *< 0.05 versus LA4 + MSC, #< 0.05 versus LA-4(Rot) + MSCmiroCc or MSCmiroSc. E Quantitative FACS measurement of total mitochondrial ROS (mtROS) in LA-4 cells after co-culture with MSC. Control cDNA MSC (MSCmiroCc) or control shRNA MSC (MSC-miroSc) were associated with attenuation of mtROS levels in LA-4 cells compared to rotenone-treated LA-4 cells. In both cases, Miro1 upregulation in MSC (MSCmiroHi) further attenuated mtROS levels, while Miro1 knockdown MSC (MSCmiroLo) did not show any protective effect. *< 0.05 versus LA4 (Con), #< 0.05 versus LA-4 (Rot) + MSCmiroCc or MSCmiroSc. F, G Western blot analysis for expression of Miro1 (F) and TRAK1 (G). Miro1 was measured in SMC transfected with control cDNA (SMC-cDNAC) and specific Miro1 cDNA plasmid (SMC-MiroHi). TRAK1 was measured by Western blot in SMC transfected with control cDNA (SMC-cDNAC) and TRAK1 overexpression plasmids (SMC-TRAK1Hi). Total cell protein prepared from SMC was used and α- tubulin was used as a loading control. H FACS measurement of transfer of mitochondria estimated by percentage counts of mGFP (from mGFP transfected SMC) in NHBE cells. Miro1 upregulation was associated with increased mitochondrial transportation from SMC (SMC-MiroHi) compared to rotenone (Rot)-treated or control-cDNA transfected cells (SMC-cDNAC). TRAK1 overexpressed SMC (SMC-TRAK1Hi) did not show any significant mitochondrial transfer compared to control cDNA-transfected cells (SMC-cDNAC). Data is shown as mean ± s.e.m. of three independent experiments *< 0.05 versus NHBE + SMC, #< 0.05 versus NHBE (Rot) + SMC-cDNAC. Source data are available online for this figure.
Figure 4
Figure 4. Restoration of mitochondrial bioenergetics by Miro1-overexpressing MSC
A, B Representative images of inflammatory cell infiltration and epithelial cell apoptosis. Both cellular infiltration and apoptosis were significantly decreased in mice lungs treated with MSCmiroHi while there was no effect with MSCmiroLo. Scale bars, 50 μm (A) and 10 μm (B). C Percent of total mGFP in bronchial epithelial cells after treatment with mGFP transfected MSC as indicated. Miro1-overexpressing MSC (MSCmiroHi) were more efficient mitochondrial donors compared to control cDNA-transfected MSC (MSCmiroCc). Miro1 knockdown MSC (MSCmiroLo) have a decreased mitochondrial donation potential compared to control shRNA transfected cells (MSCmiroSc). D, E MSCmiroHi treatment significantly decreased cytochrome c release (D) and restored ATP levels (E) compared to control-transfected MSC (MSCmiroCc), while MSCmiroLo were less effective. Data information: In (C-E), data are shown as mean ± s.e.m. of three independent experiments, *< 0.05 versus Con, $< 0.05 versus Rot and #< 0.05, versus Rot, MSCmiroCc or MSCmiroSc.
Figure 5
Figure 5. Miro1-overexpressing MSC are better mitochondrial donors to asthmatic airways
A Scheme for development of acute mouse model of asthma and delivery of mGFP labeled MSC into the mice lungs. Mice were Ova-sensitized with weekly 3 successive intraperitoneal (i.p.) injections of ovalbumin (50 μg) allergen and then intranasally challenged with 3% aerosolized ovalbumin for a week on alternate days to develop acute airway allergy. MSC were injected after two challenges on 23rd day post ovalbumin challenge and further after subsequent challenges, the mice were sacrificed. B Representative images of TFAM expression in mice lungs. Increased mitochondrial biogenesis indicated by higher expression of TFAM in Ova mice compared to Sham as indicated by immunohistochemistry for TFAM. Scale bars, 50 μm. C Percentage of mGFP in different cell populations of the mice lung under normal and Ova condition treated with MSC, quantified by FACS. BE, bronchial epithelial cells stained with CCSP; ECs, epithelial cells stained with EpCAM; AE, alveolar epithelial cells stained with SPC; Ma, macrophages stained with F4/80; ME, mesenchymal cells stained with alpha smooth muscle actin. D Percentage of mGFP signal in bronchial epithelial cells as quantified by FACS. Treatment with Miro1-overexpressing MSC (MSCmiroHi) significantly increased percentage of mGFP positive cells, while Miro1 knockdown MSC (MSCmiroLo) was associated with decreased mGFP positive cells compared to control-cDNA or control shRNA-treated cells. E Airway hyperresponsiveness (AHR) was significantly increased in Ova and shows no improvement with administration of MSCmiroLo. MSCmiroHi treatment led to a significant decrease in AHR compared to Ova mice or Ova mice treated with control MSC (MSCmiroCc, MSCmiroSc). F, G IL-5 and IL-13 were significantly upregulated in Ova mice compared to Sham mice. MSCmiroHi treatment significantly decreased the levels of both inflammatory cytokines, while there was no effect with administration of MSCmiroLo. H ATP levels were significantly decreased in Ova mice compared to Sham mice. Miro1 overexpressing MSC (MSCmiroHi) significantly restored ATP levels, while there was no effect with Miro1-downregulated MSC (MSCmiroLo). Data information: In (C-H): data are of two independent experiments, *< 0.05 versus Sham, $< 0.05 versus Ova and #< 0.05 versus Ova, Ova + MSCmiroCc or Ova + MSCmiroSc.
Figure 6
Figure 6. Miro1-overexpressing MSC, a better therapeutic for asthma
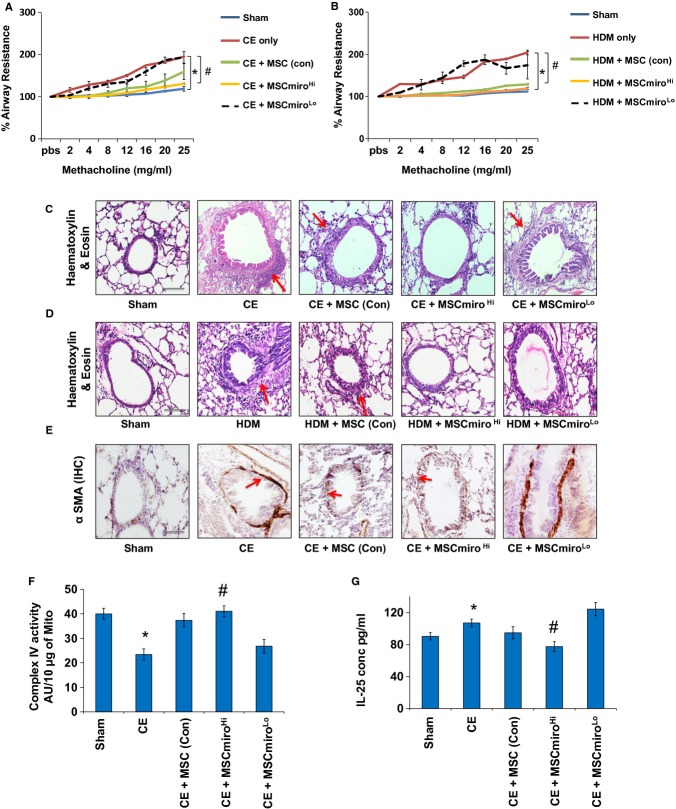
  1. Representative images of alpha smooth muscle actin (α-SMA) staining (red) indicate myofibroblast cells (white arrows) in lungs of control mice (Sham), ovalbumin-treated mice (Ova), mice with ovalbumin control MSC-treated cells (MSCmiroCc or MSCmiroSc), Miro1-overexpressed MSC (MSCmiroHi) and Miro1-downregulated MSC (MSCmiroLo). MSCmiroHi treatment led to a significant decrease in the number of myofibroblast cells, while there was no effect with MSCmiroLo treatment.

  2. Representative images of Haematoxylin & Eosin stained lung sections. MSCmiroHi significantly decreased the cellular infiltration (indicated by black arrows) in the ovalbumin treated mice lungs compared to the only Ova mice, while there was no effect observed with MSCmiroLo. Inflammation scoring was done to quantify the degree of cellular infiltration (perivascular and peribronchial), as shown in the bar graph (right side).

  3. Masson's trichrome stain was used for staining collagen (blue) in mice lungs. Ova mice had increased collagen deposition (indicated by black arrows) beneath the bronchial epithelium and vessel wall compared to Sham mice. MSCmiroHi treatment led to a significant decrease in collagen deposition, MSCmiroLo did not show any decrease compared to Ova mice. Total collagen content measured by image quantitation revealed significant decrease in collagen content by MSCmiroHi treatment, while as control cDNA or shRNA-transfected MSC (MSCmiroCc or MSCmiroSc) also showed a modest improvement, as shown in the bar graph (right side)..

  4. Mucin content (pink-purple) in mouse lungs was measured by Periodic acid-Schiff stain. MSCmiroHi treatment led to a significant decrease in mucus secretion, as seen with observed mucin granules (indicated by black arrows) while as MSCmiroLo treatment did not, compared to Ova mice. Control cDNA or shRNA-transfected MSC (MSCmiroCc or MSCmiroSc) also showed a modest improvement. Total mucin content was measured by image quantitation, as shown in the bar graph (right side).

Data information: Data in (B–D) are representative of two independent experiments, *< 0.05 versus Sham, $< 0.05 versus Ova and #< 0.05 versus Ova, Ova + MSCmiroCc or Ova + MSCmiroSc; scale bars, 10 μM (A), 50 μM (B, C) and 30 μM (D).
Figure 7
Figure 7. Therapeutic effects of Miro1-overexpressing MSC in Cockroach-extract and HDM-extract induced models of AAI
A, B Airway hyperresponsiveness (AHR) was significantly increased in CE and HDM mice models, which was not improved with MSCmiroLo treatment. MSCmiroHi treatment led to a significant decrease in AHR compared to CE or HDM mice as well as CE or HDM mice treated with control MSC (MSC (con)). C, D Representative images of Haematoxylin & Eosin staining for detection of inflammation (red arrows) in lungs of the CE mouse model treated with MSC show reduction of inflammation with MSCmiroHi that is much more efficient compared to MSC-con treatment, whereas there is persistent inflammation with MSCmiroLo treatment. E Representative images of alpha smooth muscle actin (α-SMA) immunohistochemistry staining indicates myofibroblast cells in mice lung sections. There is an increase in expression of α-SMA (brown stained regions indicated with red arrows) in CE-induced mice (CE), as well as CE mice treated with MSCmiroLo, but a sufficient reduction with control MSC (MSC (con)), and a high reduction when treatedwith MSCmiroHi. F Complex IV activity measured in mitochondrial extract of lung samples from the CE allergen mouse model, showing significant recovery of COX IV activity when CE mice were treated with MSCmiroHi as compared to moderate rescue by MSC (con) and almost no rescue with MSCmiroLo treatment. G Levels of epithelial stress cytokine IL-25 as measured in lung samples from the CE allergen mouse model, show efficient reduction when CE mice were treated with MSCmiroHi as compared to moderate decrease with MSC (con) and almost no reduction with MSCmiroLo treatment. Data information: In (C–E): scale bar, 50 μm. In (A–B, F–G): *< 0.05 versus Sham; #< 0.05 versus CE or HDM.
Figure 8
Figure 8. Miro1-overexpressing MSCs repair bronchial epithelial cell injury
A–C ELISA data for TSLP (A), IL-25 (B) and IL-33 (C) measured in total protein, prepared from LMD-dissected bronchial epithelial cells from mice groups of Sham, Ova, Ova + MSCmiroCc and Ova + MSCmiroHi. Data are represented as mean ± s.e.m. of three independent experiments; *< 0.05 versus Sham, and #< 0.05 versus Ova, Ova + MSCmiroCc. D Representative electron microscopy (EM) images of Sham, Ova, Ova with MSC-downregulated Miro1 (Ova + MSCmiroLo) and Ova with MSC-overexpressed Miro1 (Ova + MSCmiroHi) administered to mice lungs. The red arrows indicate the morphological state of mitochondria, deformations in intact mitochondrial morphology in Ova is not improved with MSCmiroLo treatment but improved with MSCmiroHi treatment. Scale bar, 0.5 μm. E A schematic diagram showing tunneling nanotubes (TNT) formation between injured epithelial cells and MSC and the donation of mitochondria by the later to the former via these TNT.

Comment in

References

    1. Aguilera-Aguirre L, Bacsi A, Saavedra-Molina A, Kurosky A, Sur S, Boldogh I. Mitochondrial dysfunction increases allergic airway inflammation. J Immunol. 2009;183:5379–5387. - PMC - PubMed
    1. Ahmad T, Kumar M, Mabalirajan U, Pattnaik B, Aggarwal S, Singh R, Singh S, Mukerji M, Ghosh B, Agrawal A. Hypoxia response in asthma: differential modulation on inflammation and epithelial injury. Am J Respir Cell Mol Biol. 2012;47:1–10. - PubMed
    1. Ahmad T, Mabalirajan U, Sharma A, Aich J, Makhija L, Ghosh B, Agrawal A. Simvastatin improves epithelial dysfunction and airway hyperresponsiveness: from asymmetric dimethyl-arginine to asthma. Am J Respir Cell Mol. 2011;44:531–539. - PubMed
    1. Aich J, Mabalirajan U, Ahmad T, Agrawal A, Ghosh B. Loss-of-function of inositol polyphosphate-4-phosphatase reversibly increases the severity of allergic airway inflammation. Nat Commun. 2012;3:877. - PubMed
    1. Brickley K, Stephenson FA. Trafficking kinesin protein (TRAK)-mediated transport of mitochondria in axons of hippocampal neurons. J Biol Chem. 2011;286:18079–18092. - PMC - PubMed

Publication types

MeSH terms

Substances