. 2014 Jan 15;34(3):726-36.
doi: 10.1523/JNEUROSCI.3483-13.2014.

Dopamine deficiency contributes to early visual dysfunction in a rodent model of type 1 diabetes

Affiliations

Dopamine deficiency contributes to early visual dysfunction in a rodent model of type 1 diabetes

Moe H Aung et al. J Neurosci. .

Abstract

Dopamine (DA) functions as an essential neuromodulator in the brain and retina such that disruptions in the dopaminergic system are associated with common neurologic disorders such as Parkinson's disease. Although a reduction in DA content has been observed in diabetes, its effects in the development of diabetes-induced neuropathy remains unknown. Because the retina is rich in DA and has a well known diabetes-induced pathology (diabetic retinopathy or DR), this study was designed to examine the role of retinal DA deficiency in early visual defects in DR. Using rodent models of type 1 diabetes mellitus, we investigated whether diabetes caused a reduction in retinal DA content in both rats and mice and determined whether restoring DA levels or activating specific DA receptor pathways could improve visual function (evaluated with optokinetic tracking response) of diabetic mice, potentially via improvement of retinal function (assessed with electroretinography). We found that diabetes significantly reduced DA levels by 4 weeks in rats and by 5 weeks in mice, coincident with the initial detection of visual deficits. Treatment with l-DOPA, a DA precursor, improved overall retinal and visual functions in diabetic mice and acute treatment with DA D1 or D4 receptor agonists improved spatial frequency threshold or contrast sensitivity, respectively. Together, our results indicate that retinal DA deficiency is an underlying mechanism for early, diabetes-induced visual dysfunction and suggest that therapies targeting the retinal dopaminergic system may be beneficial in early-stage DR.

Keywords: Diabetic retinopathy; Dopamine; Visual function.


Figures

Figure 1.
Figure 1.
Diabetes results in reduced retinal DA content. A, Overall, DM rats exhibited significantly reduced DA levels compared with CTRL animals (main treatment effect: p < 0.001). There was also a significant age-dependent increase in DA levels of all animals (main duration effect: p < 0.01). B, Regardless of diabetes status, rats had significantly higher DOPAC levels at the 12-week time point than at the 4-week time point (main duration effect: p < 0.001). DM animals showed a trend toward lower DOPAC levels compared with CTRL animals at the 12-week time point. C, Metabolism of DA to DOPAC did not differ between CTRL and DM animals. No significant change in the DOPAC/DA ratio was detected due to diabetes in Long–Evans rats. However, there was an increase in dopamine metabolism due to age (main duration effect: p = 0.001).
Figure 2.
Figure 2.
Diabetes lowers retinal DA levels in STZ-induced DM mice. A, At the 5-week time point, DM mice had significantly reduced retinal DA contents compared with the CTRL mice (p = 0.039). B, C, A slight trend for decreased DOPAC levels or DOPAC/DA ratios due to diabetes was observed.
Figure 3.
Figure 3.
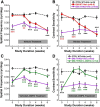
Chronic l-DOPA treatment delays early diabetes-induced visual dysfunction. A, DM WT + Veh mice showed significant reductions in spatial frequency threshold from CTRL animals as early as 3 weeks after STZ (post hoc comparison, p < 0.001). In contrast, the visual deficits appeared in DM WT + l-DOPA mice starting at 4 weeks after STZ (post hoc comparison, p < 0.01) with a slower and less severe progression. B, Contrast sensitivities were also significantly reduced in DM WT + Veh mice (post hoc comparison, p < 0.001) at 4 weeks after STZ, whereas DM WT + l-DOPA mice only exhibited a slight decrease in sensitivity at 6 weeks after STZ (post hoc comparison, p < 0.05). The color of the asterisk indicates the treatment group for which significance was reached, with the exception of the black asterisk, which refers to both CTRL WT + Veh and CTRL WT + l-DOPA groups. Note that the y-axis does not start at zero; it is modified to more clearly show the differences between treatment groups.
Figure 4.
Figure 4.
Genetic model of retinal DA deficiency (rTHKO) replicates early diabetes-induced visual dysfunction and could be rescued with l-DOPA treatment. A, Diabetes did not further impair the spatial frequency threshold levels of DM rTHKO + Veh mice and the spatial frequency thresholds of the DM WT + Veh and DM rTHKO + Veh groups became indistinguishable starting at 3 weeks after STZ. B, Similarly, the combination of rTHKO and diabetes did not further reduce contrast sensitivity within the time frame of this study and contrast sensitivities of DM WT + Veh and DM rTHKO + Veh mice were indistinguishable from 3 weeks after STZ onward. C, Chronic l-DOPA treatment restored the spatial frequency thresholds of rTHKO mice (DM rTHKO + l-DOPA). DM rTHKO + l-DOPA mice had significantly higher spatial frequency thresholds than DM rTHKO + Veh mice throughout the study duration (post hoc comparison, p < 0.001). Moreover, l-DOPA treatment in rTHKO mice significantly delayed the onset and slowed the progression of diabetes-induced impairment of spatial frequency threshold, which was only significant at 6 weeks after STZ (post hoc comparison, p < 0.05). D, Similar to findings in spatial frequency threshold, DM rTHKO + l-DOPA mice exhibited significantly better contrast sensitivities than DM rTHKO + Veh (post hoc comparison, p < 0.001). The severity of perturbations in contrast sensitivity due to diabetes was also diminished in DM rTHKO + l-DOPA mice compared with DM WT + Veh mice (post hoc comparison, p < 0.05). The color of the asterisk indicates the treatment group for which significance was reached. Note that the y-axis does not start at zero; it is modified to more clearly show the differences between treatment groups.
Figure 5.
Figure 5.
Changes in DA levels due to diabetes affect light-adapted retinal function. A, Representative raw waveforms to flicker stimuli (6 Hz) from CTRL WT (black), DM WT + Veh (red), DM WT + l-DOPA (blue), DM rTHKO + Veh (purple), and DM rTHKO + l-DOPA (green) at the 5-week time point. The gray line indicates the peak of the response in a CTRL WT mouse; gray arrows indicate the peak of the response when delayed. B, C, Average amplitudes (B) and implicit times (C) of the flicker responses from experimental groups at the 5-week time point. DM WT + Veh mice had reduced (post hoc comparison, p < 0.05) and delayed (post hoc comparison, p < 0.05) ERG responses compared with CTRL WT mice. l-DOPA treatment was able to restore ERG responses of DM WT mice to those of CTRL mice. Moreover, DM rTHKO + Veh mice with presumed lower DA content had severely reduced amplitudes than all other groups (post hoc comparison, p < 0.05) except that of DM WT + Veh animals. DM rTHKO + Veh mice also exhibited delayed responses from CTRL WT and DM WT + l-DOPA animals (post hoc comparison, p < 0.01). The color of the asterisk indicates the treatment group in which significance was reached.
Figure 6.
Figure 6.
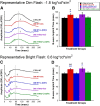
Changes in DA levels due to diabetes affect dark-adapted retinal function. A, B, Representative raw waveforms and average b-wave implicit times in response to a dim-flash stimulus (−1.8 log cd s/m2) at the 5-week time point. C, D, Representative raw waveforms and average b-wave implicit times in response to a bright-flash stimulus (0.6 log cd s/m2) at the 5-week time point. The following colors represent each treatment group: black, CTRL WT; red, DM WT + Veh; blue, DM WT + l-DOPA; purple, DM rTHKO + Veh; and green, DM rTHKO + l-DOPA. The gray lines indicate the peak of the b-wave in a CTRL WT mouse; gray arrows indicate the peak of the response when delayed. DM WT + Veh mice exhibited significantly delayed b-wave responses elicited with both dim (post hoc comparison, p < 0.05) and bright (post hoc comparison, p < 0.01) flash stimuli compared with CTRL WT and DM WT + l-DOPA mice. l-DOPA treatment was able to restore ERG responses of DM WT mice (DM WT + l-DOPA) to those of CTRL WT mice. Similarly, DM rTHKO + Veh mice had severely delayed responses from CTRL WT and DM WT + l-DOPA animals at the bright flash stimulus (post hoc comparison, p < 0.05). The color of the asterisk indicates the treatment group in which significance was reached.
Figure 7.
Figure 7.
mRNA levels of the examined dopaminergic system-related genes. rTHKO mice had significantly lower expressions of Th than CTRL WT mice (t test, p < 0.01). Diabetes in DM WT mice did not induce a significant change in mRNA levels of Th, Drd1, or Drd4 compared with the CTRL WT mice. Interestingly, l-DOPA treatment caused a downregulation of Drd4 (t test, p < 0.05), but not of Drd1, in DM WT mice compared with CTRL WT mice. Note that the y-axis refers to averaged 2−ΔCt values, with ΔCt calculated by subtracting cycle threshold (Ct) of 18S from Ct of gene of interest (GOI). The asterisk indicates significant difference between the respective treatment group and the CTRL WT group.
Figure 8.
Figure 8.
Distinct improvement in OKT responses of 8-week DM WT mice (n = 7) after treatments with selective dopamine receptor agonists. A, Spatial frequency thresholds of DM WT mice improved significantly when treated with D1 receptor agonist (post hoc analysis, p < 0.01). Treatment with the D4 receptor agonist failed to improve spatial frequency thresholds. B, Conversely, DM WT mice showed significantly enhanced contrast sensitivity levels only when treated with D4 agonist (post hoc analysis, p < 0.05). However, neither treatment restored visual functions (spatial frequency threshold and contrast sensitivity) of DM WT mice to CTRL WT levels, indicated by the dashed lines with their variance (± SEM) represented by gray boxes. Note that the y-axis does not start at zero; it is modified to more clearly show the differences between treatment groups.

Similar articles

Cited by

References

    1. Abu El-Asrar AM, Dralands L, Missotten L, Geboes K. Expression of antiapoptotic and proapoptotic molecules in diabetic retinas. Eye (Lond) 2007;21:238–245. doi: 10.1038/sj.eye.6702225. - DOI - PubMed
    1. Abu-El-Asrar AM, Dralands L, Missotten L, Al-Jadaan IA, Geboes K. Expression of apoptosis markers in the retinas of human subjects with diabetes. Invest Ophthalmol Vis Sci. 2004;45:2760–2766. doi: 10.1167/iovs.03-1392. - DOI - PubMed
    1. Aguiar AS, Jr, Moreira EL, Hoeller AA, Oliveira PA, Córdova FM, Glaser V, Walz R, Cunha RA, Leal RB, Latini A, Prediger RD. Exercise attenuates levodopa-induced dyskinesia in 6-hydroxydopamine-lesioned mice. Neuroscience. 2013;243:46–53. doi: 10.1016/j.neuroscience.2013.03.039. - DOI - PubMed
    1. Akimov NP, Rentería RC. Spatial frequency threshold and contrast sensitivity of an optomotor behavior are impaired in the Ins2Akita mouse model of diabetes. Behav Brain Res. 2012;226:601–605. doi: 10.1016/j.bbr.2011.09.030. - DOI - PMC - PubMed
    1. Antonetti DA, Barber AJ, Bronson SK, Freeman WM, Gardner TW, Jefferson LS, Kester M, Kimball SR, Krady JK, LaNoue KF, Norbury CC, Quinn PG, Sandirasegarane L, Simpson IA, Simpson IA. Diabetic retinopathy: seeing beyond glucose-induced microvascular disease. Diabetes. 2006;55:2401–2411. doi: 10.2337/db05-1635. - DOI - PubMed

Publication types