. 2014 Jan 15;34(3):855-68.
doi: 10.1523/JNEUROSCI.0229-13.2014.

Investigation of synapse formation and function in a glutamatergic-GABAergic two-neuron microcircuit

Affiliations

Investigation of synapse formation and function in a glutamatergic-GABAergic two-neuron microcircuit

Chia-Ling Chang et al. J Neurosci. .

Abstract

Neural circuits are composed of mainly glutamatergic and GABAergic neurons, which communicate through synaptic connections. Many factors instruct the formation and function of these synapses; however, it is difficult to dissect the contribution of intrinsic cell programs from that of extrinsic environmental effects in an intact network. Here, we perform paired recordings from two-neuron microculture preparations of mouse hippocampal glutamatergic and GABAergic neurons to investigate how synaptic input and output of these two principal cells develop. In our reduced preparation, we found that glutamatergic neurons showed no change in synaptic output or input regardless of partner neuron cell type or neuronal activity level. In contrast, we found that glutamatergic input caused the GABAergic neuron to modify its output by way of an increase in synapse formation and a decrease in synaptic release efficiency. These findings are consistent with aspects of GABAergic synapse maturation observed in many brain regions. In addition, changes in GABAergic output are cell wide and not target-cell specific. We also found that glutamatergic neuronal activity determined the AMPA receptor properties of synapses on the partner GABAergic neuron. All modifications of GABAergic input and output required activity of the glutamatergic neuron. Because our system has reduced extrinsic factors, the changes we saw in the GABAergic neuron due to glutamatergic input may reflect initiation of maturation programs that underlie the formation and function of in vivo neural circuits.

Keywords: GABAergic neuron; activity dependent; cell autonomous; cell culture; release probability; synapse formation.


Figures
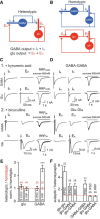
Figure 1.
Figure 1.
GABAergic output is modulated by glutamatergic input in glu-GABA pairs. A, Schematic diagram illustrating four different synaptic connections in a glu-GABA (heterotypic) neuronal circuit. The axon from a GABAergic or a glutamatergic neuron makes synapses onto itself (autaptic; A) and the partner neuron (heterosynaptic; H). The connections are as follows: Inhibitory autaptic connection (IA), inhibitory heterosynaptic connection (IH), excitatory autaptic connection (EA), and excitatory heterosynaptic connection (EH). B, Schematic diagram illustrating two different synaptic connections for a GABA-GABA (homotypic) and a glu-glu (homotypic) pair. The connections in GABA-GABA neuronal pairs are IA and IH. The connections in glu-glu neuronal pairs are EA and EH. C, Representative traces of evoked IPSCs and EPSCs and sucrose responses from paired recording of a heterotypic neuron pair showing the ready releasable pool of GABAergic and glutamatergic vesicles (RRPGABA and RRP glu, respectively). Responses were recorded from autaptic and heterosynaptic connections of each cell. GABAergic output was measured in the presence of kynurenic acid (C1) and glutamatergic output was determined in the presence of bicuculline (C2). Arrow indicates 2 ms somatic depolarization. D, Representative traces of evoked IPSCs and EPSCs and sucrose responses from paired recordings of GABA-GABA and glu-glu homotypic pairs. Arrow indicates 2 ms somatic depolarization. E, Bar graph showing the mean output PSC amplitudes and output RRP charges measured in heterotypic (black) and homotypic (red) neuronal pairs both normalized to homotypic values per culture. All values are mean ± SEM. ***p ≤ 0.001. F, Bar graph showing the mean ratio of autaptic over heterosynaptic PSC and RRP responses of glutamatergic and GABAergic neurons in glu-GABA or homotypic neuronal pairs. Numbers in bar graphs are n values.
Figure 2.
Figure 2.
Glutamatergic input affects GABAergic synaptic efficiency in glu-GABA pairs. A, Representative traces of paired-pulse EPSC (left) and IPSC (right) traces from heterosynaptic connections in homotypic (glu-glu, GABA-GABA; red traces) and heterotypic (glu-GABA; black traces) pairs. B, Bar graph showing the Pvr and PPR in either glutamatergic or GABAergic neurons in glu-GABA (black) and homotypic (red) pairs normalized to the mean value from homotypic pairs per culture. ***p ≤ 0.001. C, Representative traces of paired-pulse EPSC (left) and IPSC (right) traces from autaptic (black) and heterosynaptic (red) connections in homotypic (glu-glu, GABA-GABA) pairs. D, Bar graph showing the autaptic (black) and heterosynaptic (red) PPR and Pvr in glu-GABA and homotypic neuronal pairs normalized to the heterosynaptic values. All values are mean ± SEM. Numbers in bar graphs are n values.
Figure 3.
Figure 3.
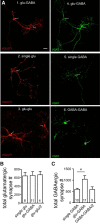
Glutamatergic input causes an increase in the number of GABAergic synapses. A, Representative image of immunofluorescence for a glu-GABA neuronal pair (A1, A4), a single glutamatergic neuron (A2), a glu-glu neuronal pair (A3), a single GABAergic neuron (A5), and a GABA-GABA neuronal pair (A6) stained with glutamatergic (left; VGLUT1; red) and GABAergic (right; VGAT; green) synapse markers. Scale bar, 20 μm. Note that the type of neurons were apparent by the somatic VGLUT1 and VGAT signals (indicated by arrows). B, Quantification of total number of glutamatergic synapses (VGLUT1 positive) for isolated glutamatergic neuron, glu-GABA pair, or glu-glu pair (per cell; glu-glu/2). C, Same as B, but for the GABAergic cell type; *p ≤ 0.05. All values are mean ± SEM. Numbers in bar graphs are n values.
Figure 4.
Figure 4.
Glutamatergic input increases number of active synapses in GABAergic neurons. A, Example image of a pair of neurons filled with intracellular Alexa Fluor 647 (100 μm; top left) in which each cell was stimulated with a 300 AP train at 20 Hz consecutively (bottom left; scheme right). For illustrative purposes, SypH 2X ΔF/F0 signal is represented in red for Cell 1 and green for Cell 2 (bottom left). The same color code is applied to the output PSCs (first 5 APs of 300 AP train) for each cell (right). Cell1 is GABAergic and Cell2 is glutamatergic. B, Examples of peak ΔF/F0 for SypH 2X with a 300 AP stimulation (20 Hz) in three individual cells from GABA-GABA pairs. Scale bar, 25 μm. Images are inverted for illustrative purposes and displayed on the same scale. C, Same as B, but cells are from glu-GABA pairs. D, Average area of SypH 2X ΔF/F0 activated above threshold for individual GABAergic neurons in glu-GABA and GABA-GABA pairs. *p ≤ 0.05. Values are mean ± SEM. Numbers in graph show n values.
Figure 5.
Figure 5.
Glutamatergic input-induced increase in GABAergic synapse density. A, B, Representative images showing colocalization of VGLUT1 (red) and VGAT (green) with a dendritic marker, MAP2 (blue), immunofluorescence signals on identified glutamatergic (A) and GABAergic (B) dendrites. VGLUT1 signals on the glutamatergic dendrite were considered autapses and VGAT signals were considered heterosynapses. On the GABAergic dendrite, VGAT signals were considered autapses and VGLUT1 signals were considered heterosynapses. Scale bar, 5 μm. C, Bar graph showing the mean synapse density (number of synapses per 100 μm of dendritic length) of autapses formed in single glutamatergic neurons or autaptic and heterosynaptic connections of glutamatergic neurons in glu-GABA neuronal pairs. **p ≤ 0.01; ***p ≤ 0.001. D, Same as C, but for GABAergic neurons. E, Bar graph of the mean length of glutamatergic or GABAergic dendrites measured in a glu-GABA neuronal pair and single neurons as identified by the colocalization of MAP2 and either VGLUT1 or VGAT positive signals in the soma. F, Bar graph showing estimated number of VGLUT1-positive signals from glu-GABA neuronal pairs (autaptic connections, heterosynaptic connections, and total) and single glutamatergic neurons calculated from measurements in C and E. G, Same as F, but for GABAergic synapse number calculated from measurements in D and E. For all bar graphs, **p ≤ 0.01; ***p ≤ 0.001. All values are mean ± SEM. Numbers in bar graphs are n values.
Figure 6.
Figure 6.
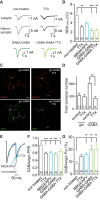
Activity modulates GABAergic synapse properties in glu-GABA pairs. A, Representative traces of GABAergic sucrose responses from paired recording of glu-GABA (top) and GABA-GABA (bottom) neuronal pairs with (black and light green, respectively) and without (gray and dark green, respectively) TTX treatment. Responses were recorded from autaptic and heterosynaptic connections of each GABAergic cell in glu-GABA neuronal pairs and from each GABAergic cell in GABA-GABA neuronal pairs. B, Bar graph showing the mean RRPGABA charges measured in glu-GABA pairs without (gray) and with TTX (black) or NBQX/APV (blue) treatment and GABA-GABA pairs with (light green) and without (dark green) TTX treatment. **p ≤ 0.01; ***p ≤ 0.001. C, Representative images of immunofluorescence for glu-GABA neuronal pairs stained with glutamatergic (top; VGLUT1; red) and GABAergic (bottom; VGAT; green) synapse markers without (left) and with (right) TTX. Note that the types of neurons were apparent by the somatic VGLUT1 and VGAT signals (indicated by arrows). Scale bar, 20 μm (D) Bar graph showing the total number of glutamatergic and GABAergic synapse in glu-GABA pairs without (control) and with TTX treatment. **p ≤ 0.01. E, Representative paired-pulse IPSC traces recorded from glutamatergic neurons in untreated (gray), TTX-treated (black), and NBQX/APV-treated (blue) glu-GABA pairs. F, G, Bar graph showing the mean values of GABAergic PPR (F) and Pvr (G) measured in glu-GABA pairs without (gray) and with (black) TTX or NBQX/APV (blue) treatment and GABA-GABA pairs with (light green) and without (dark green) TTX treatment. *p ≤ 0.05; **p ≤ 0.01; ***p ≤ 0.001. All values are mean ± SEM. Numbers in bar graphs are n values.
Figure 7.
Figure 7.
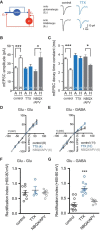
Activity-dependent modulation of glutamatergic input onto GABA neurons. A, Left, Scheme of autaptic (A) and heterosynaptic (H) connections made by a glutamatergic neuron in a glu-GABA pair. Right, Representative traces of mEPSCs recorded from glutamatergic (A: glutamatergic autapse; top) and GABAergic (H: glutamatergic heterosynapse; bottom) neurons without TTX (control, black) and with TTX (blue) treatment. B, Bar graph showing the mean mEPSC amplitudes measured in glutamatergic (A) and GABAergic (H) neurons in glu-GABA pairs without (white) and with TTX (blue) or NBQX/APV (gray) treatment. *p ≤ 0.05; ***p ≤ 0.001. C, Bar graph showing the mean mEPSC decay time constant measured in glutamatergic (A) and GABAergic (H) neurons in glu-GABA pairs without (white) and with TTX (blue) or NBQX/APV (gray) treatment. *p ≤ 0.05; ***p ≤ 0.001. D, Current-to-voltage relationship of the heterosynaptic connection in glu-glu pairs without (control) and with TTX or NBQX/APV treatment. E, Same as D, but with the glutamatergic heterosynaptic connection to GABAergic neurons in glu-GABA pairs. All values are mean ± SEM. Numbers in bar graphs are n values. F, Rectification index values of the heterosynaptic connection in glu-glu pairs without (control) and with TTX or NBQX/APV treatment. Rectification index values are determined by the ratio of peak amplitude +60 and −80 mV. ***p ≤ 0.001. G, Same as F, but with the glutamatergic heterosynaptic connection to GABAergic neurons in glu-GABA pairs. Symbols represent rectification index values for individual cells. Mean indicated by line (black) and error bars represent SEM.
Figure 8.
Figure 8.
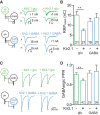
Suppression of glutamatergic neuronal activity by Kir2.1 prevents modulation of GABAergic output in glu-GABA pairs. A, Top, Schematic representation and representative traces of GABAergic sucrose responses (green) from paired recordings of glu-GABA neuronal pairs where Kir2.1 was specifically expressed in the glutamatergic neuron. Bottom, Schematic representation and representative traces of GABAergic sucrose responses (blue) from paired recordings of glu-GABA neuronal pairs in which Kir2.1 was specifically expressed in the GABAergic neuron. Autaptic GABAergic connections are indicated by A; H indicates heterosynaptic GABAergic connections. B, Bar graph showing the mean RRPGABA charges (sum of A and H) with either a Kir2.1 expressing (+) or a control vector infected (−) glutamatergic (green) or GABAergic (blue) neuron. **p ≤ 0.01. C, Top, Schematic representation and representative paired-pulse IPSC traces (green) from glu-GABA neuronal pairs where Kir2.1 was specifically expressed in the glutamatergic neuron. Bottom, Schematic representation and representative paired-pulse IPSC traces (blue) from glu-GABA neuronal pairs where Kir2.1 was specifically expressed in the GABAergic neuron. D, Bar graph showing the mean GABAergic PPR with either a Kir2.1-expressing (+) or a control vector infected (−) glutamatergic (green) or GABAergic (blue) neuron. **p ≤ 0.01. All values are mean ± SEM. Numbers in bar graphs are n values.
Figure 9.
Figure 9.
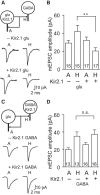
Suppression of glutamatergic neuronal activity by Kir2.1 prevents modulation of glutamatergic input onto GABAergic neurons in glu-GABA pairs. A, Top, Schematic representation of a glu-GABA neuronal pair where Kir2.1 specifically expressed in a glutamatergic neuron. Bottom, Representative traces of mEPSCs recorded from glutamatergic (A: glutamatergic autapse) and GABAergic (H: glutamatergic heterosynapse) neurons in glu-GABA pairs where the glutamatergic cell is Kir2.1-expressing (+) or control vector infected (−). B, Bar graph showing the mean values of mEPSC amplitudes measured in glutamatergic (A) or GABAergic (H) neurons in glu-GABA pairs with a Kir2.1 expressing (+) or control vector infected (−) glutamatergic cell. **p ≤ 0.01. C, D, Same as in A and B, but with Kir2.1 expression in the GABAergic neuron in a glu-GABA pair. All values are mean ± SEM. Numbers in bar graphs are n values.

Similar articles

Cited by

References

    1. Albert H, Dale EC, Lee E, Ow DW. Site-specific integration of DNA into wild-type and mutant lox sites placed in the plant genome. Plant J. 1995;7:649–659. doi: 10.1046/j.1365-313X.1995.7040649.x. - DOI - PubMed
    1. Araki K, Araki M, Yamamura K. Targeted integration of DNA using mutant lox sites in embryonic stem cells. Nucleic Acids Res. 1997;25:868–872. doi: 10.1093/nar/25.4.868. - DOI - PMC - PubMed
    1. Bats C, Soto D, Studniarczyk D, Farrant M, Cull-Candy SG. Channel properties reveal differential expression of TARPed and TARPless AMPARs in stargazer neurons. Nat Neurosci. 2012;15:853–861. doi: 10.1038/nn.3107. - DOI - PMC - PubMed
    1. Burrone J, O'Byrne M, Murthy VN. Multiple forms of synaptic plasticity triggered by selective suppression of activity in individual neurons. Nature. 2002;420:414–418. doi: 10.1038/nature01242. - DOI - PubMed
    1. Chao HT, Chen H, Samaco RC, Xue M, Chahrour M, Yoo J, Neul JL, Gong S, Lu HC, Heintz N, Ekker M, Rubenstein JL, Noebels JL, Rosenmund C, Zoghbi HY. Dysfunction in GABA signalling mediates autism-like stereotypies and Rett syndrome phenotypes. Nature. 2010;468:263–269. doi: 10.1038/nature09582. - DOI - PMC - PubMed

LinkOut - more resources