. 2014 Jan 15;34(3):980-91.
doi: 10.1523/JNEUROSCI.3725-13.2014.

Photoinactivation of glutamate receptors by genetically encoded unnatural amino acids

Affiliations

Photoinactivation of glutamate receptors by genetically encoded unnatural amino acids

Viktoria Klippenstein et al. J Neurosci. .

Abstract

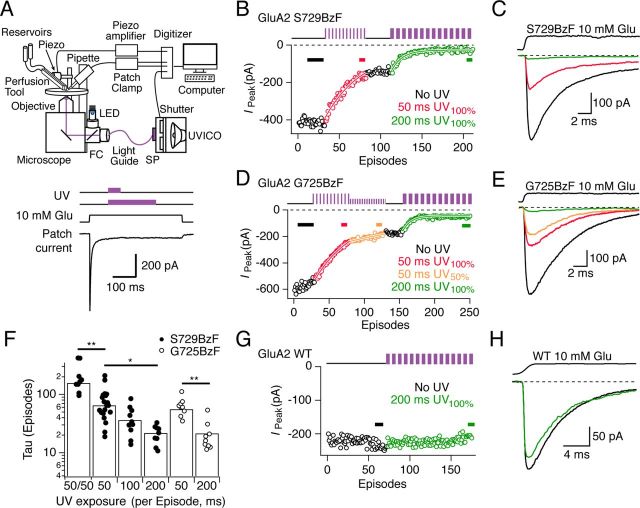
Ionotropic glutamate receptors (iGluRs) are ubiquitous in the mammalian brain, and the AMPA-subtype is essential for fast, glutamate-activated postsynaptic currents. We incorporated photoactive crosslinkers into AMPA receptors using genetically encoded unnatural amino acid mutagenesis in a mammalian cell line. Receptors rescued by incorporation of unnatural amino acids, including p-benzoyl-l-phenylalanine (BzF, also known as Bpa), had largely similar properties to wild-type channels and were expressed at similar levels. BzF incorporation at subunit interfaces afforded photocrosslinking of subunits, as assessed by biochemical experiments. In electrophysiological recordings, BzF incorporation allowed selective and potent UV-driven photoinactivation of both homomeric (GluA2) and heteromeric (GluA2:GluA1) AMPA receptors. State dependence of trapping at two sites in the lower lobe of the ligand binding domain is consistent with deformation of these domains as well as intersubunit rearrangements during AMPA receptor desensitization.

Keywords: UV light; benzophenone; crosslinking; mammalian cells; orthogonal tRNA; synthetase.


Figures

Figure 1.
Figure 1.
Sites of UAA incorporation and the design of the bicistronic dual Amber reporter. A, A single mRNA encodes GluA2 and eGFP, separated by an IRES site. Sites of interest within the LBD were replaced by a TAG stop codon (Amber) to be suppressed by incorporation of an exogenous UAA by an engineered orthogonal tRNA synthetase/tRNA pair. A further Amber codon at position Y40 in eGFP allows it to act as a reporter of UAA incorporation. B, Diagram of a glutamate-bound AMPA receptor dimer (glutamate is indicated as green spheres), including its LBD, the ATD, and the transmembrane domain (TMD). BzF (here shown as purple asterisks) and AzF were incorporated in the lower lobes of the LBD (D2). C, Side view of the glutamate-bound LBD dimer of GluA2 (PDB ID: 1FTJ, chains A and C) (Armstrong and Gouaux, 2000) with the same color coding as in B. Only one of the BzF side chains is shown for clarity. BzF was taken from the crystal structure of a p-Benzoyl-l-phenylalanyl-tRNA synthetase (PDB ID: 2HGZ) (Liu et al., 2007a) and was inserted at position 725 instead of glycine. D, View of the same dimer as in C from below. Both BzF side chains at position 725 are shown within the dimer.
Figure 2.
Figure 2.
Kinetic properties of GluA2 receptors harboring UAAs. A, The rate of desensitization for the GluA2 S729BzF mutant (here, kdes = 252 s−1) was similar to WT GluA2 (kdes = 135 s−1 in this example). Incorporation of AzF at position S729 resulted in 10-fold faster desensitization kinetics (for this trace, kdes = 1470 s−1). The S729Y mutant had fourfold faster desensitization (kdes = 435 s−1) than WT. B, Summary of desensitization rates of receptors carrying BzF or AzF (WT kdes = 121 ± 6 s−1, n = 22; S729BzF kdes = 186 ± 9 s−1, n = 20; G725BzF kdes = 197 ± 8 s−1, n = 22). One-way ANOVA gave p = 0.25 for S729BzF and p = 0.11 for G725BzF (WT was the control group). AzF at S729 produced receptors with kdes of 930 ± 80 s−1 (n = 15: *p < 0.0001). AzF at position G725 gave kdes of 171 ± 15 s−1 (n = 9; p = 0.75). S729Y produced receptors with kdes of 420 ± 40 s−1 (n = 5: *p < 0.0001). C, Deactivation after a brief (∼1 ms) pulse of 10 mm glutamate for GluA2 S729BzF and G725BzF mutants was similar to WT GluA2 (here, kdeact = 1910 s−1 for WT and kdeact = 1730 s−1for S729BzF). D, Summary of deactivation rates with BzF inserted at positions S729 or G725 (S729BzF kdeact = 1500 ± 120 s−1, n = 22; G725BzF kdeact = 1400 ± 200 s−1, n = 15), which were indistinguishable from those of WT receptors (WT kdeact = 1600 ± 150 s−1, n = 13; p = 0.98 for S729BzF and p = 0.86 for G725BzF). E, Seven overlaid traces show that recovery from desensitization for G725BzF (here, krec = 46 s−1) was similar to WT GluA2 (krec = 43 s−1). F, Summary of recovery rates of WT (krec = 40 ± 3 s−1, n = 10) and the BzF mutants G725 (krec = 23 ± 2.5 s−1, n = 8: *p = 0.03) and S729 (krec = 36 ± 2.8 s−1, n = 14; p = 0.89).
Figure 3.
Figure 3.
UV-induced reduction in peak current. A, Diagram of the setup used for electrophysiology coupled to photoinactivation. SP, SP400 short path filter; FC, filter cube. The path of UV light is indicated as a violet beam. Traces indicate the responses of outside-out patches to 10 mm glutamate applications and the timing of their exposure to UV (examples of 50 or 200 ms pulses are shown) during each episode. The repetition frequency was 0.5 Hz. The intensity of UV illumination was varied between either 50% or 100%. B, Example of the time course of receptor photoinactivation in full UV illumination for GluA2 S729BzF. Periods during which the patch was serially exposed to UV exposures (50 or 200 ms) are indicated schematically by violet pulse trains (not representative of the actual number of exposures). The circles represent the peak current activated by 10 mm glutamate in each episode. The rate of trapping was monoexponential (white outlined fits). The trapping rate was approximately threefold faster for the application of 200 ms pulses (τ = 13 episodes; shown as green circles) compared with shorter pulses of 50 ms (τ = 45; red). There is a lack of change in the current amplitude during brief periods without UV exposure (black circles). C, Example traces for GluA2 S729BzF illustrate the peak current reduction induced by UV exposures. The averages of 5–20 responses to 10 mm glutamate from the stretches indicated with bars in B are overlaid. D, For GluA2 G725BzF, the time course of trapping during a similar experiment to that in B is shown, with trapping rates similar to S729BzF (τ50 ms = 53 episodes, red circles; τ200 ms = 14 episodes, green). An additional series of exposures at 50% intensity was applied (τ50 ms = 144 episodes, orange). E, Equivalent to C, showing example average traces for GluA2 G725BzF during photoinactivation. Averaged stretches are indicated in D by color-coded bars. F, Summary of the exponential half-times (in episodes) of G725BzF/S729BzF mutant inactivation, plotted against the UV exposure periods per episode in milliseconds. The intensity of UV illumination was 100%, unless otherwise noted. The average time constants obtained for GluA2 S729BzF were as follows: τ50 ms 50% = 160 ± 27, n = 9; τ50 ms = 65 ± 8, n = 19; τ100 ms = 36 ± 6, n = 10; τ200 ms = 22 ± 2, n = 9. One-way ANOVA gave p50 ms 50% < 0.001; p100 ms = 0.21; p200 ms = 0.04 (50 ms exposure at 100% intensity was the control group). GluA2 G725 produced the following trapping rates: τ50 ms = 56 ± 6, n = 9; τ200 ms = 22 ± 4, n = 9, p = 0.0002 (Student's t test). The BzF mutants did not differ in regard to their rates of trapping at given exposure times (probability of no difference for 50 ms exposures = 0.38; for 200 ms pulses, p = 0.96). *p < 0.05. **p < 0.001. G, Kymogram of the peak current responses of WT receptors before and after exposure to UV (with 200 ms pulses per episode, green markers). WT receptors were unaffected by a cumulative UV exposure of 20 s. H, Example pre- and post-UV traces for WT receptors. Averages were done as in C.
Figure 4.
Figure 4.
Heteromeric receptors can be photoinactivated. A, Example kymogram for WT GluA1:GluA2 heteromeric receptors exposed to 200 ms pulses of UV in the desensitized state. Cumulative exposure of UV for this example was 14 s (indicated schematically as a pulse train; violet). Each marker (black, pre-UV; red, during UV application) represents the peak current during the appropriate episode. B, IV relations for GluA1 WT (blue curves) and WT GluA2:GluA1 heteromeric receptors (black curves for pre-UV; red curve for post-UV) in the presence of 30 μm spermine. The 20 s of cumulative UV did not induce any reduction in peak current for either condition (n = 4 for each IV relation). C, Example kymogram for the same experimental procedure as in A on A2 S729BzF:A1 receptors. The time course of trapping was monoexponential (white outlined fits), and the time constant for peak current reduction in this example was 24 episodes (4.8 s UV). The extent of trapping after a cumulative UV exposure of 20 s was 61%. D, IV relation before and after UV-induced photoinactivation for A2 S729BzF:A1. The linear IV relation (black curve) before UV exposure indicates a predominately heteromeric population of receptors (RRpre UV = 1.7 ± 0.04; n = 12). UV exposures of 20 s did not induce rectification (red curve; RRpost UV = 1.7 ± 0.1; n = 8; p = 0.72 vs before UV). E, As in A, an example kymogram for A2 G725BzF:A1 receptors exposed cumulatively to 20 s UV. The time course of trapping was monoexponential (white outlined fits) and the time constant of the current reduction for this example was 18 episodes (3.6 s UV), resulting in inhibition of the peak current by 74%. F, IV relation before and after UV-induced photoinactivation for A2 G725BzF:A1. The IV relation was linear before (black circles; RRpre UV = 1.5 ± 0.1, n = 13) and after UV exposure (20 s; red circles; RRpost UV = 1.4 ± 0.2, n = 7; p = 0.5 vs before UV). G, Summary of the extent of receptor trapping upon 20 s of cumulative UV. H, Summary of the exponential half-times (in episodes) for both BzF-containing heteromeric receptors. The average τ for S729BzF:A1 was 23 ± 2 episodes (n = 9) and for G725BzF:A1 receptors, τ = 25 ± 4 episodes (n = 6). The photoinactivation time course was not significantly different between the mutants (p = 0.84).
Figure 5.
Figure 5.
In vivo crosslinking produces UV-dependent dimerization of receptor subunits. A, Western blot of GluA2 WT and S729BzF 3 × Cys (−) receptors. The experiment was performed in reducing conditions. Monomeric GluA2 bands (M) were detected at ∼120 kDa. The cells were exposed to UV for time intervals between 2 and 30 min, resulting in an increasing dimerization (D) of GluA2 S729BzF, but not for WT subunits. The cotransfected FLAG-tagged tRNA synthetase was detected at ∼45 kDa. Because WT subunits were expressed to a greater extent, for the WT lanes, 1/20th of the elution was loaded, explaining the lower intensity of the synthetase bands. B, Summary of the dimer fraction (DF) detected after 30 min of continuous UV exposure. The DF did not differ between pre-UV and post-UV for WT 3 × Cys (−) (DFpre UV = 3 ± 1%, DFpost UV = 5.4 ± 1.8%, n = 11; *p = 0.166). For S729BzF 3 × Cys (−), UV exposure caused a significantly higher DF (DFpre UV = 1.6 ± 0.5%, DFpost UV = 15 ± 3%, n = 9; p = 0.002). C, Neither monomer (M) nor dimer (D) bands are detected by the anti-FLAG antibody against a C-terminal FLAG-tag in the absence of BzF for S729TAG mutants. The band corresponding to the coexpressed FLAG-tagged tRNA synthetase was, however, readily detected, indicating similar loading across S729 lanes. D, On the 3 × Cys (−) background, S729BzF receptors were trapped with an exponential time course upon 200 ms pulses of UV in the desensitized state (red markers), as receptors containing the native cysteines (see Fig. 3). Nonmutant receptors were insensitive to an equivalent UV treatment (blue markers). The example time courses of trapping shown in this kymogram were normalized to their maximal peak currents. E, Example traces for GluA2 WT and S729BzF on the 3 × Cys (−) background from the averages of 20 (black) or five traces (green, red, and blue) from the stretches indicated with color-coded bars in the kymogram in D.
Figure 6.
Figure 6.
Limited state dependence for S729 and G725. A, Peak current kymogram for WT GluA2 expressed on the tRNA/BzF tRNA synthetase background. Cumulative UV exposures of up to 14 s (200 ms per episode, shown schematically as a pulse train; violet) did not cause an UV-dependent current reduction in either the desensitized or active state. The active state was isolated by including 100 μm CTZ. The asterisk indicates the beginning of the CTZ application. Bars represent groups of traces averaged for B. B, Average responses to 10 mm glutamate for WT GluA2, averaged over ∼20 traces from stretches indicated by color-coded bars in A. C, Peak current reduction kymogram for the S729BzF mutant. White outlined fits to the current reduction in response to 3.5 s cumulative UV exposure in the desensitized state (red; τ = 18 episodes) and 20 s exposure in the active state (green; τ = 42 episodes) were monoexponential. Symbols and UV exposure schematic are as in A. D, As in B for the S729BzF mutant. Averages of 5–20 traces were taken. E, Kymogram, as C, for the G725BzF mutant. The exponential half-times of peak current reduction were 14 episodes for the desensitized state (red) and 37 episodes for the active state (green). Symbols and UV exposure schematic are as in A. F, Averages over groups of traces from stretches indicated by bars in E. G, Pooled, normalized current reduction curves were fit with single exponential decays with similar time constants for the S729BzF mutant in the active state (green; n = 5–9 patches for each point) and the desensitized state (red; 3–10 patches for each point). H, As for G, for the G725BzF exponential fits to pooled peak current reduction curves for the desensitized state (red; n = 4–8 patches for each point) and the active state (green; n = 3–6 patches for each point).
Figure 7.
Figure 7.
Properties of the M721BzF and Y768BzF mutants. A, The M721BzF mutation modeled into the active LBD dimer of GluA2 (PDB ID: 1FTJ, chains A and C). Same color scheme as in Figure 1, with BzF indicated in violet. Dashed line indicates the distance to the nearest C-H bond in the opposite subunit. B, The M721BzF mutation modeled into the candidate desensitized dimer (PDB ID: 2I3W). C, The Y768BzF mutation modeled into active LBD dimer of GluA2. D, The Y768BzF mutation modeled into the candidate desensitized dimer. E, Normalized responses to 400 ms pulses of 10 mm glutamate for M721BzF and Y768BzF mutants. The desensitization rates in the examples shown were kdes = 134 s−1 for M721BzF (circles) and kdes = 185 s−1 for Y768BzF (triangles). An equivalent decay from a WT patch is drawn as a dashed line. F, Summary of desensitization rates of receptors carrying BzF at positions M721 (kdes = 101 ± 6 s−1, n = 16; p = 0.99) and Y768 (kdes = 183 ± 6 s−1, n = 19; p = 0.31). Dashed line indicates the wild-type rate. G, Normalized responses to nominal 1 ms pulses of 10 mm glutamate for the M721BzF and Y768BzF mutants. The deactivation rates for the examples plotted here were kdeact = 1961 s−1 for M721BzF (circles) and kdeact = 617 s−1 for Y768BzF (triangles). A WT trace is shown as a dotted line for comparison. H, Summary of deactivation rates of M721BzF mutant (kdeact = 1400 ± 160 s−1, n = 7; p = 0.89) and the Y768BzF mutant (kdes = 700 ± 60 s−1, n = 11: p = 0.0008). Dashed line indicates the wild-type rate. I, Example time courses of recovery from desensitization for M721BzF and Y768BzF mutants (7 overlaid traces for each panel). J, Pooled recovery data for M721BzF (krec = 67 ± 9 s−1, n = 8: p = 0.0004) and Y768BzF (krec = 28 ± 3 s−1, n = 4; p = 0.3). WT GluA2 recovery is shown as a dotted line.
Figure 8.
Figure 8.
M721BzF and Y768BzF mutants are state-dependent. A, Peak current reduction kymogram for M721BzF for the desensitized state (red; 200 ms UV exposure per episode) and the active state (green; 300 ms UV exposures each episode). Monoexponential fits to the current reduction (fixed to a common minimum; for this example, τdes = 20 episodes; τactive = 270). Cumulative exposure of UV (200 or 300 ms per episode; shown schematically as a pulse train, violet) was 4 s in the desensitized state and 28 s in the active state. Asterisk indicates the point after which the patch was bathed in 100 μm CTZ. Representative average currents activated by 10 mm glutamate are shown, color-coded according to the bars in the kymogram. B, Summary of time constants for peak current reduction (in episodes) for the M721BzF mutant with UV exposures of 200 ms for active and desensitized states (τdes = 40 ± 8, n = 7; τactive = 140 ± 40, n = 5; *p = 0.04). C, Peak current reduction kymogram for Y768BzF for the desensitized state (red; 200 ms UV exposure per episode) and the active state (green; 300 ms UV exposures each episode). Monoexponential fits to the current reduction (fixed to a common minimum; τdes = 535 episodes; τactive = 17 for this example). Symbols and UV exposure schematic are as in A. Cumulative UV exposure was 9 s in the desensitized state and 17 s in the active state. Representative average currents activated by 10 mm glutamate are shown, color-coded according to the bars in the kymogram. D, Peak current reduction kymogram for Y768BzF with 200 ms UV exposures each episode in the desensitized (red) and resting states (green; in the presence of CTZ). Monoexponential fits to the current reduction (fixed to a common minimum; for this example, τdes = 1000 episodes; τactive = 25). Symbols and UV exposure schematic are as in A. Cumulative UV exposure was 5 s in the desensitized state and 22 s in the active state. There is a brief interval in the resting state trapping when no UV exposures were made (black circles). E, Summary of time constants for peak current reduction for the Y768BzF mutant for desensitized (τ = 400 ± 90 episodes, n = 8; p = 0.006 vs active state: *p = 0.005 vs resting state) and resting states (τ = 26 ± 5 episodes, n = 4; both 200 ms exposures per episode). For the active state, we saw no difference in the trapping time constant for 200 or 300 ms UV exposures per episode, and these were pooled (τ = 49 ± 6 episodes, n = 14 patches). F, Western blot (anti-FLAG antibody) for WT and Y768BzF receptors before and after a 30 min UV exposure. M, Monomer; D, dimer; MW, molecular weight marker.

References

    1. Adesnik H, Nicoll RA, England PM. Photoinactivation of native AMPA receptors reveals their real-time trafficking. Neuron. 2005;48:977–985. doi: 10.1016/j.neuron.2005.11.030. - DOI - PubMed
    1. Armstrong N, Gouaux E. Mechanisms for activation and antagonism of an AMPA-sensitive glutamate receptor: crystal structures of the GluR2 ligand binding core. Neuron. 2000;28:165–181. doi: 10.1016/S0896-6273(00)00094-5. - DOI - PubMed
    1. Armstrong N, Jasti J, Beich-Frandsen M, Gouaux E. Measurement of conformational changes accompanying desensitization in an ionotropic glutamate receptor. Cell. 2006;127:85–97. doi: 10.1016/j.cell.2006.08.037. - DOI - PubMed
    1. Beene DL, Dougherty DA, Lester HA. Unnatural amino acid mutagenesis in mapping ion channel function. Curr Opin Neurobiol. 2003;13:264–270. doi: 10.1016/S0959-4388(03)00068-0. - DOI - PubMed
    1. Carbone AL, Plested AJ. Coupled control of desensitization and gating by the ligand binding domain of glutamate receptors. Neuron. 2012;74:845–857. doi: 10.1016/j.neuron.2012.04.020. - DOI - PubMed

LinkOut - more resources