. 2013 Jun;7(1-2):51-62.
doi: 10.1007/s11693-013-9107-5. Epub 2013 Apr 17.

Lysine overproducing Corynebacterium glutamicum is characterized by a robust linear combination of two optimal phenotypic states

Affiliations

Lysine overproducing Corynebacterium glutamicum is characterized by a robust linear combination of two optimal phenotypic states

Meghna Rajvanshi et al. Syst Synth Biol. 2013 Jun.

Abstract

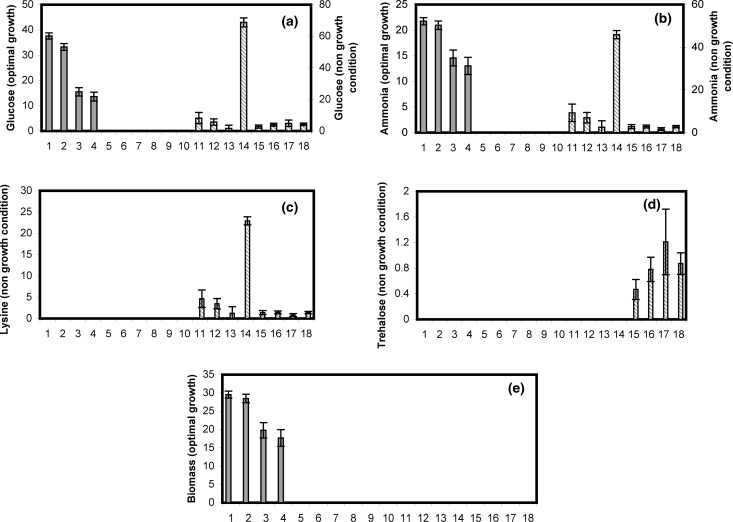
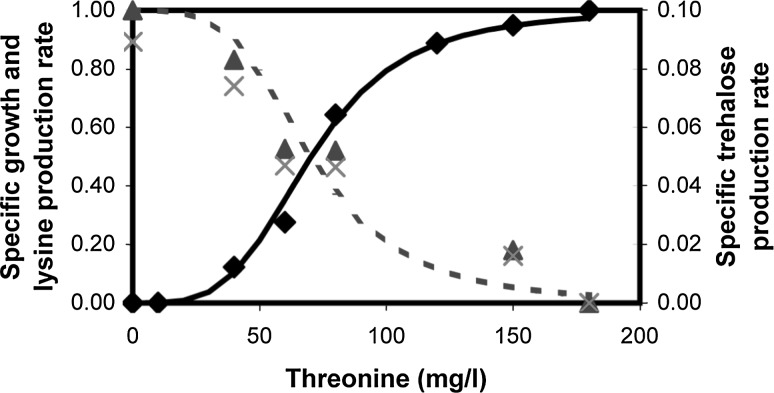
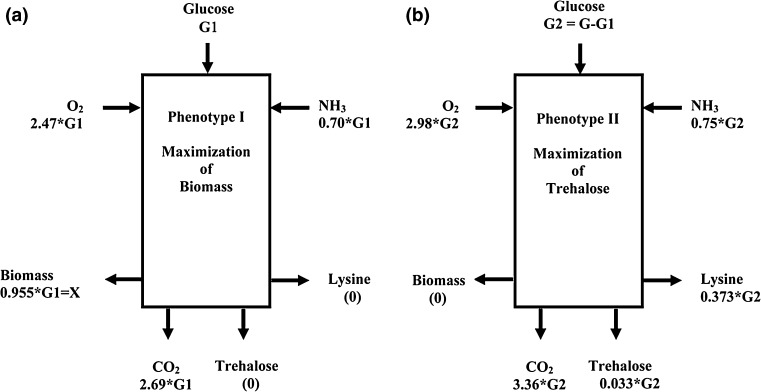
A homoserine auxotroph strain of Corynebacterium glutamicum accumulates storage compound trehalose with lysine when limited by growth. Industrially lysine is produced from C. glutamicum through aspartate biosynthetic pathway, where enzymatic activity of aspartate kinase is allosterically controlled by the concerted feedback inhibition of threonine plus lysine. Ample threonine in the medium supports growth and inhibits lysine production (phenotype-I) and its complete absence leads to inhibition of growth in addition to accumulating lysine and trehalose (phenotype-II). In this work, we demonstrate that as threonine concentration becomes limiting, metabolic state of the cell shifts from maximizing growth (phenotype-I) to maximizing trehalose phenotype (phenotype-II) in a highly sensitive manner (with a Hill coefficient of 4). Trehalose formation was linked to lysine production through stoichiometry of the network. The study demonstrated that the net flux of the population was a linear combination of the two optimal phenotypic states, requiring only two experimental measurements to evaluate the flux distribution. The property of linear combination of two extreme phenotypes was robust for various medium conditions including varying batch time, initial glucose concentrations and medium osmolality.

Keywords: Corynebacterium glutamicum; Elementary modes; Lysine; Optimal phenotypic state; Osmotic stress.


Figures

Fig. 1
Fig. 1
Lysine biosynthesis in homoserine auxotroph of C. glutamicum. Mutation causing inactivation of homoserine dehydrogenase (marked by X) resulted in inhibition of homoserine biosynthesis. This in turn resulted in release of feedback inhibition by threonine and lysine on aspartate kinase
Fig. 2
Fig. 2
Flux distribution maps of the two phenotypes. a Flux distribution for phenotype-I (maximization of biomass) obtained under high threonine condition, b Flux distribution for phenotype-II (maximization of trehalose) obtained under threonine starvation condition. Uptake rate of glucose and production rates of lysine, trehalose and biomass were used as constraints. The fluxes were expressed in mM/h and normalized with respect to glucose uptake rate
Fig. 3
Fig. 3
Quantification of fluxes through the elementary modes. Quantification of the fluxes of elementary modes gives insights regarding the modes active under the two phenotypic states discussed and contribution of total accumulation rates of various metabolites through the individual elementary modes. 14 elementary modes were obtained for central metabolism of C. glutamicum (Table S1). The modes demonstrate the conversion of the substrates [glucose (a), oxygen and ammonia (b)], to the products [lysine (c), trehalose (d) and biomass (e)]. Solid bars show modes active under the condition of biomass maximization (phenotype-I) and striped bars show modes active under trehalose maximizing condition (phenotype-II). The fluxes (in mM/h) were computed by linear programming using maximization of ammonia, CO2 and O2 as an objective function and average is shown as histogram with standard deviation. Uptake rate of glucose and production rates of lysine, trehalose and biomass were used as decision variables. Under the condition where cells were in phenotypic-I state, only first four modes were active leading to production of biomass (e) and under phenotypic-II state modes leading to lysine and trehalose production (11–18) were active (c and d)
Fig. 4
Fig. 4
Profiles of specific growth rate (Filled diamond), specific accumulation rate of lysine (Filled triangle) and trehalose (x). Profiles obtained at varying threonine concentrations and 8 g/l initial glucose concentration. Solid line shows specific growth rate fitted with a Hill equation in relation to threonine and dotted line shows lysine and trehalose accumulation rate fitted with Hill equation. Hill coefficients and half saturation constants of both the profiles were 4 and 70 mg/l, respectively
Fig. 5
Fig. 5
Evaluation of fluxes assuming linear combination of the two optimal phenotypes. a Maximization of biomass (phenotype-I) and b Maximization of trehalose (phenotype-II). Stoichiometric coefficients of various extracellular metabolites for the two phenotypes were obtained from Fig. 2. The analysis utilizes measurement of any two accumulation rates. The above figure demonstrates the evaluation method for glucose uptake rate (G) and biomass formation rate (X). G1 and G2 = (G − G1) are the fractions of the total glucose taken up by phenotype-I and phenotype-II, respectively. It can be observed that synthesis of lysine and trehalose is zero in phenotype-I while biomass production is zero in phenotype-II. Using the value of X, the fluxes of other variables can be evaluated for phenotype-I including G1. Further, G2 = (G − G1) can be used to determine the fluxes for phenotype-II
Fig. 6
Fig. 6
Comparison of the predicted accumulation rates of external metabolites obtained through linear combination of flux distribution for the two phenotypes using biomass and glucose accumulation rates for flux quantification, with experimental accumulation rates. Figures show comparison of (a) NH3 consumption rates (b) Lysine production rates (c) Biomass production rates (d) Trehalose production rates (e) O2 consumption rates and (f) CO2 evolution rates. Symbols indicate data from various experiments: experiment with 100 g/l initial glucose ‘open diamond’, 50 g/l initial glucose ‘open triangle’, 25 g/l initial glucose ‘filled diamond’, 100 g/l initial glucose with 25 g/l NaCl ‘asterisk’, 100 g/l initial glucose with 40 g/l NaCl ‘filled circle’, dynamic switching of phenotypic states controlled by threonine ‘open circle’, data reported by Vallino (Vallino 1991) ‘filled triangle’. g and h show the estimated fraction associated with glucose consumption rate for the two phenotypes during the course of fermentation with normal (100 g/l initial glucose concentration) and osmotic stress conditions (100 g/l glucose and 40 g/l NaCl), respectively
Fig. 7
Fig. 7
Comparative flux distribution profiles. Comparison of flux distribution using EMA (through specification of four constraints namely, accumulation rates of glucose, lysine, trehalose and biomass) (values shown in parentheses) with flux distribution obtained assuming linear combination of two optimal phenotypic states (as described in Fig. 5). Comparison of flux distribution at (a) t = 12 h for experimental condition with 100 g/l initial glucose concentration (b) t = 16 h for osmotic stress condition with 25 g/l NaCl and 100 g/l initial glucose concentration (c) t = 22 h for osmotic stress condition with 40 g/l NaCl and 100 g/l initial glucose concentration. For all the three experimental conditions, glucose concentration was kept at 100 g/l. All flux values are expressed in mM/h

Similar articles

Cited by

References

    1. Benjamin F, Christian T, Christian R, Jörn K, Ansgar P, Dirk Andreas W. Adaptation of Corynebacterium glutamicum to salt-stress conditions. Proteomics. 2010;10(3):445–457. doi: 10.1002/pmic.200900482. - DOI - PubMed
    1. Chen N, Du J, Liu H, Xu QY. Elementary mode analysis and metabolic flux analysis of l-glutamate biosynthesis by Corynebacterium glutamicum. Ann Microbiol. 2009;59(2):317–322. doi: 10.1007/BF03178334. - DOI
    1. Cocaign BM, Lindley ND. Pyruvate overflow and carbon flux within the central metabolic pathways of Corynebacterium glutamicum during growth on lactate. Amsterdam: Elsevier; 1995.
    1. Covert MW, Palsson BO. Transcriptional regulation in constraints-based metabolic models of Escherichia coli. J Biol Chem. 2002;277(31):28058–28064. doi: 10.1074/jbc.M201691200. - DOI - PubMed
    1. de Graaf AA (2000) Metabolic flux analysis of Corynebacterium glutamicum. In: Schügerl KB, Bellgardt KH (ed) Bioreaction engineering, modelling and control. Springer, New york, pp 506–555

LinkOut - more resources