

Citric acid effects on brain and liver oxidative stress in lipopolysaccharide-treated mice
- PMID: 24433072
- PMCID: PMC4026104
- DOI: 10.1089/jmf.2013.0065
Citric acid effects on brain and liver oxidative stress in lipopolysaccharide-treated mice
Abstract
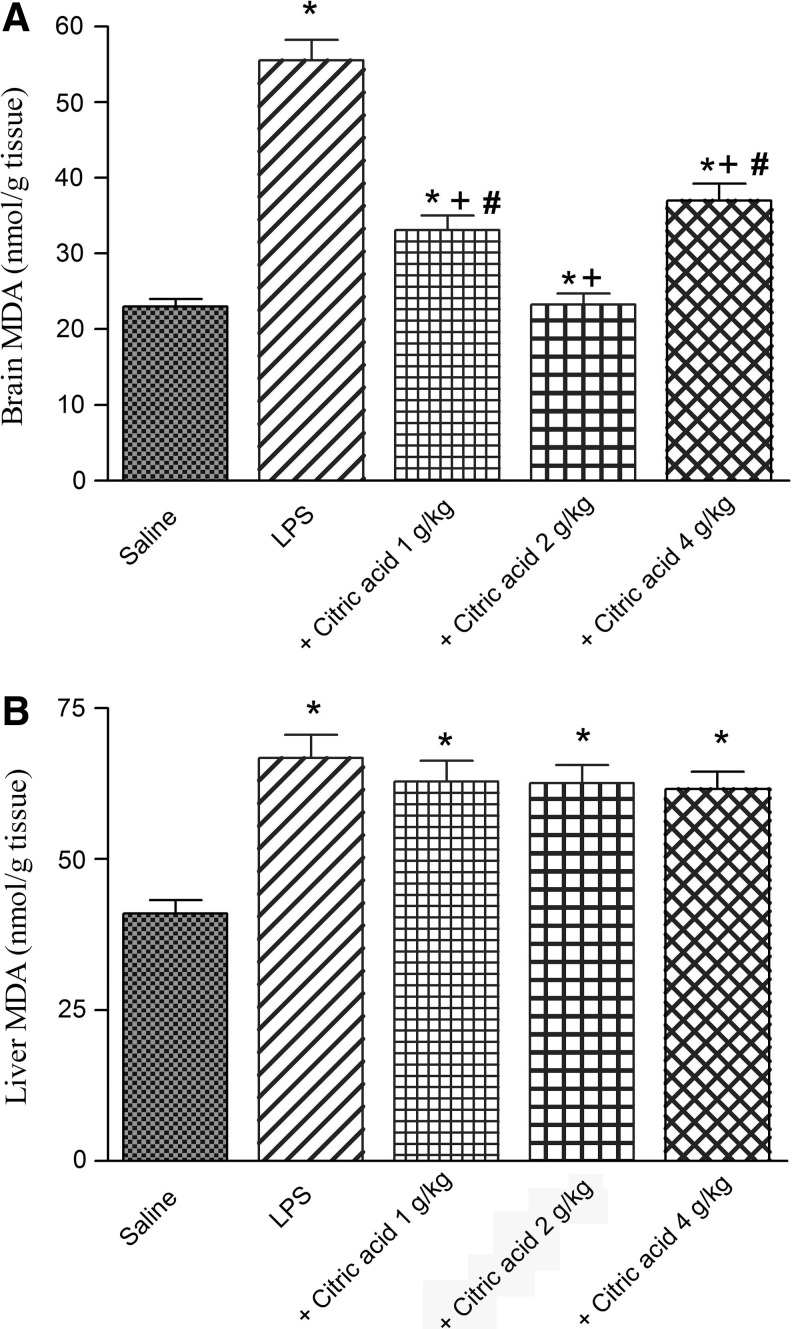
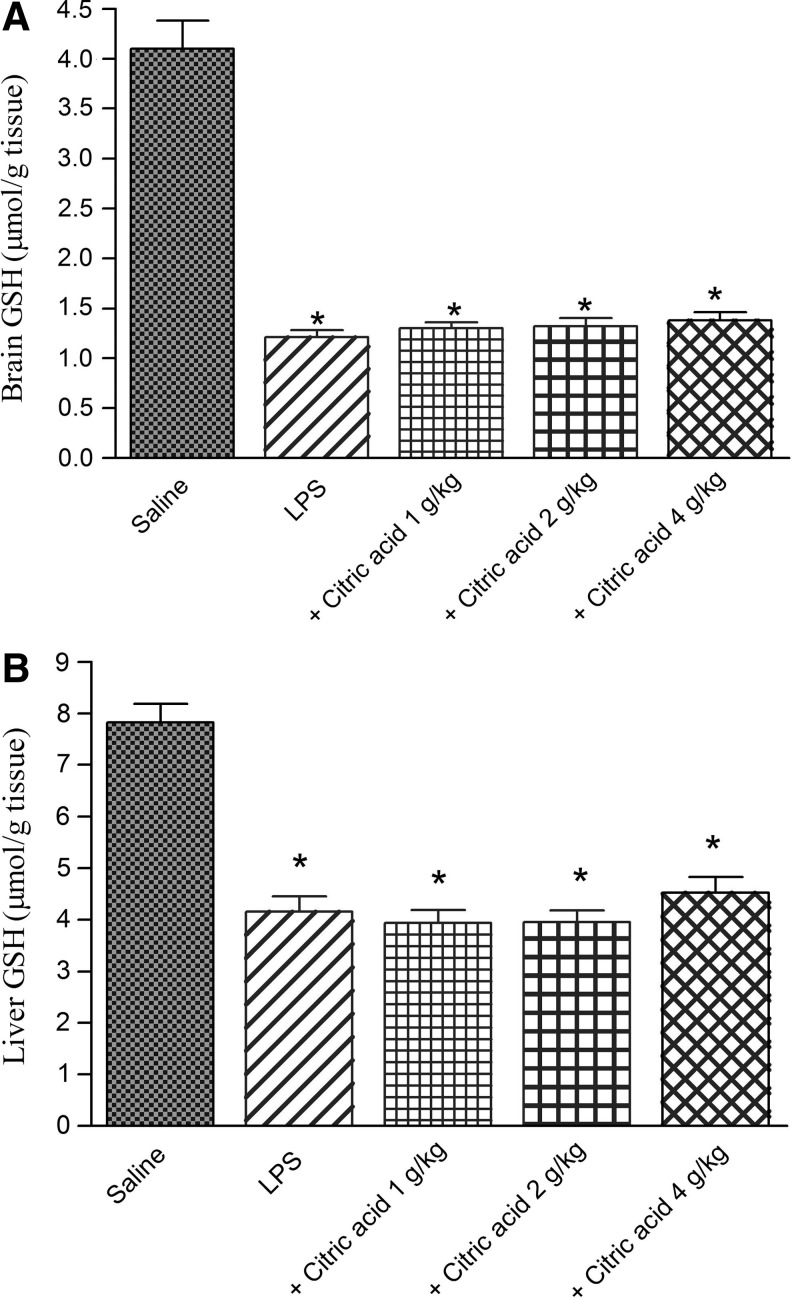
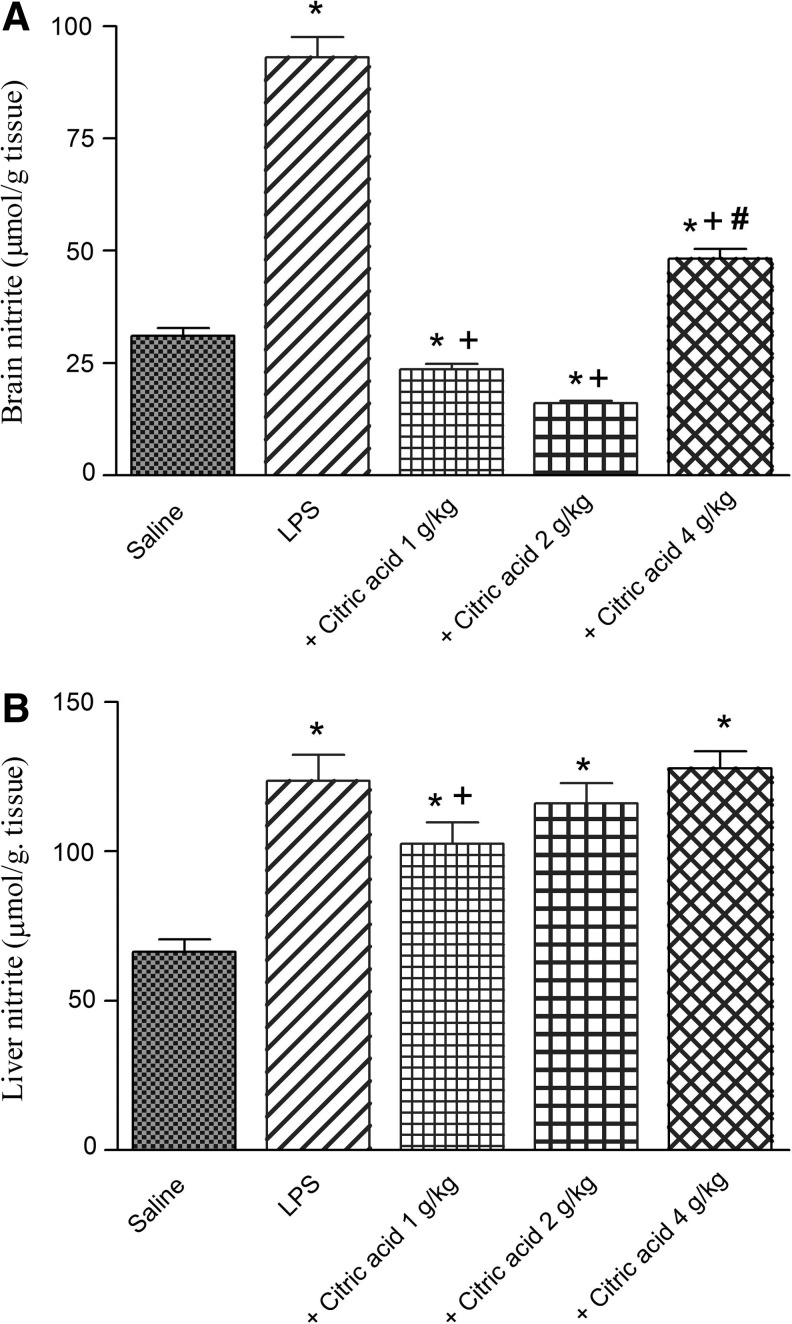
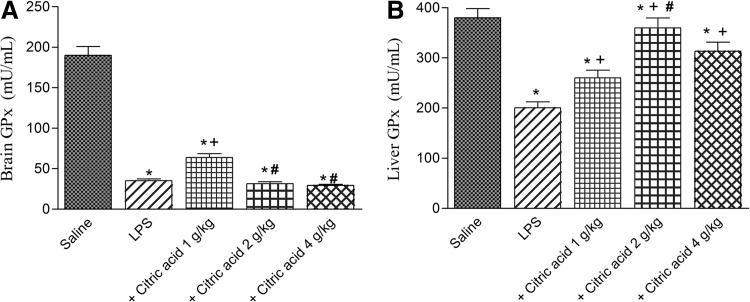
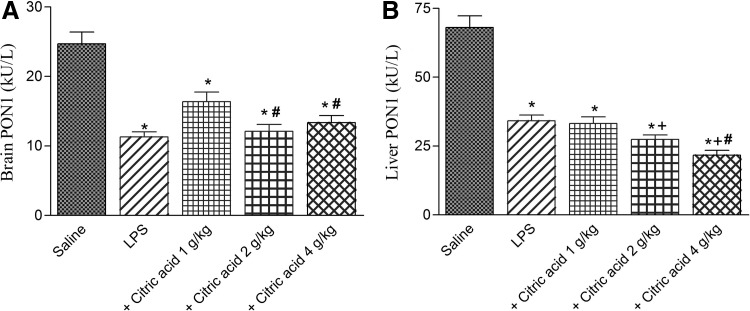
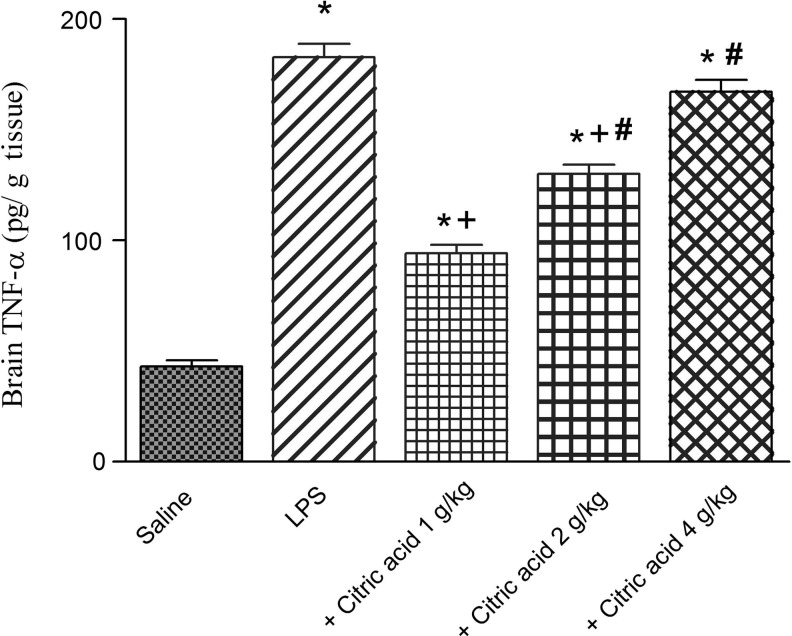
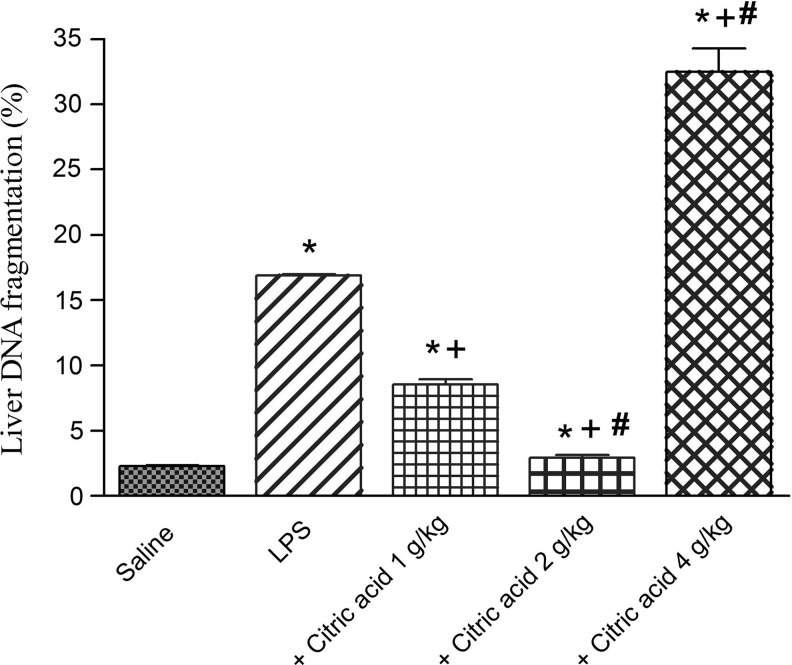
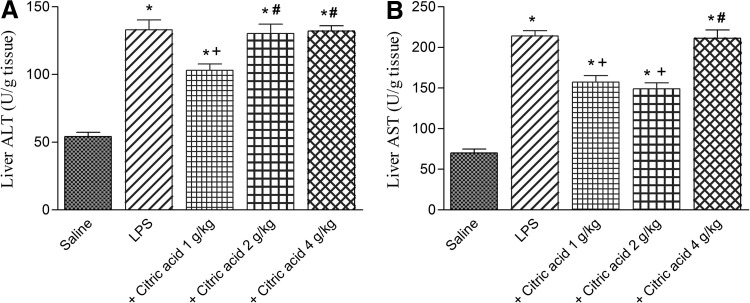
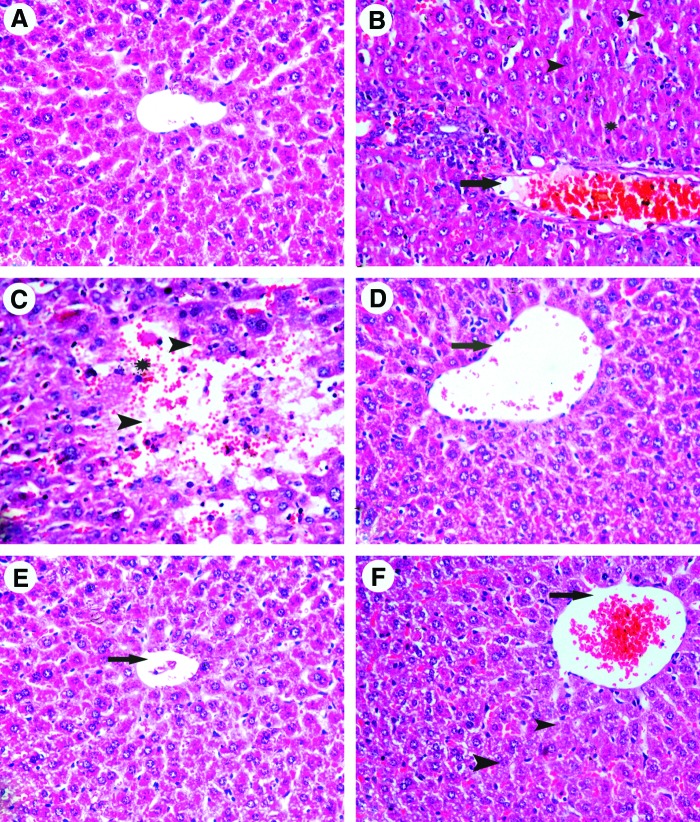
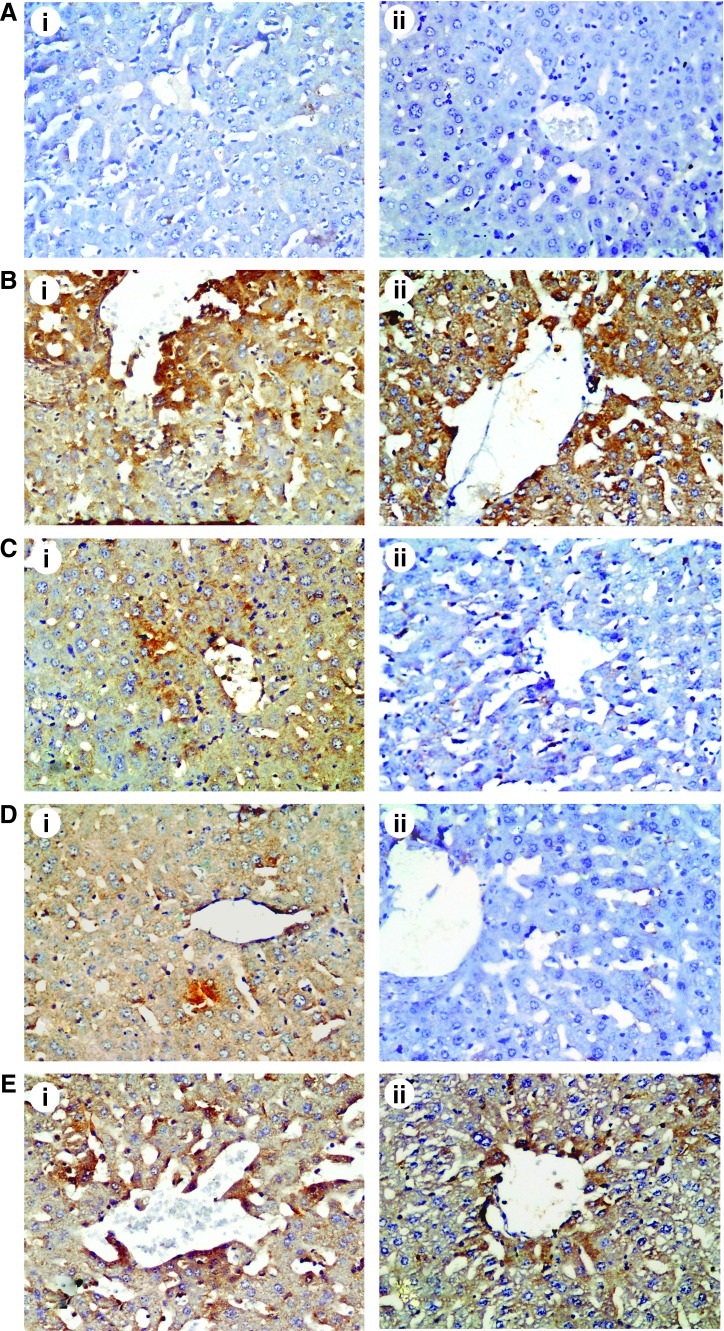
Citric acid is a weak organic acid found in the greatest amounts in citrus fruits. This study examined the effect of citric acid on endotoxin-induced oxidative stress of the brain and liver. Mice were challenged with a single intraperitoneal dose of lipopolysaccharide (LPS; 200 μg/kg). Citric acid was given orally at 1, 2, or 4 g/kg at time of endotoxin injection and mice were euthanized 4 h later. LPS induced oxidative stress in the brain and liver tissue, resulting in marked increase in lipid peroxidation (malondialdehyde [MDA]) and nitrite, while significantly decreasing reduced glutathione, glutathione peroxidase (GPx), and paraoxonase 1 (PON1) activity. Tumor necrosis factor-alpha (TNF-α) showed a pronounced increase in brain tissue after endotoxin injection. The administration of citric acid (1-2 g/kg) attenuated LPS-induced elevations in brain MDA, nitrite, TNF-α, GPx, and PON1 activity. In the liver, nitrite was decreased by 1 g/kg citric acid. GPx activity was increased, while PON1 activity was decreased by citric acid. The LPS-induced liver injury, DNA fragmentation, serum transaminase elevations, caspase-3, and inducible nitric oxide synthase expression were attenuated by 1-2 g/kg citric acid. DNA fragmentation, however, increased after 4 g/kg citric acid. Thus in this model of systemic inflammation, citric acid (1-2 g/kg) decreased brain lipid peroxidation and inflammation, liver damage, and DNA fragmentation.
Keywords: antioxidant activity; citric acid; cytokines; dietary supplementation; peripheral infection; systemic inflammation.
Figures
Similar articles
-
Neuroprotective and hepatoprotective effects of micronized purified flavonoid fraction (Daflon®) in lipopolysaccharide-treated rats.Drug Discov Ther. 2012 Dec;6(6):306-14. Drug Discov Ther. 2012. PMID: 23337818
-
Effect of aspartame on oxidative stress and monoamine neurotransmitter levels in lipopolysaccharide-treated mice.Neurotox Res. 2012 Apr;21(3):245-55. doi: 10.1007/s12640-011-9264-9. Epub 2011 Aug 6. Neurotox Res. 2012. PMID: 21822758
-
Novel neuroprotective and hepatoprotective effects of citric acid in acute malathion intoxication.Asian Pac J Trop Med. 2016 Dec;9(12):1181-1194. doi: 10.1016/j.apjtm.2016.11.005. Epub 2016 Nov 10. Asian Pac J Trop Med. 2016. PMID: 27955746
-
Dietary taurine supplementation attenuates lipopolysaccharide-induced inflammatory responses and oxidative stress of broiler chickens at an early age.J Anim Sci. 2020 Oct 1;98(10):skaa311. doi: 10.1093/jas/skaa311. J Anim Sci. 2020. PMID: 32954422 Free PMC article.
-
Modulation of lipopolysaccharide-induced oxidative stress by capsaicin.Inflammopharmacology. 2012 Aug;20(4):207-17. doi: 10.1007/s10787-011-0101-9. Epub 2011 Nov 30. Inflammopharmacology. 2012. PMID: 22127606
Cited by
-
Anthocyanins control neuroinflammation and consequent memory dysfunction in mice exposed to lipopolysaccharide.Mol Neurobiol. 2017 Jul;54(5):3350-3367. doi: 10.1007/s12035-016-9900-8. Epub 2016 May 11. Mol Neurobiol. 2017. PMID: 27167130
-
Exploring novel systemic biomarker approaches in grass-pollen sublingual immunotherapy using omics.Allergy. 2021 Apr;76(4):1199-1212. doi: 10.1111/all.14565. Epub 2020 Sep 22. Allergy. 2021. PMID: 32813887 Free PMC article. Clinical Trial.
-
Understanding the Central Role of Citrate in the Metabolism of Cancer Cells and Tumors: An Update.Int J Mol Sci. 2021 Jun 19;22(12):6587. doi: 10.3390/ijms22126587. Int J Mol Sci. 2021. PMID: 34205414 Free PMC article. Review.
-
Cell-based evaluation of anti-inflammatory activity from the combination of natural compounds in LPS-stimulated U937 monocytes.Cytotechnology. 2025 Jun;77(3):117. doi: 10.1007/s10616-025-00788-6. Epub 2025 Jun 7. Cytotechnology. 2025. PMID: 40491777
-
Effects of a Short-Term Lipopolysaccharides Challenge on Mouse Brain and Liver Peroxisomal Antioxidant and β-oxidative Functions: Protective Action of Argan Oil.Pharmaceuticals (Basel). 2022 Apr 12;15(4):465. doi: 10.3390/ph15040465. Pharmaceuticals (Basel). 2022. PMID: 35455460 Free PMC article.
References
-
- Halliwell B: Reactive oxygen species and the central nervous system. J Neurochem 1992;59:1609–1623 - PubMed
-
- Halliwell B: Biochemistry of oxidative stress. Biochem Soc Trans 2007;35:1147–1150 - PubMed
-
- Wickens AP: Ageing and the free radical theory. Respir Physiol 2001;128:379–391 - PubMed
-
- Gutteridge JMC: Lipid peroxidation and antioxidants as biomarkers of tissue damage. Clin Chem 1995;41:1819–1828 - PubMed
-
- Sies H: Oxidative stress: oxidants and antioxidants. Exp Physiol 1997;82:291–295 - PubMed
MeSH terms
Substances
LinkOut - more resources
Full Text Sources
Other Literature Sources
Research Materials
Miscellaneous
