. 2014 Jan 16:15:29.
doi: 10.1186/1471-2164-15-29.

Genome-wide transcriptome study in wheat identified candidate genes related to processing quality, majority of them showing interaction (quality x development) and having temporal and spatial distributions

Affiliations

Genome-wide transcriptome study in wheat identified candidate genes related to processing quality, majority of them showing interaction (quality x development) and having temporal and spatial distributions

Anuradha Singh et al. BMC Genomics. .

Abstract

Background: The cultivated bread wheat (Triticum aestivum L.) possesses unique flour quality, which can be processed into many end-use food products such as bread, pasta, chapatti (unleavened flat bread), biscuit, etc. The present wheat varieties require improvement in processing quality to meet the increasing demand of better quality food products. However, processing quality is very complex and controlled by many genes, which have not been completely explored. To identify the candidate genes whose expressions changed due to variation in processing quality and interaction (quality x development), genome-wide transcriptome studies were performed in two sets of diverse Indian wheat varieties differing for chapatti quality. It is also important to understand the temporal and spatial distributions of their expressions for designing tissue and growth specific functional genomics experiments.

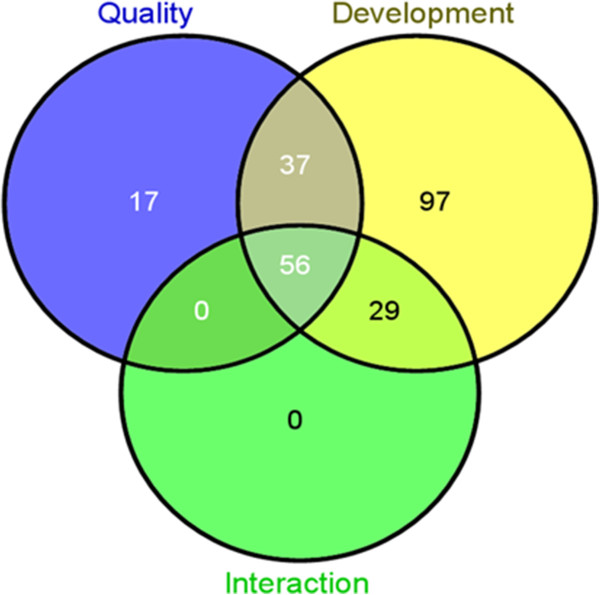
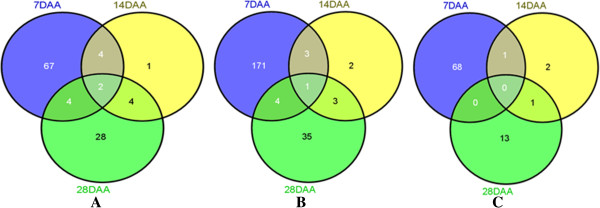
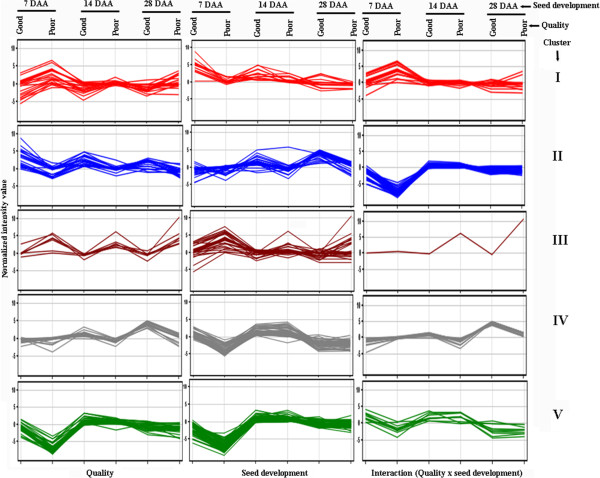
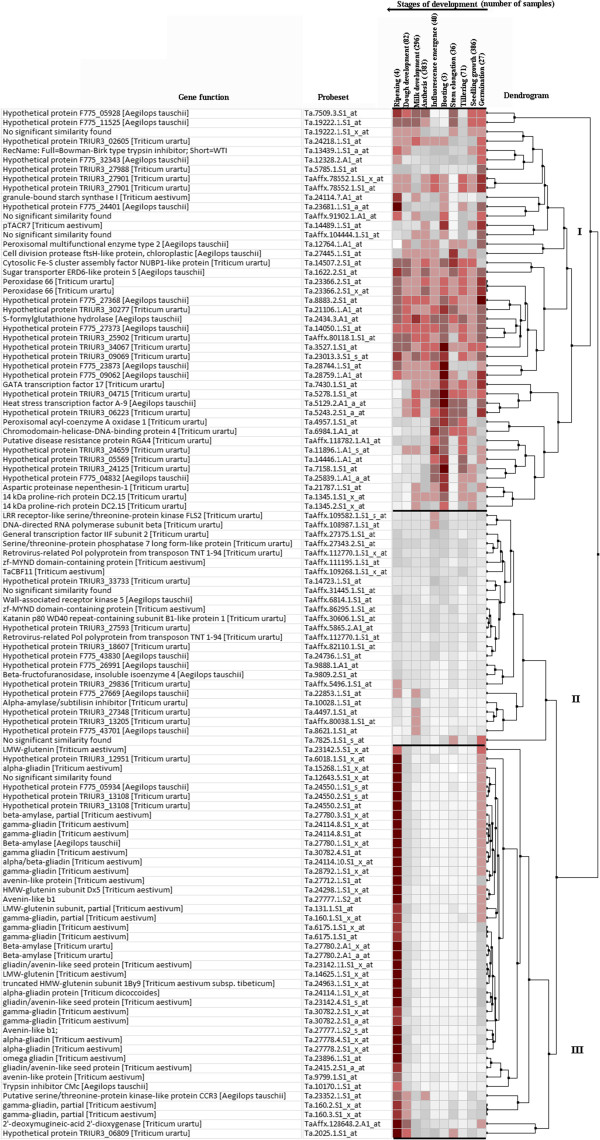
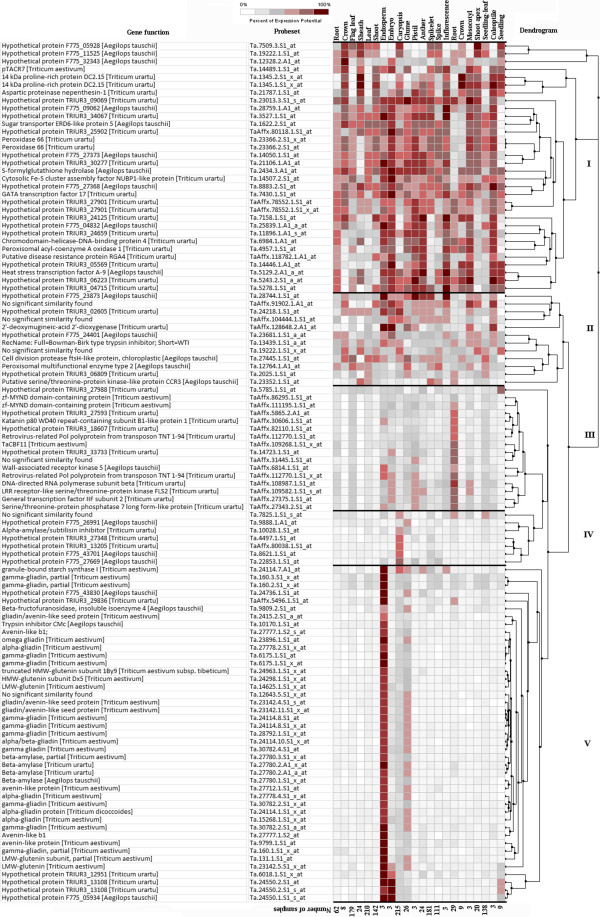
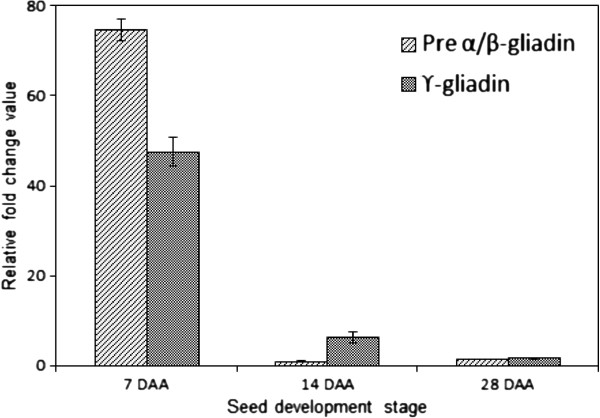
Results: Gene-specific two-way ANOVA analysis of expression of about 55 K transcripts in two diverse sets of Indian wheat varieties for chapatti quality at three seed developmental stages identified 236 differentially expressed probe sets (10-fold). Out of 236, 110 probe sets were identified for chapatti quality. Many processing quality related key genes such as glutenin and gliadins, puroindolines, grain softness protein, alpha and beta amylases, proteases, were identified, and many other candidate genes related to cellular and molecular functions were also identified. The ANOVA analysis revealed that the expression of 56 of 110 probe sets was involved in interaction (quality x development). Majority of the probe sets showed differential expression at early stage of seed development i.e. temporal expression. Meta-analysis revealed that the majority of the genes expressed in one or a few growth stages indicating spatial distribution of their expressions. The differential expressions of a few candidate genes such as pre-alpha/beta-gliadin and gamma gliadin were validated by RT-PCR. Therefore, this study identified several quality related key genes including many other genes, their interactions (quality x development) and temporal and spatial distributions.

Conclusions: The candidate genes identified for processing quality and information on temporal and spatial distributions of their expressions would be useful for designing wheat improvement programs for processing quality either by changing their expression or development of single nucleotide polymorphisms (SNPs) markers.


Figures

Figure 1
Figure 1
Venn diagrams showing the number of probe sets of the candidate genes identified for quality, seed development, and interaction (quality x seed development). The probe sets were identified by gene specific two-way ANOVA showing at least 10-fold differential expression between two good (C306 and Lok1) and poor (Sonalika and WH291) chapatti making varieties.
Figure 2
Figure 2
Venn diagrams showing the number of probe sets identified in three seed developmental stages i.e. 7, 14, and 28 days after anthesis (DAA) for (A) quality, (B) seed development, and (C) interaction (quality x seed development). (A): out of 110 probe sets involved in quality, 67, 1 and 28 probe sets were differentially expressed at 7, 14, and 28 DAA, respectively; (B): out of 219 probe sets involved in seed development, 171, 2, and 35 probe sets were differentially expressed at 7, 14, and 28 DAA, respectively; and (C): out of 85 probe sets involved in interaction of quality and development, 68, 2, and 13 probe sets were differentially expressed at 7, 14, and 28 DAA, respectively.
Figure 3
Figure 3
Clustering of the expression of probe sets identified for quality, seed development, and interaction (quality x seed development) into five clusters (I, II, III, IV, and V) in three seed developmental stages, namely, 7, 14, and 28 days after anthesis (DAA). The cluster analysis was done to identify co-expressed genes using GeneSpring software (Agilent Tech, Santa Clara, USA).
Figure 4
Figure 4
A heat map of the 110 probe sets (identified for quality) indicating level of expression potentials in 10 development stages such as germination, seedling growth, tillering, stem elongation, booting, inflorescence emergence, anthesis, milk development, dough development, and ripening. The expression potentials of the 110 probe sets were estimated in 1,328 samples which were available in the Affymetrix®’s Triticum aestivum microarray database. The darkest red color represents the highest level of probe set expression potential. The expression potential is defined as the average of the top 1% signal values across all samples for a given probe set in a given platform. The heat map was generated in Genevestigator (Nebion AG, Zurich, Switzerland).
Figure 5
Figure 5
A heat map of the 110 probe sets (identified for quality) indicating level of expression potentials in 22 wheat tissues such as endosperm, glume, caryopsis, embryo, leaf, root, coleoptile, mesocotyl, seedling, sheath, shoot, shoot apex, leaf, flag leaf, crown, inflorescence, spikelet, pistil, anther, glumes, caryopsis, endosperm, embryo. The expression potentials of the 110 probe sets were estimated in 1,405 samples available in the Affymetrix®’s Triticum aestivum microarray database. The darkest red color represents the highest level of probe set expression. The expression potential is defined as the average of the top 1% signal values across all samples for a given probe set in a given platform. The heat map was generated in Genevestigator (Nebion AG, Zurich, Switzerland). ‘Root’ labelled at 16th column of the heatmap represents ‘roots of seedling’. ‘Crown’ labelled at 17th column of the heatmap represents ‘Crown of seedling’.
Figure 6
Figure 6
Validation of differential expression (fold change) of two randomly chosen candidate genes (pre-α/β-gliadin and γ-Gliadin) at three seed development stages using qRT-PCR. The validation was done between a good (C306) and a poor (Sonalika) chapatti quality varieties in 7, 14, and 28 days after anthesis (DAA) of seed developmental stage through quantitative real time PCR (qRT-PCR). Y-axis represents fold change in differential expression of genes in the wheat variety, C306 in comparison to the wheat variety, Sonalika. X-axis represents three seed development stages i.e. 7, 14, and 28 DAA. The expression data were normalized to that of a control gene, ADP ribosylation factor, ARF. qRT-PCR data analysis was done following Livak and Schmitteng (2001) [46].

References

    1. Shewry PR, Halford NG. Cereal seed storage proteins: structures, properties and role in grain utilization. J Exp Bot. 2002;15:947–958. doi: 10.1093/jexbot/53.370.947. - DOI - PubMed
    1. Kim W, Johnson JW, Graybosch RA, Gaines CS. Physicochemical properties and end-use quality of wheat starch as a function of waxy protein alleles. J Cereal Sci. 2003;15:195–204. doi: 10.1006/jcrs.2002.0494. - DOI
    1. McCallum JA. Biochemistry of phenolic compounds in wheat grain (Triticum aestivum L.). PhD thesis. New Zealand, University of Canterbury, Christchurch. 1989. New Zealand.
    1. Laudencia-Chingcuanco DL, Stamova BS, You FM, Lazo GR, Beckles DM, Anderson OD. Transcriptional profiling of wheat caryopsis development using cDNA microarrays. Plant Mol Biol. 2007;15:651–668. doi: 10.1007/s11103-006-9114-y. - DOI - PubMed
    1. Stamova BS, Laudencia-Chingcuanco D, Beckles DM. Transcriptomic analysis of starch biosynthesis in the developing grain of hexaploid wheat. Int J Plant Genomics. 2009. doi:10.1155/2009/407426. - PMC - PubMed

MeSH terms