

Influence of covariate distribution on the predictive performance of pharmacokinetic models in paediatric research
- PMID: 24433411
- PMCID: PMC4168389
- DOI: 10.1111/bcp.12322
Influence of covariate distribution on the predictive performance of pharmacokinetic models in paediatric research
Abstract
Aims: The accuracy of model-based predictions often reported in paediatric research has not been thoroughly characterized. The aim of this exercise is therefore to evaluate the role of covariate distributions when a pharmacokinetic model is used for simulation purposes.
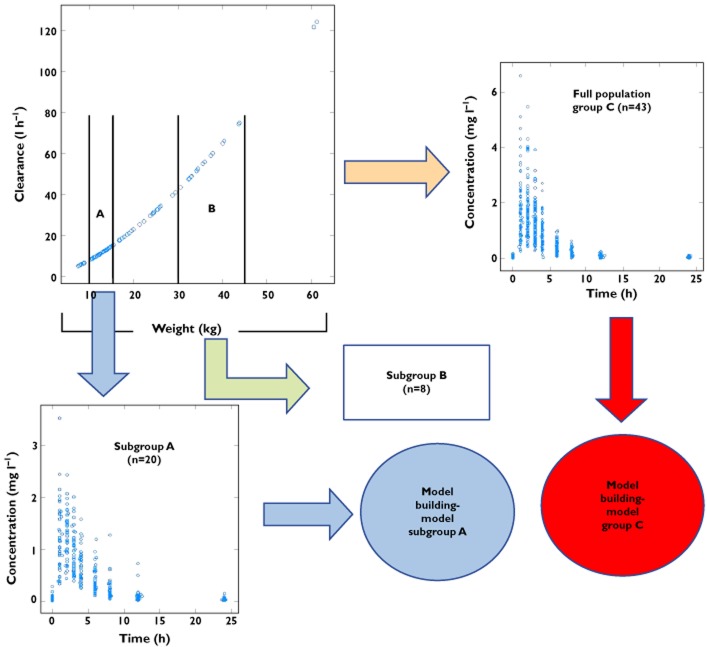
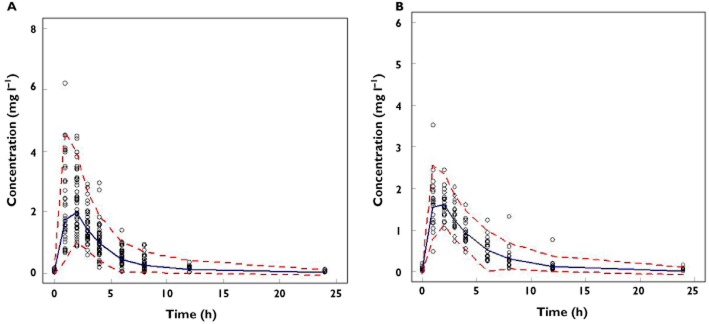
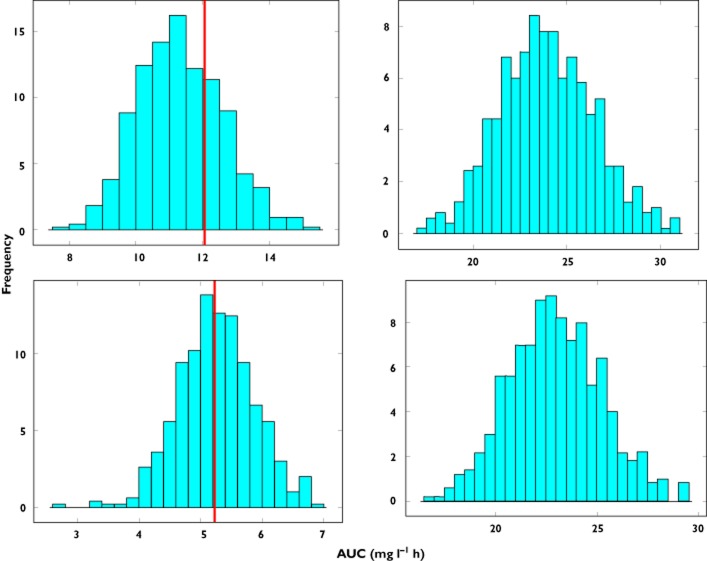
Methods: Plasma concentrations of a hypothetical drug were simulated in a paediatric population using a pharmacokinetic model in which body weight was correlated with clearance and volume of distribution. Two subgroups of children were then selected from the overall population according to a typical study design, in which pre-specified body weight ranges (10-15 kg and 30-40 kg) were used as inclusion criteria. The simulated data sets were then analyzed using non-linear mixed effects modelling. Model performance was assessed by comparing the accuracy of AUC predictions obtained for each subgroup, based on the model derived from the overall population and by extrapolation of the model parameters across subgroups.
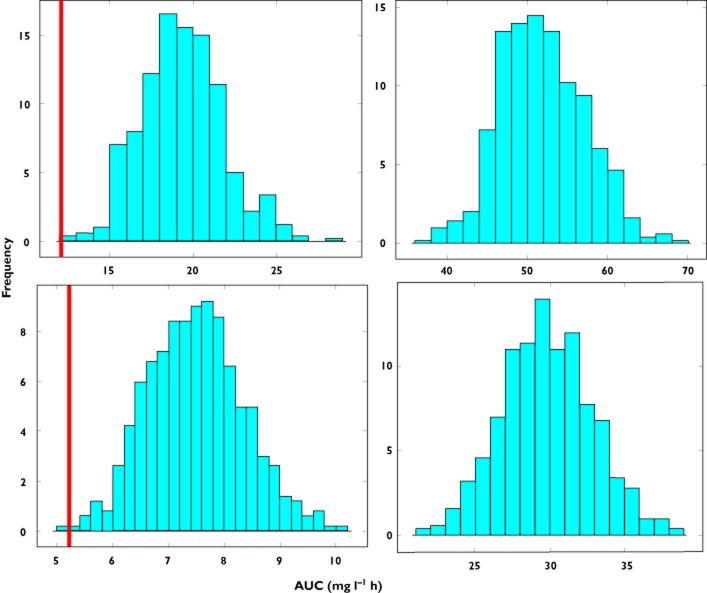
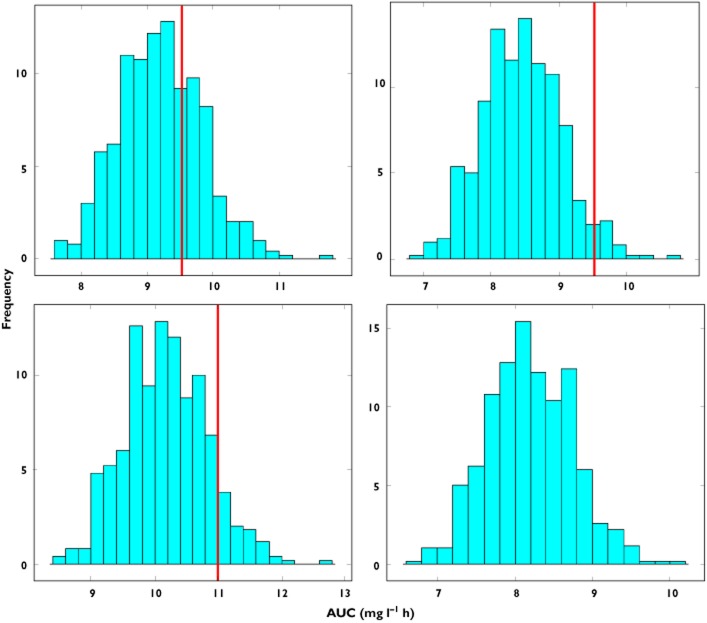
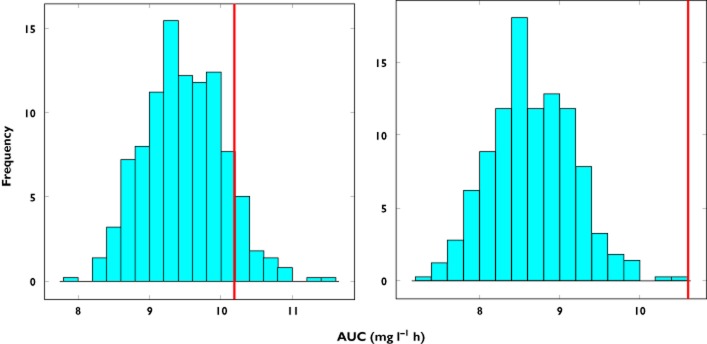
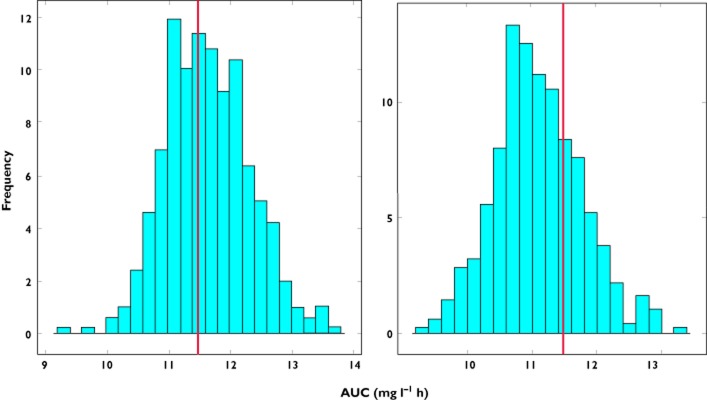
Results: Our findings show that systemic exposure as well as pharmacokinetic parameters cannot be accurately predicted from the pharmacokinetic model obtained from a population with a different covariate range from the one explored during model building. Predictions were accurate only when a model was used for prediction in a subgroup of the initial population.
Conclusions: In contrast to current practice, the use of pharmacokinetic modelling in children should be limited to interpolations within the range of values observed during model building. Furthermore, the covariate point estimate must be kept in the model even when predictions refer to a subset different from the original population.
Keywords: covariates; model predictive power; paediatrics; simulations.
© 2014 The British Pharmacological Society.
Figures
Similar articles
-
Population pharmacokinetics and maximum a posteriori probability Bayesian estimator of abacavir: application of individualized therapy in HIV-infected infants and toddlers.Br J Clin Pharmacol. 2012 Apr;73(4):641-50. doi: 10.1111/j.1365-2125.2011.04121.x. Br J Clin Pharmacol. 2012. PMID: 21988586 Free PMC article.
-
Covariate effects and population pharmacokinetics of lamivudine in HIV-infected children.Br J Clin Pharmacol. 2014 May;77(5):861-72. doi: 10.1111/bcp.12247. Br J Clin Pharmacol. 2014. PMID: 24118070 Free PMC article.
-
Power, selection bias and predictive performance of the Population Pharmacokinetic Covariate Model.J Pharmacokinet Pharmacodyn. 2004 Apr;31(2):109-34. doi: 10.1023/b:jopa.0000034404.86036.72. J Pharmacokinet Pharmacodyn. 2004. PMID: 15379381
-
Prediction of morphine clearance in the paediatric population : how accurate are the available pharmacokinetic models?Clin Pharmacokinet. 2012 Nov;51(11):695-709. doi: 10.1007/s40262-012-0006-9. Clin Pharmacokinet. 2012. PMID: 23018467 Review.
-
A Physiologically-Based Pharmacokinetic Model to Describe Ciprofloxacin Pharmacokinetics Over the Entire Span of Life.Clin Pharmacokinet. 2018 Dec;57(12):1613-1634. doi: 10.1007/s40262-018-0661-6. Clin Pharmacokinet. 2018. PMID: 29737457 Free PMC article. Review.
Cited by
-
Can Population Pharmacokinetics of Antibiotics be Extrapolated? Implications of External Evaluations.Clin Pharmacokinet. 2021 Jan;60(1):53-68. doi: 10.1007/s40262-020-00937-4. Clin Pharmacokinet. 2021. PMID: 32960439 Review.
-
Generating Virtual Patients by Multivariate and Discrete Re-Sampling Techniques.Pharm Res. 2015 Oct;32(10):3228-37. doi: 10.1007/s11095-015-1699-x. Epub 2015 May 21. Pharm Res. 2015. PMID: 25994981 Free PMC article.
-
β-lactam precision dosing in critically ill children: Current state and knowledge gaps.Front Pharmacol. 2022 Dec 1;13:1044683. doi: 10.3389/fphar.2022.1044683. eCollection 2022. Front Pharmacol. 2022. PMID: 36532752 Free PMC article. Review.
-
Improving clinical paediatric research and learning from COVID-19: recommendations by the Conect4Children expert advice group.Pediatr Res. 2022 Apr;91(5):1069-1077. doi: 10.1038/s41390-021-01587-3. Epub 2021 Jun 7. Pediatr Res. 2022. PMID: 34099854 Free PMC article.
-
Effect of Age-Related Factors on the Pharmacokinetics of Lamotrigine and Potential Implications for Maintenance Dose Optimisation in Future Clinical Trials.Clin Pharmacokinet. 2018 Aug;57(8):1039-1053. doi: 10.1007/s40262-017-0614-5. Clin Pharmacokinet. 2018. PMID: 29363050
References
Publication types
MeSH terms
Substances
LinkOut - more resources
Full Text Sources
Other Literature Sources
Medical
