. 2014 Apr:181:37-48.
doi: 10.1016/j.autneu.2013.12.010. Epub 2013 Dec 23.

Distribution and morphology of calcitonin gene-related peptide and substance P immunoreactive axons in the whole-mount atria of mice

Affiliations

Distribution and morphology of calcitonin gene-related peptide and substance P immunoreactive axons in the whole-mount atria of mice

Liang Li et al. Auton Neurosci. 2014 Apr.

Abstract

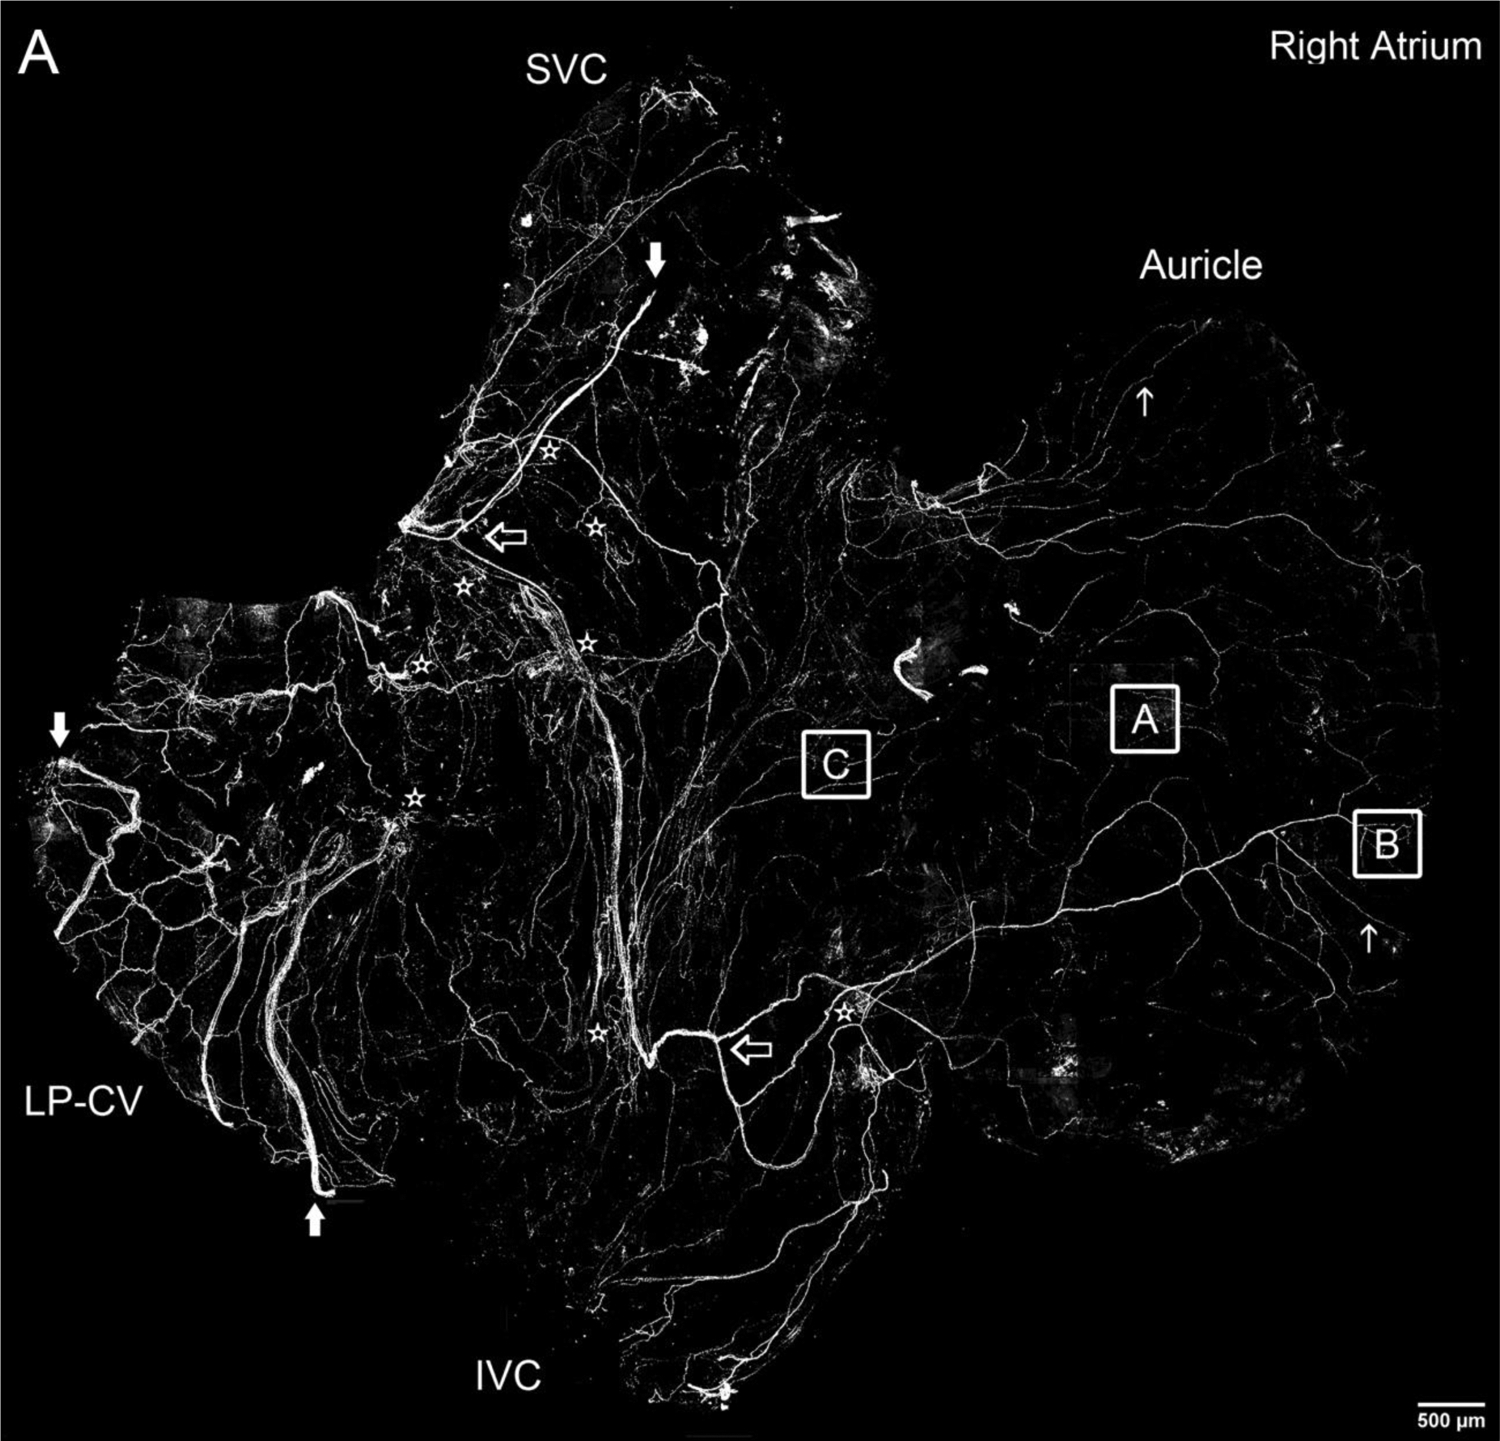
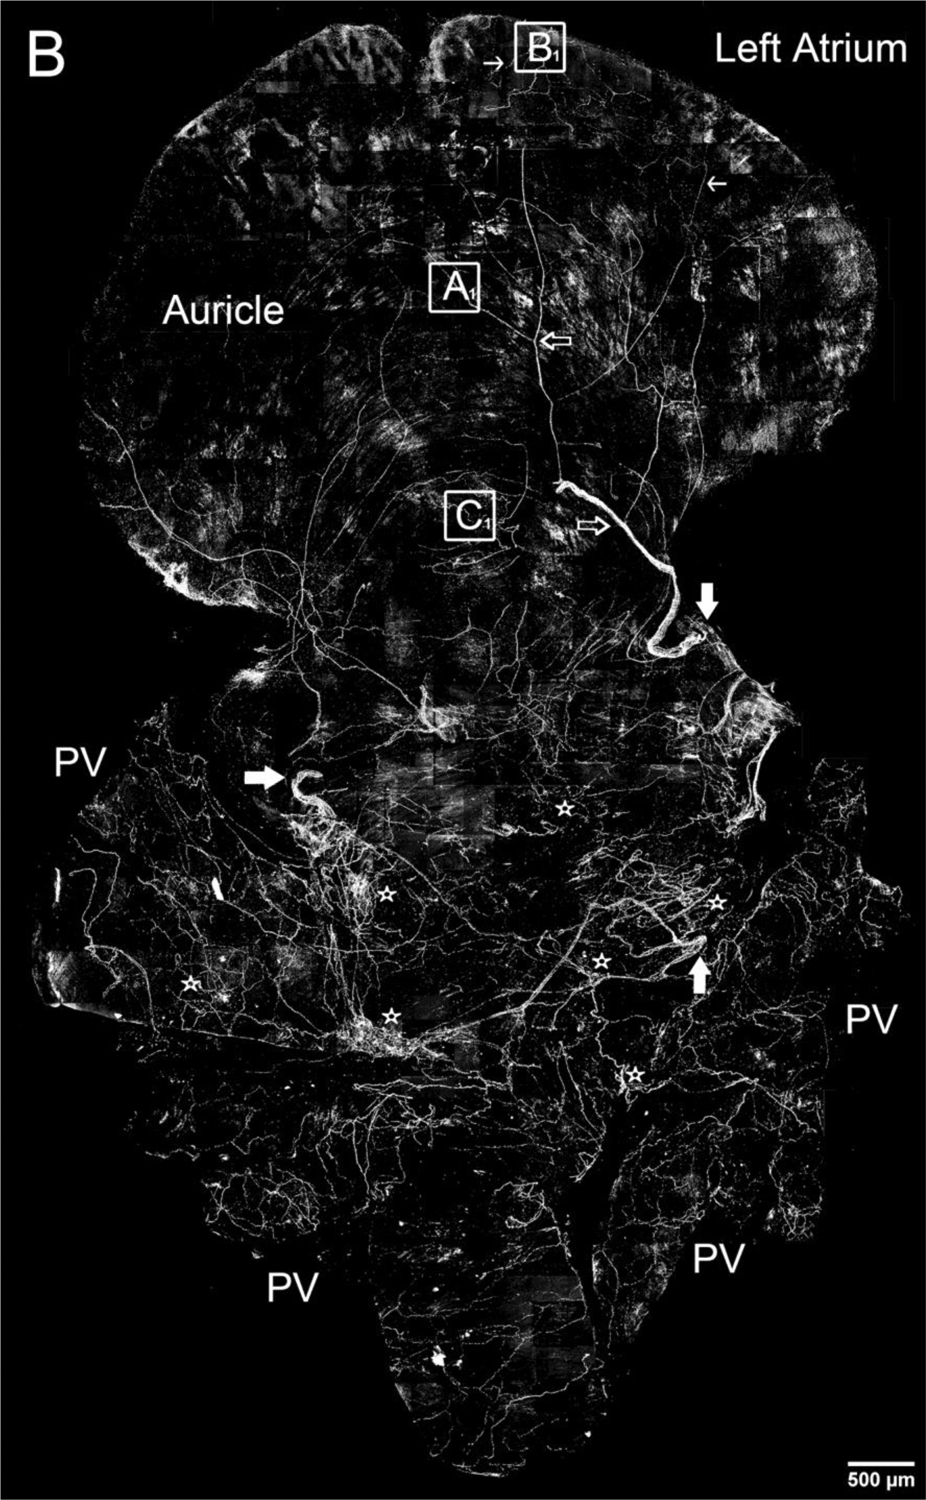
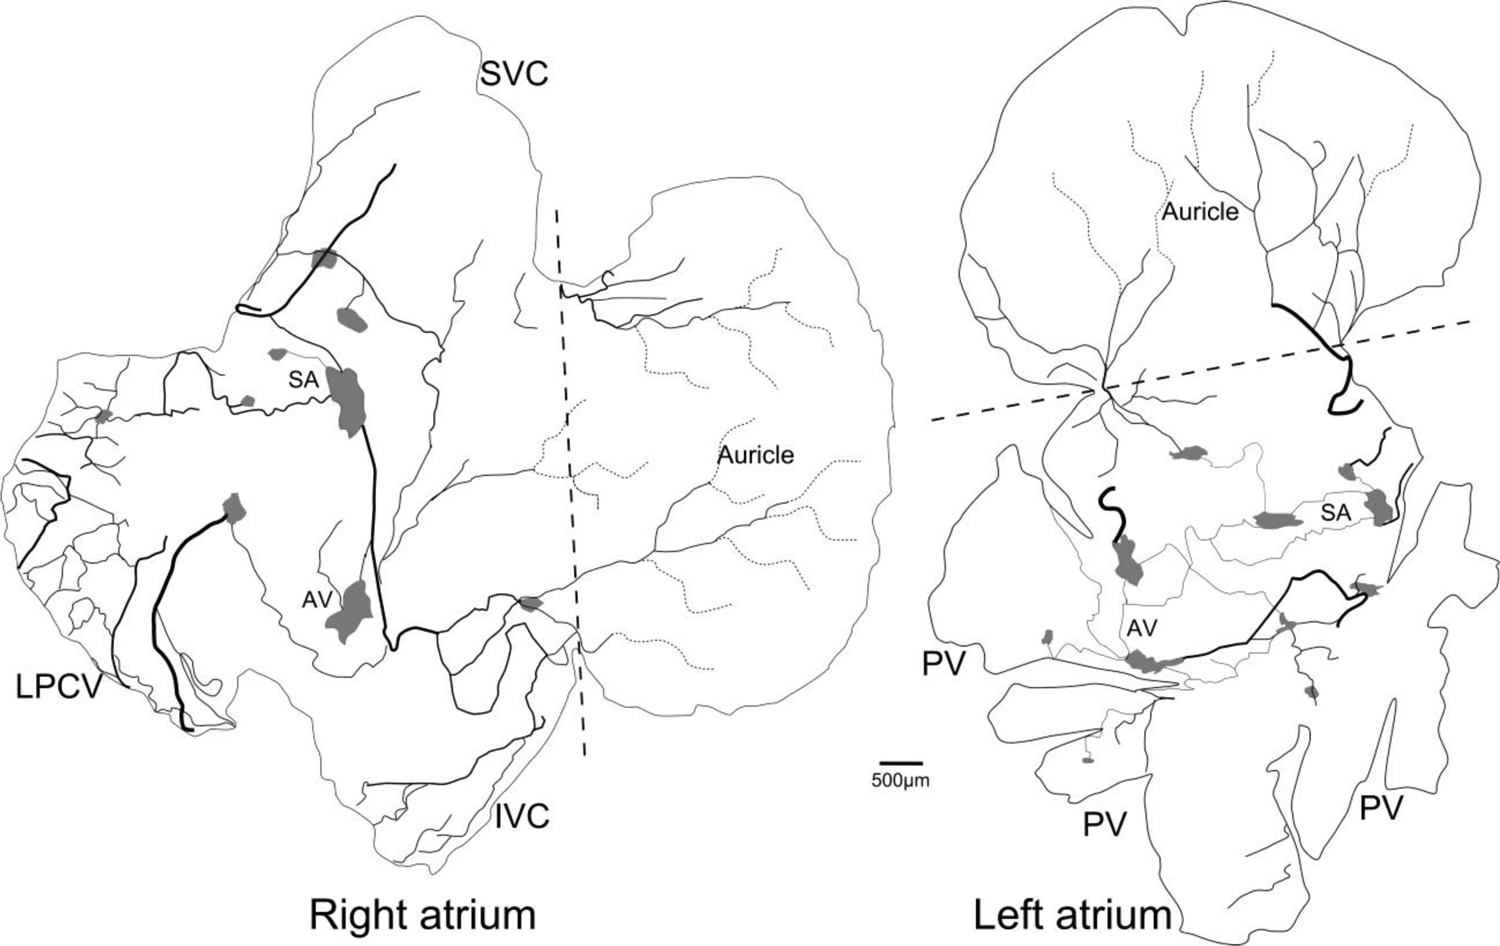
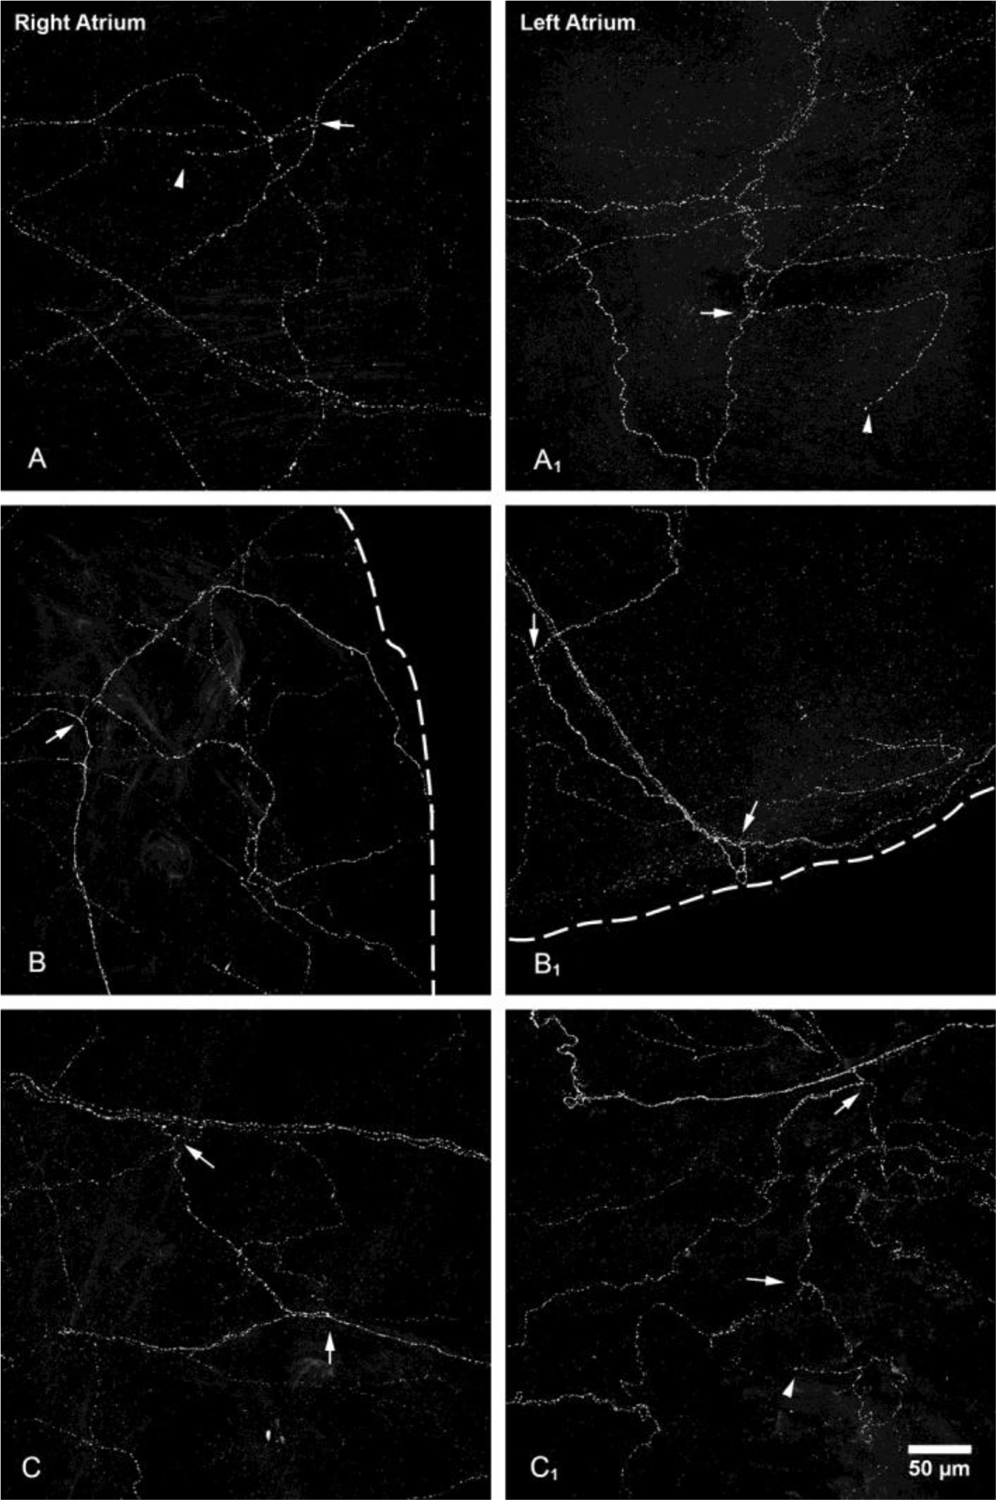
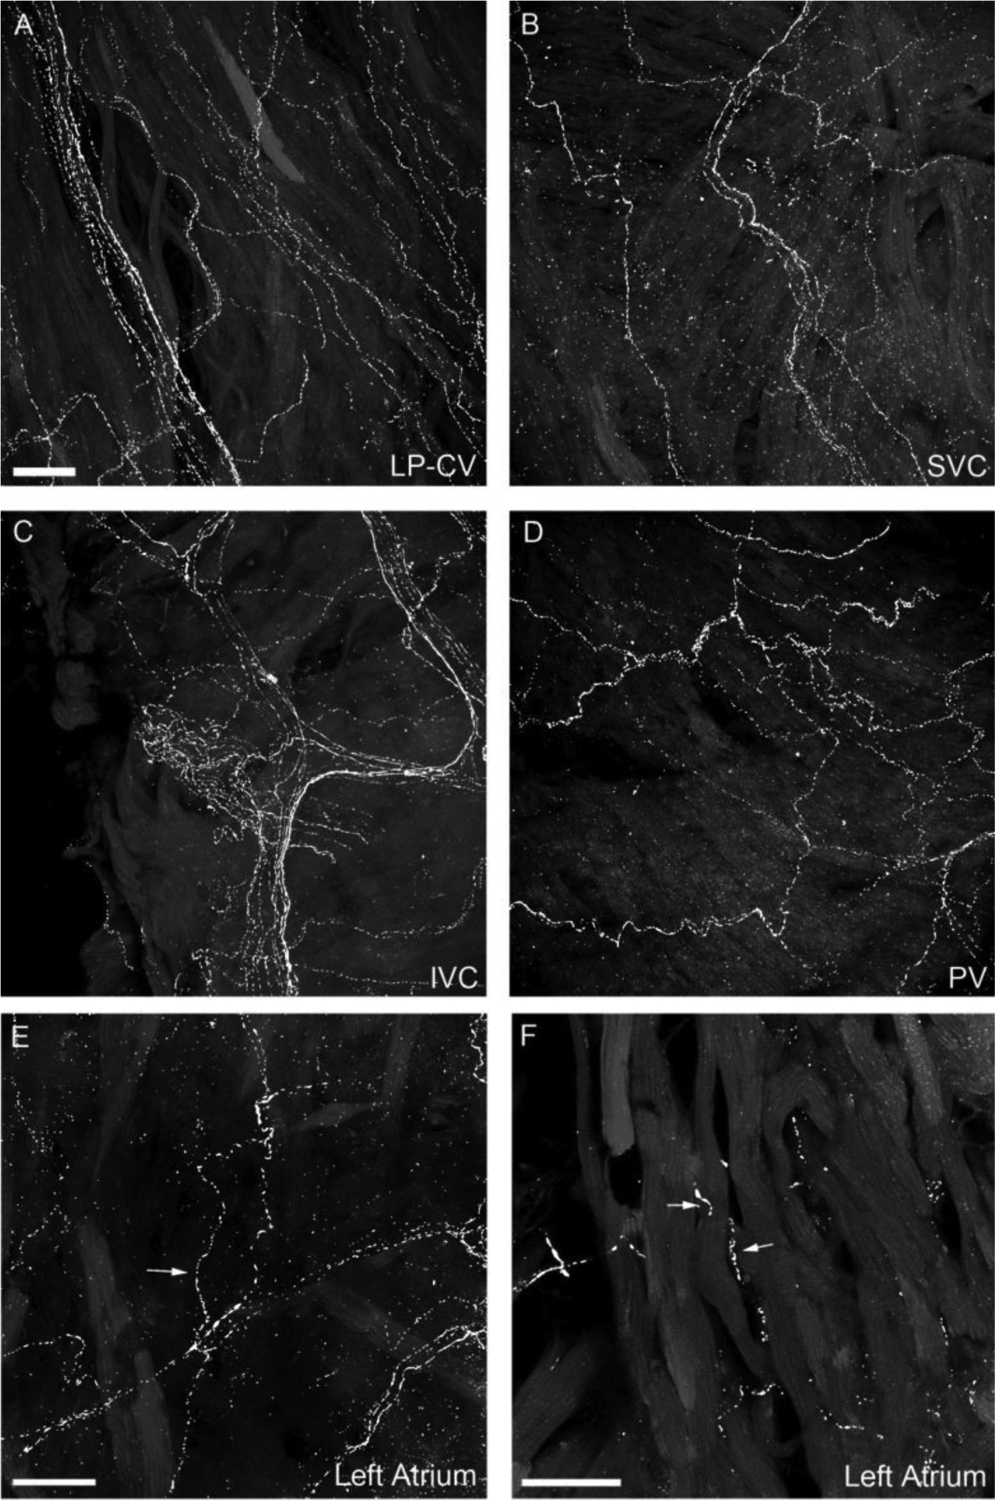
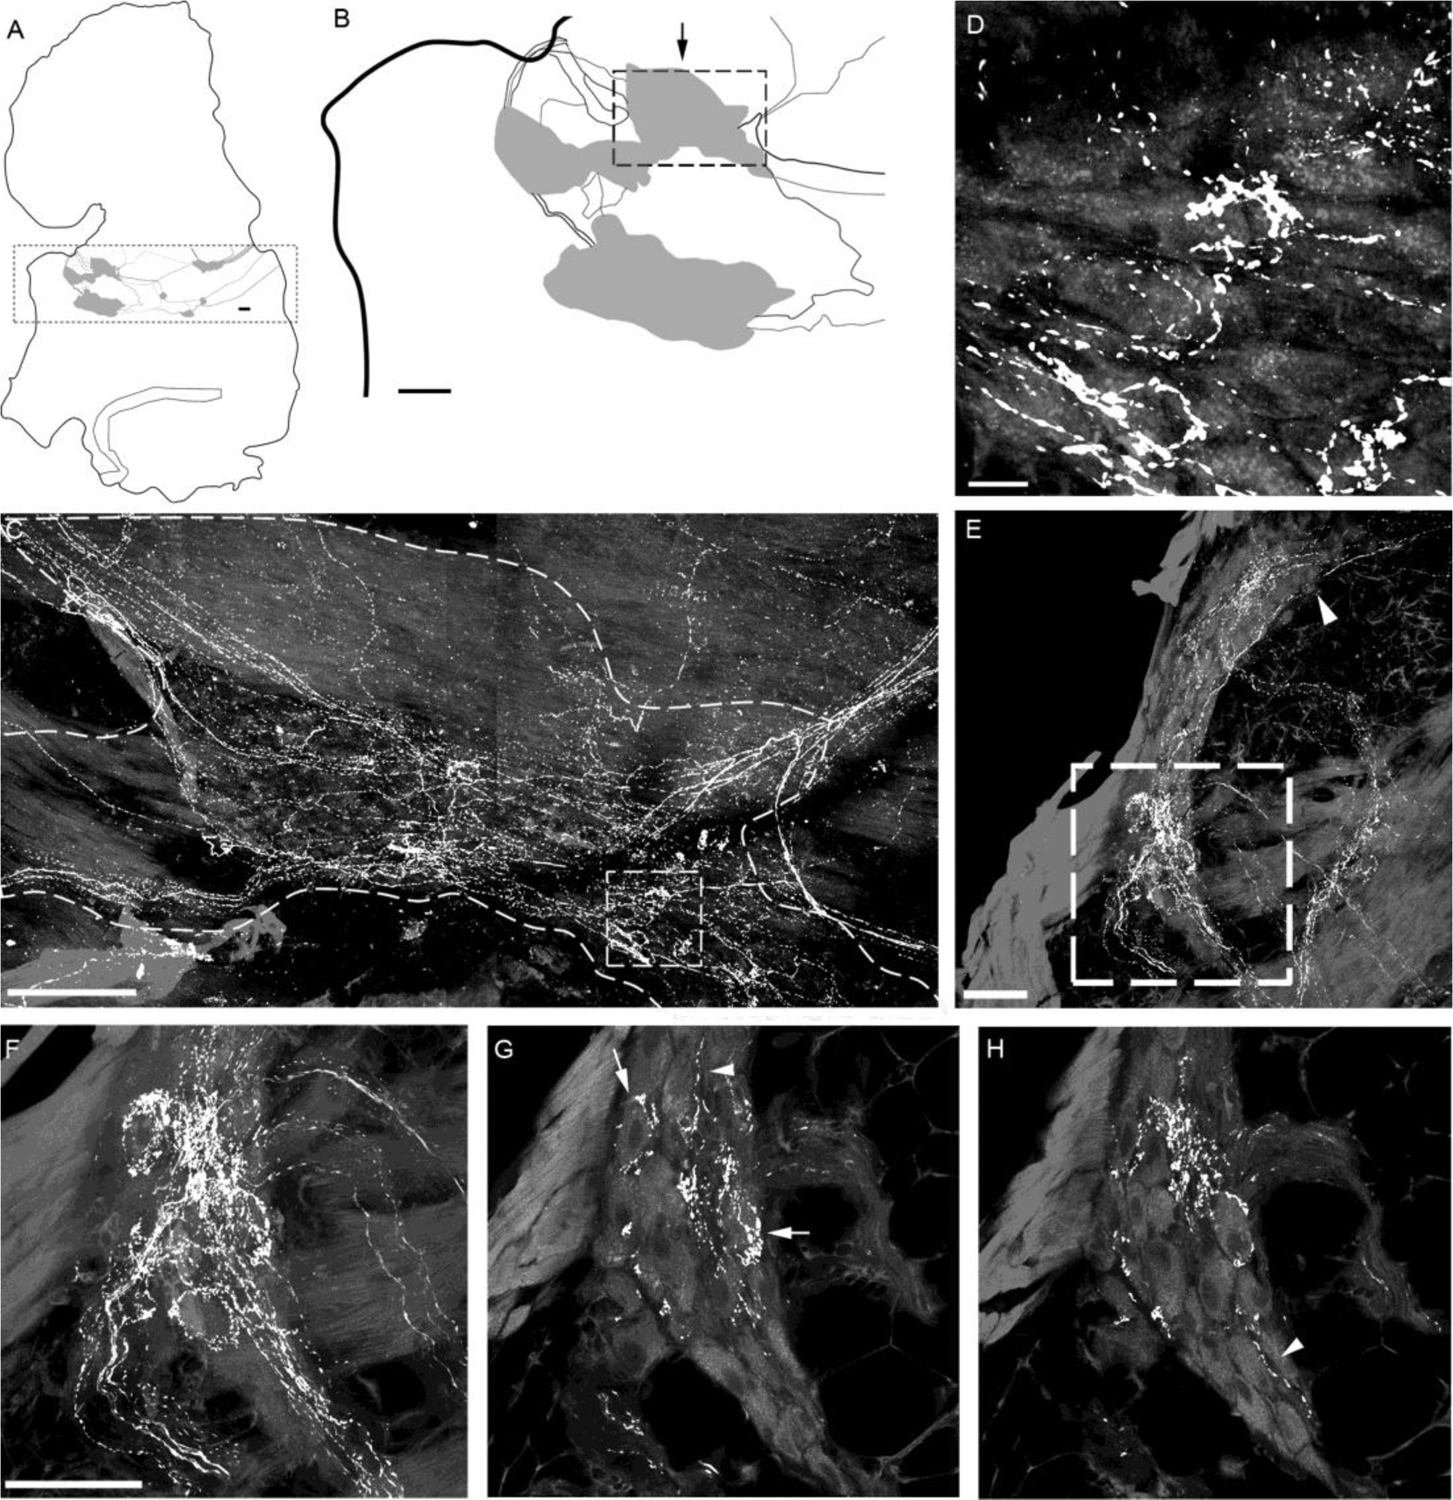
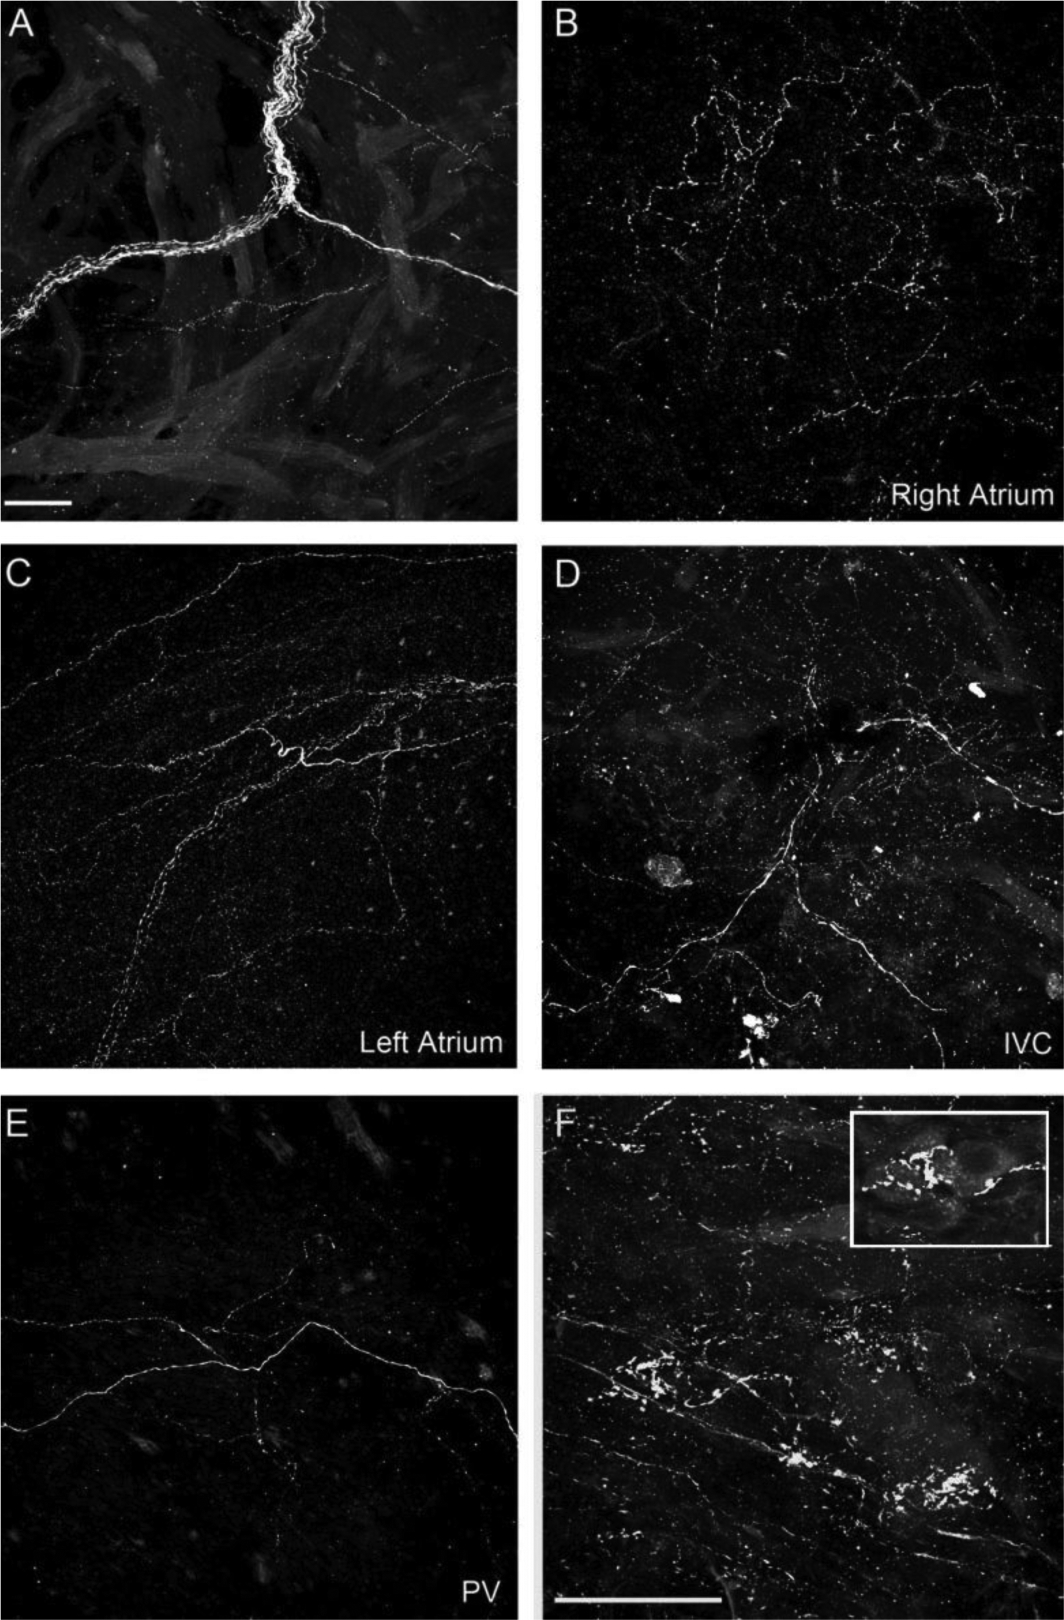
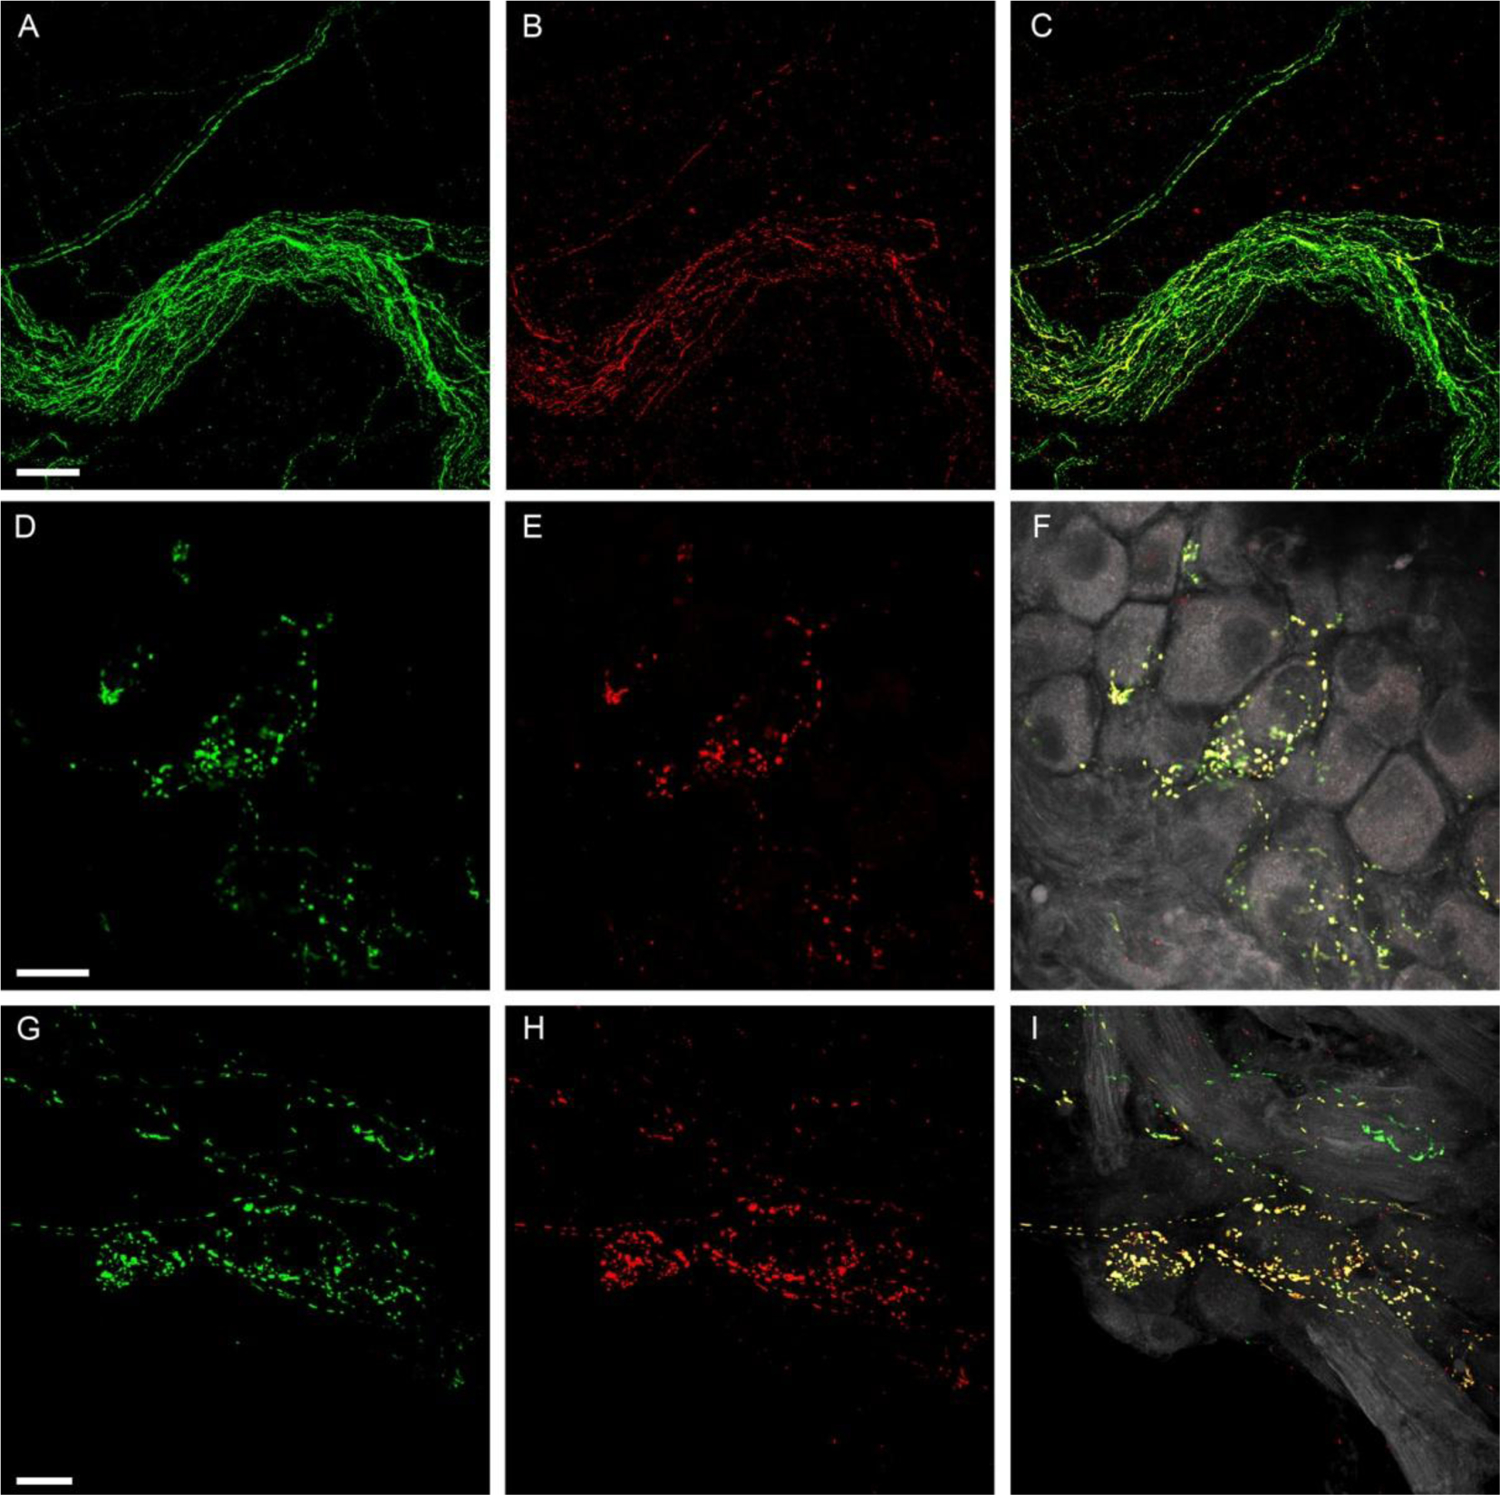
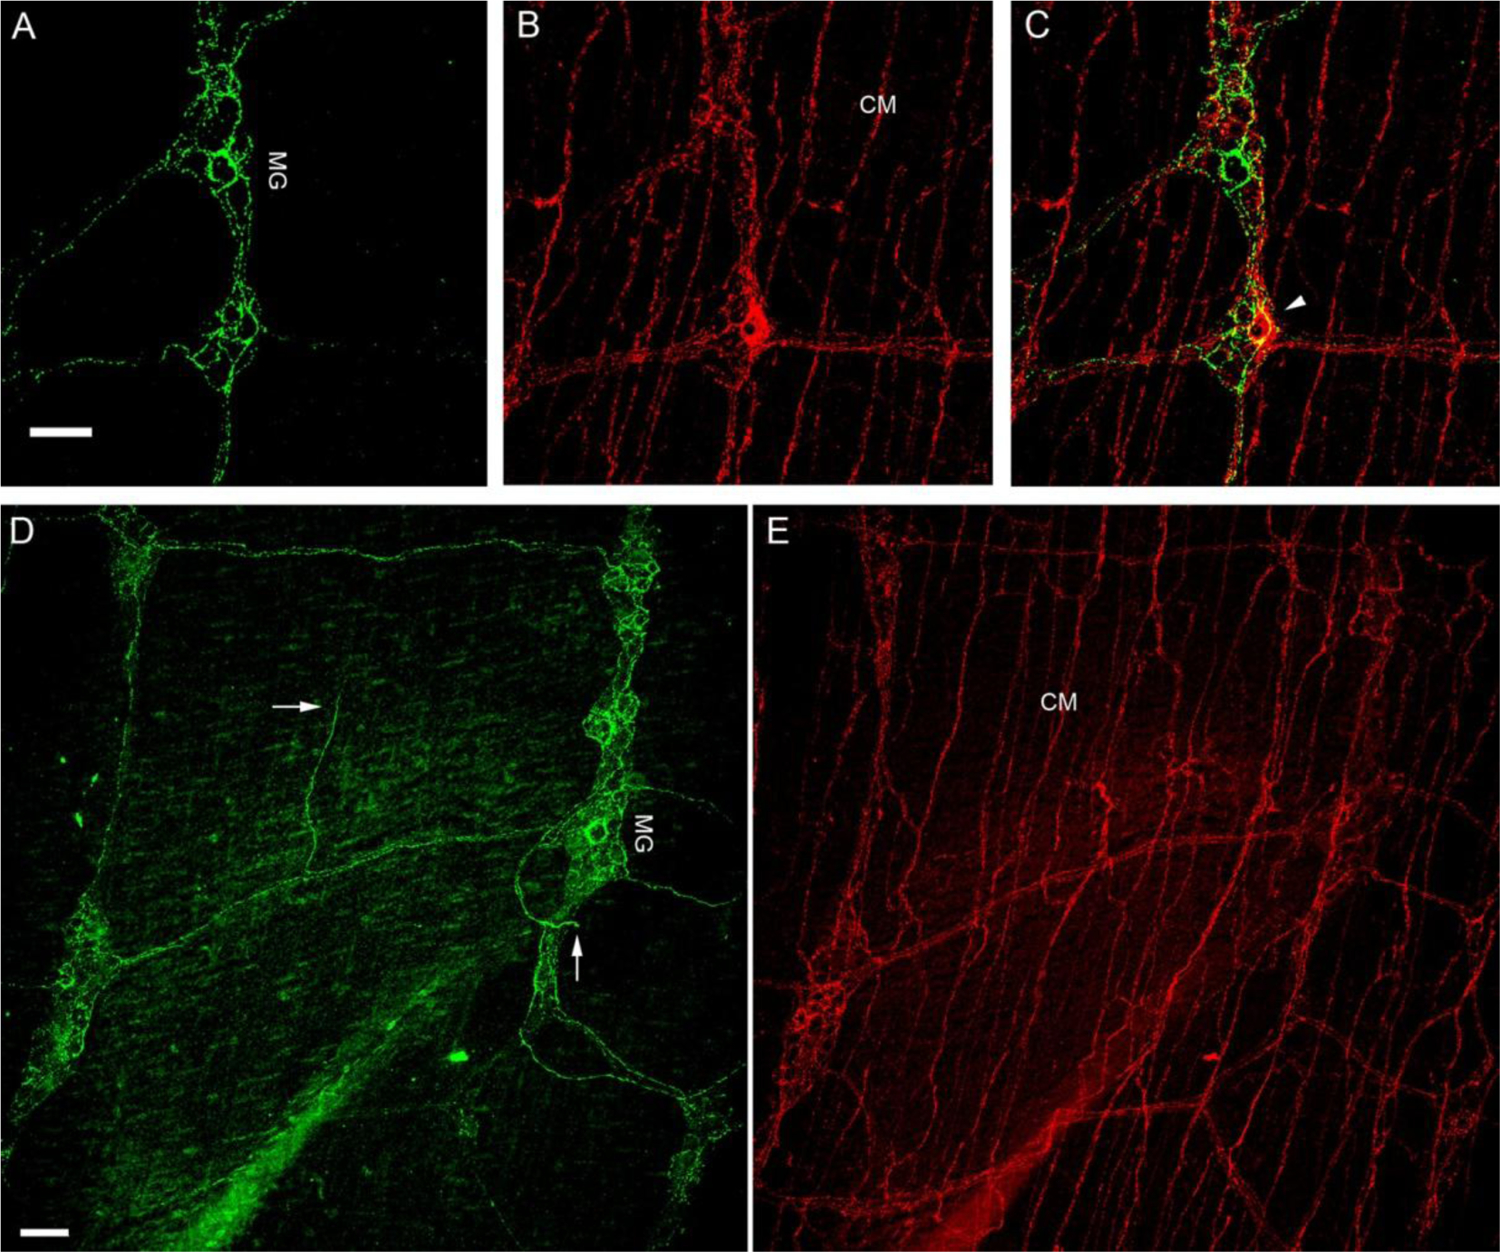
The murine model has been used to investigate the role of cardiac sensory axons in various disease states. However, the distribution and morphological structures of cardiac nociceptive axons in normal murine tissues have not yet been well characterized. In this study, whole-mount atria from FVB mice were processed with calcitonin gene-related peptide (CGRP) and substance P (SP) primary antibodies followed by secondary antibodies, and then examined using confocal microscopy. We found: 1) Large CGRP-IR axon bundles entered the atria with the major veins, and these large bundles bifurcated into small bundles and single axons that formed terminal end-nets and free endings in the epicardium. Varicose CGRP-IR axons had close contacts with muscle fibers, and some CGRP-IR axons formed varicosities around principle neurons (PNs) within intrinsic cardiac ganglia (ICGs). 2) SP-IR axons also were found in the same regions of the atria, attached to veins, and within cardiac ganglia. Similar to CGRP-IR axons, these SP-IR axons formed terminal end-nets and free endings in the atrial epicardium and myocardium. Within ICGs, SP-IR axons formed varicose endings around PNs. However, SP-IR nerve fibers were less abundant than CGRP-IR fibers in the atria. 3) None of the PNs were CGRP-IR or SP-IR. 4) CGRP-IR and SP-IR often colocalized in terminal varicosities around PNs. Collectively, our data document the distribution pattern and morphology of CGRP-IR and SP-IR axons and terminals in different regions of the atria. This knowledge provides useful information for CGRP-IR and SP-IR axons that can be referred to in future studies of pathological remodeling.

Keywords: Atria; CGRP; Cardiac ganglia; Neuropeptides; Nociceptive; SP.


Figures

Figure 1
Figure 1
Montage of all-in-focus maximum confocal projections showing distribution of CGRP-IR nerve fibers in the right and left atrium of a FVB mouse. A. A few large CGRP-IR axon bundles (indicated by large solid arrows) entered the right atrium from SVC and LP-CV. Then, they bifurcated into small bundles (indicated by large open arrows) and single axons (indicated by small arrows). Finally, these single axons covered all regions of the atrium with terminal networks (see Figures 2 and 3 for detail), including the auricle and the entrance area of IVC, SVC and LP-CV. In addition, CGRP-IR axons innervated multiple ICGs with varicose endings around individual cardiac ganglionic principal neurons as indicated by stars (see Figures 2 and 5 for detail). Inferior vena cava: IVC; superior vena cava: SVC; left precaval vein; LP-CV. B. A few large CGRP-IR axon bundles (indicated by large solid arrows) entered the left atrium from left and right PVs. Then, they bifurcated into small bundles (indicated by large open arrows) and single axons (indicated by small arrows). Finally, these single axons covered all regions of the atrium with terminal networks (see Figures 2 and 3 for detail), including the auricle and the entrance area of PVs (Figure 4). In addition, CGRP-IR axons innervated multiple ICGs with varicose endings around individual cardiac ganglionic principal neurons as indicated by stars (see Figures 2 and 5 for detail). Pulmonary veins: PVs. Note: Since panels A and B are confocal montages which show the overall distribution of CGRP-IR axons, the detail structures of the axons and terminals are not visible at this magnification. The square frames A, B, and C and A1, B1, and C1 are the sampling windows where the detail structure of axon terminals will be presented in Figure 3.Scale bars: 500 μm. Note: If you are viewing the electronic version, please“zoom” in on these montages and view the details of axons, terminals and ganglia.
Figure 1
Figure 1
Montage of all-in-focus maximum confocal projections showing distribution of CGRP-IR nerve fibers in the right and left atrium of a FVB mouse. A. A few large CGRP-IR axon bundles (indicated by large solid arrows) entered the right atrium from SVC and LP-CV. Then, they bifurcated into small bundles (indicated by large open arrows) and single axons (indicated by small arrows). Finally, these single axons covered all regions of the atrium with terminal networks (see Figures 2 and 3 for detail), including the auricle and the entrance area of IVC, SVC and LP-CV. In addition, CGRP-IR axons innervated multiple ICGs with varicose endings around individual cardiac ganglionic principal neurons as indicated by stars (see Figures 2 and 5 for detail). Inferior vena cava: IVC; superior vena cava: SVC; left precaval vein; LP-CV. B. A few large CGRP-IR axon bundles (indicated by large solid arrows) entered the left atrium from left and right PVs. Then, they bifurcated into small bundles (indicated by large open arrows) and single axons (indicated by small arrows). Finally, these single axons covered all regions of the atrium with terminal networks (see Figures 2 and 3 for detail), including the auricle and the entrance area of PVs (Figure 4). In addition, CGRP-IR axons innervated multiple ICGs with varicose endings around individual cardiac ganglionic principal neurons as indicated by stars (see Figures 2 and 5 for detail). Pulmonary veins: PVs. Note: Since panels A and B are confocal montages which show the overall distribution of CGRP-IR axons, the detail structures of the axons and terminals are not visible at this magnification. The square frames A, B, and C and A1, B1, and C1 are the sampling windows where the detail structure of axon terminals will be presented in Figure 3.Scale bars: 500 μm. Note: If you are viewing the electronic version, please“zoom” in on these montages and view the details of axons, terminals and ganglia.
Figure 2.
Figure 2.
Schematic drawings depicting CGRP-IR innervation of the whole-mount right and left atria in the FVB mouse as shown in Figures 1. Each atrium was divided into an auricle region and the rest of the atrium including the entrance of the large veins. The boundary is indicated by a dotted straight line. Large bundles of CGRP-IR axons (thick lines) entered the atrium and then bifurcated into small bundles (thin lines) and ultimately the single axons (dotted lines) with terminal networks and free endings (not shown at this magnification). Both atria contained multiple intrinsic cardiac ganglia as indicated by grey areas. Sino-atrial node region: SA; atrio-ventricular node region: AV; inferior vena cava: IVC; superior vena cava: SVC; left precaval vein: LP-CV; pulmonary veins: PVs. Scale bar: 500μm.Note: intrinsic cardiac ganglionic plexuses may include 15–20 ganglia on the dorsal surface of both atria. The SA and AV nodes are in the right atria. During tissue dissection, several SA regional ganglia which had originally been connected with each other by axons were disconneted. After tissue dissection, these SA regional ganglia could be located on the dorsal surface of both left and right atria. The function roles of these individual ganglia in the SA region have been explored (Sampaio et al. 2003).
Figure 3.
Figure 3.
CGRP-IR axons and terminals in the atria. All-in-focus projections at the regions indicated by A, B, and C in the right atrium and A1, B1, and C1 in the left atrium in Figure 1A and 1B, respectively. Detailed structure of CGRP-IR axons in different atrial regions showed similar patterns. Multiple single axon fibers formed terminal end-nets with free endings in the epicardium and myocardium. Arrows: branching points; arrow heads: free endings. Scale bar: 50μm.
Figure 4.
Figure 4.
CGRP-IR axons in the entrance area of the major veins. All-in-focus projection images of LP-CV (left precaval vein; A), SVC (superior vena cava, B), IVC (inferior vena cava, C) of the right atrium; and PV (pulmonary vein, D) of the left atrium. The bright signal represents CGRP-IR axons and the dim background represents autofluorescent background from muscle layers. CGRP-IR axons in the veins exhibited similar structure of terminal end-nets and free endings as seen in the atria. E: A partial projection of confocal optically-sectioned images showing several axons (arrows) traveling in the epicardium. F: A single optical section showing that delicate CGRP axons (arrows) are in the myocardium and have close contacts with cardiomyocytes. Scale bars in A: 50 μm for A-D; in E and F: 30 μm.
Figure 5.
Figure 5.
CGRP-IR innervation of intrinsic cardiac ganglia (ICGs) in the atria of a representative mouse. A. Schematic drawing of the left atrium with ICGs indicated by grey patches. The dotted frame encloses ICG plexuses. B. The ICGs at the left portion as enclosed in the dotted frame in panel A were shown at higher magnification. C. A confocal projection of the ganglion region indicated by the arrow above the dotted frame in panel B. CGRP-IR axons innervated ICG neurons (autofluorescence). Varicose CGRP-IR axons traveled in the connective between ICGs. Most of these varicose axons coursed through and passed by the ganglion, whereas some formed varicose terminals around cardiac ganglionic principal neurons (PNs). D. Higher magnification of the boxed area in C showing such axonal varicosities near PNs. Noticeably, none of PNs were CGRP-IR. E. All-in-focus projection image at the AV region of the right atrium. A ganglion is identified within the dotted frame. F. High magnification of the region with the dotted frame in panel E. G-H. Two different single optical sections showing that CGRP-IR axons formed varicosities around the individual PNs (arrows). Arrowheads in E, G, and H indicate CGRP-IR axons were passing by ICG PNs. Scale bars: 200 μm in panel B; 100 μm in panel C; 10 μm in panel D. 50 μm in panel E; 50μm in F for F-H.
Figure 6.
Figure 6.
SP-IR axons in atria. A. SP-IR axon bundle in the right atrium. B. SP-IR terminal end-net in the right atrium. C. SP-IR terminal end-net in the left atrium. D. SP-IR axons in the IVC. E. SP-IR axons in a PV. F. SP-IR axons formed varicose endings around ICG PNs. The inset reveals a few gangion cells and varicose terminals around the somata of these cells. Scale bar in A: 50μm for A-E; Scale bar in F: 50μm.
Figure 7.
Figure 7.
Colocalization of SP-IR and CGRP-IR in axon bundles and ICGs. A-C: Colocalization of SP-IR and CGRP-IR in an axon bundle. A large axon bundle entered the right atrium and most SP-IR (B, Red) fibers were found to have colocalization of CGRP-IR (A, Green), indicating coexpression of CGRP with SP (C,Yellow in the merged image). D-F and G-I: Two examples of colocalization of SP-IR and CGRP-IR in ICGs. Single confocal optic images show CGRP-IR terminal varicosities (D or G). Single confocal optic images show SP-IR terminal varicosites (E or H). The merged images of panel D (or G) withpanel E (or H) is shown in F (or I). PNs are in gray color. Most SP-IR varicose terminals show colocalization of CGRP-IR in their terminal varicosities. Colocalization of SP and CGRP in these terminals is signified by yellow in the composite image. Varicosities in pure green (CGRP-IR) color in panel F or I suggest that although most SP-IR fibers show colocalized CGRP expression, some fibers show exclusive CGRP immunoreactivity. Scale bars in A: 50μm for A-C, in D: 50μm for D-F, in G: 50μm for G-I.
Figure 8.
Figure 8.
CGRP-IR and SP-IR axons and terminals in the small intestine of a FVB mouse. A, B. Single confocal optic sectioned images show CGRP-IR (Green; panel A) and SP-IR (Red; panel B) fibers and terminals in the small intestine. C. Only a few varicosities showed colocalized CGRP-IR and SP-IR in MG as yellow (arrowhead) in the composite image, whereas the majority did not. D, E. All-in-focus projection confocal images showed CGRP-IR axon terminals were mostly in MG and only a few free terminals were in the muscle layer (arrows). On the other hand, SP-IR axon networks were found richly in CM and SP-IR axon terminals were found in MG. myenteric ganglia: MG; circular muscle: CM. Scale bar in A: 50μm for A-C, in D: 50μm for D-E.

Similar articles

Cited by

References

    1. Ai J, Epstein PN, Gozal D, Yang B, Wurster RD, Cheng ZJ, 2007a. Morphology and topography of nucleus ambiguus projections to cardiac ganglia in rats and mice. Neuroscience 149, 845–860. - PubMed
    1. Ai J, Gozal D, Li L, Wead WB, Chapleau MW, Wurster RD, Yang B, Li H, Liu R, Cheng Z, 2007b. Degeneration of vagal efferent axons and terminals in cardiac ganglia of aged rats. J. Comp. Neurol 504, 74–88. - PubMed
    1. Ai J, Wurster RD, Harden SW, Cheng ZJ, 2009. Vagal afferent innervation and remodeling in the aortic arch of young-adult Fischer 344 rats following chronic intermittent hypoxia. Neuroscience 164, 658–666. - PubMed
    1. Becker DE, Ancin H, Szarowski DH, Turner JN, Roysam B, 1996. Automated 3-D montage synthesis from laser-scanning confocal images: application to quantitative tissue-level cytological analysis. Cytometry 25, 235–245. - PubMed
    1. Benemei S, Nicoletti P, Capone JG, Geppetti P, 2009. CGRP receptors in the control of pain and inflammation. Curr. Opin. Pharmacol 9, 9–14. - PubMed

Publication types

MeSH terms

Substances