

Oxidative stress induces mitochondrial dysfunction and a protective unfolded protein response in RPE cells
- PMID: 24434119
- PMCID: PMC3960355
- DOI: 10.1016/j.freeradbiomed.2014.01.004
Oxidative stress induces mitochondrial dysfunction and a protective unfolded protein response in RPE cells
Abstract
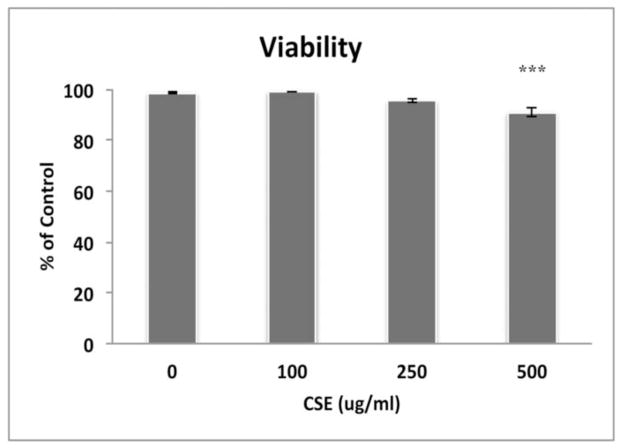
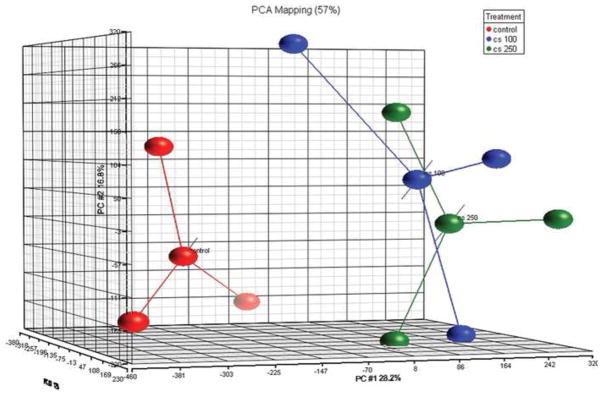
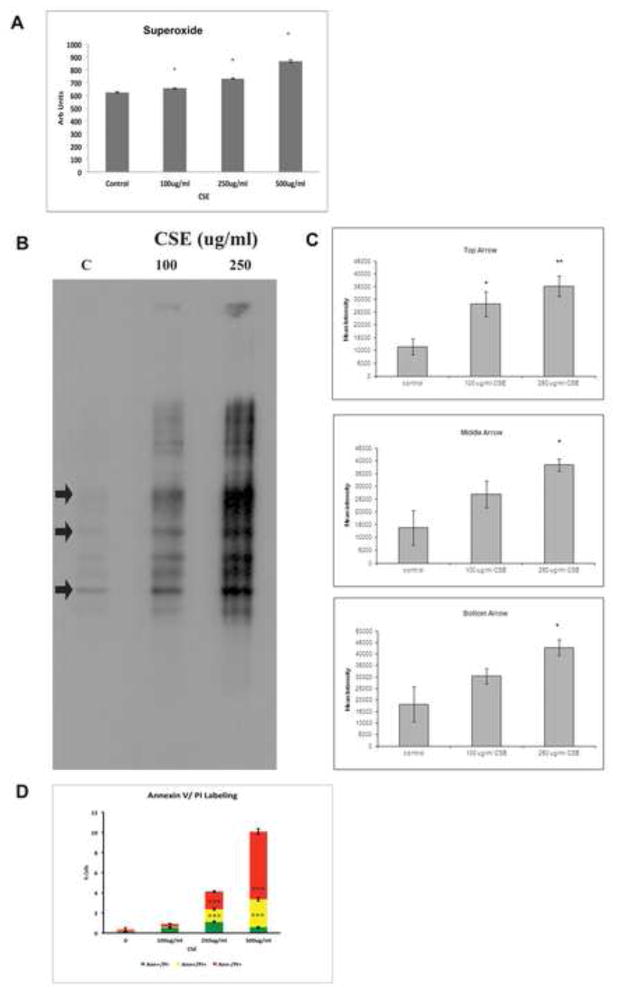
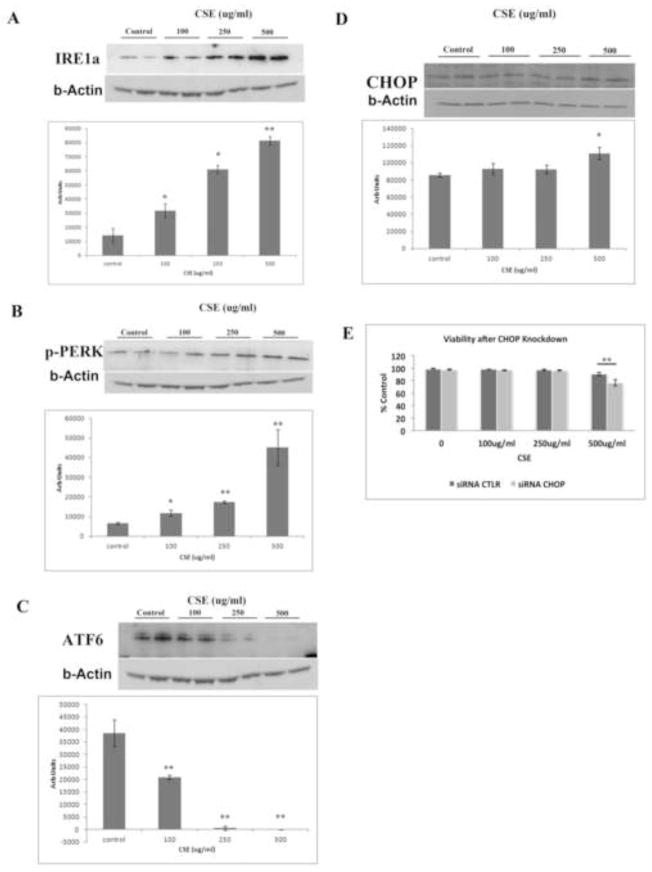
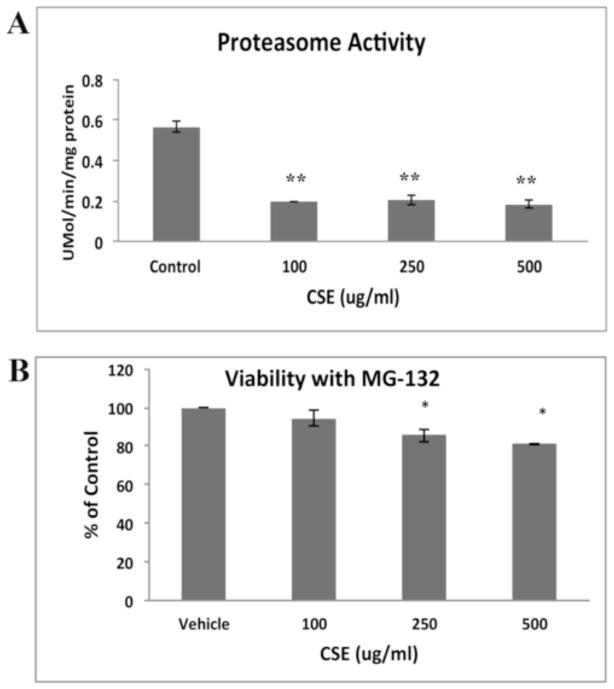
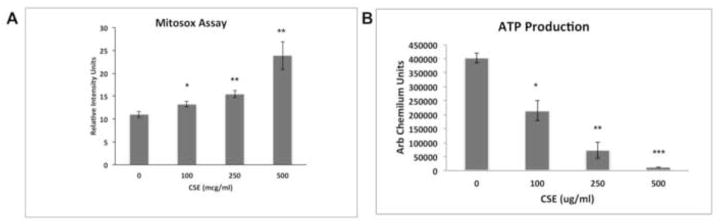
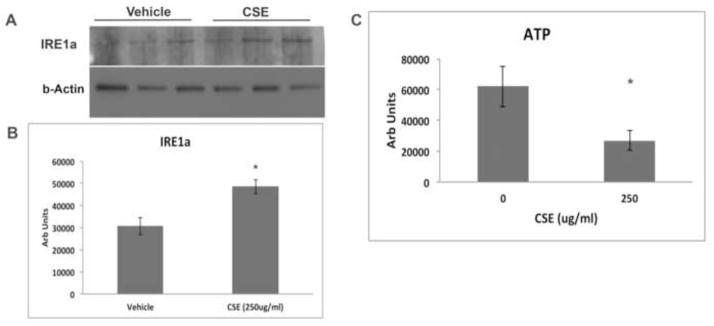
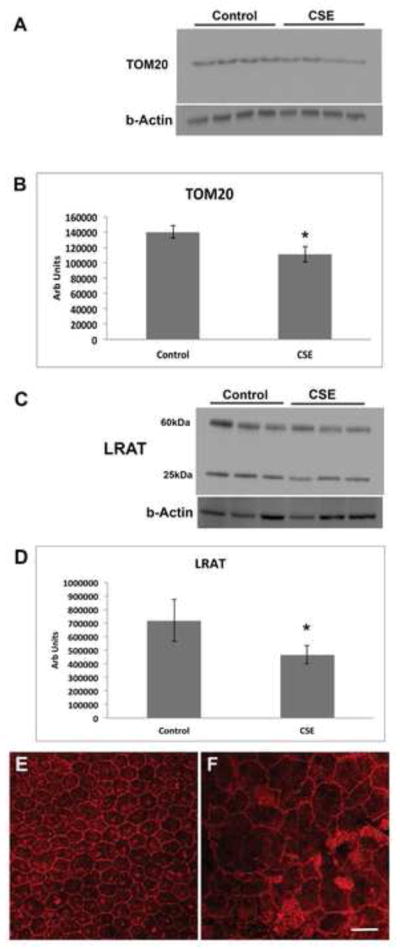
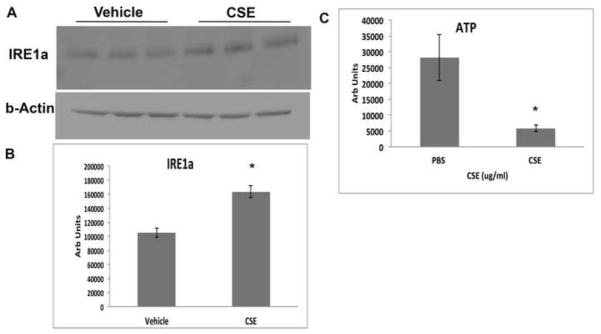
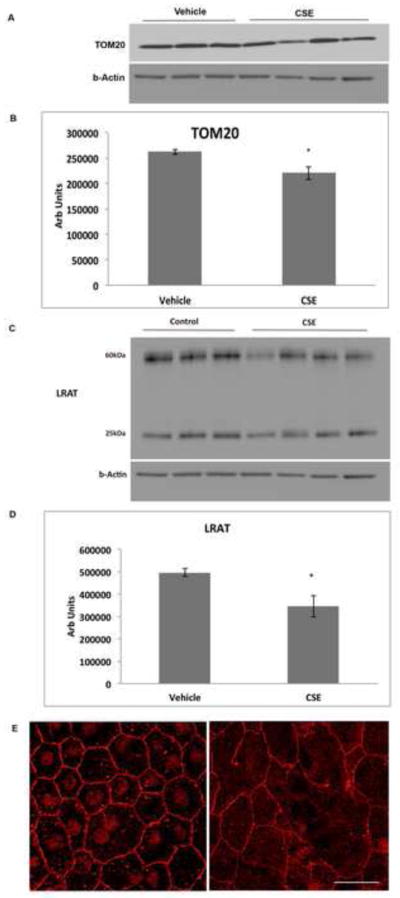
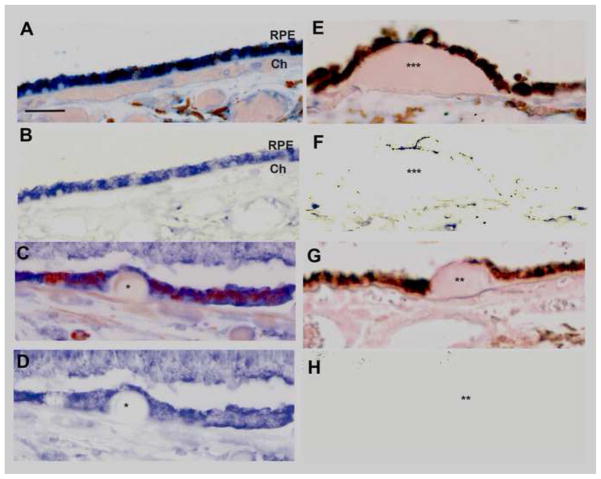
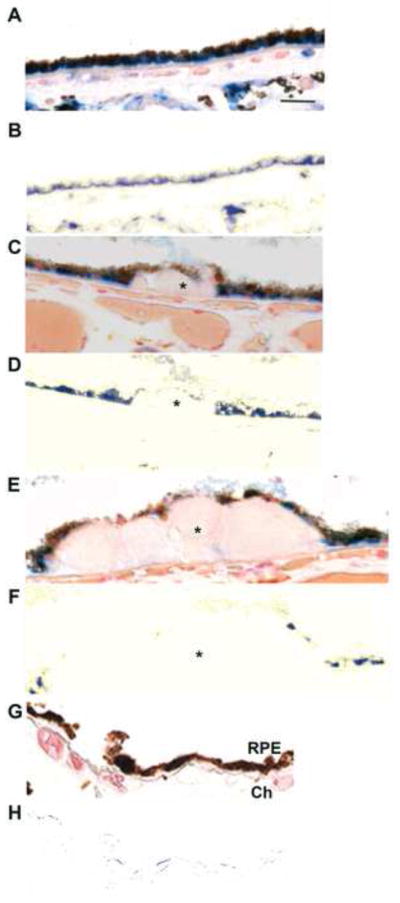
How cells degenerate from oxidative stress in aging-related disease is incompletely understood. This study's intent was to identify key cytoprotective pathways activated by oxidative stress and determine the extent of their protection. Using an unbiased strategy with microarray analysis, we found that retinal pigmented epithelial (RPE) cells treated with cigarette smoke extract (CSE) had overrepresented genes involved in the antioxidant and unfolded protein response (UPR). Differentially expressed antioxidant genes were predominantly located in the cytoplasm, with no induction of genes that neutralize superoxide and H2O2 in the mitochondria, resulting in accumulation of superoxide and decreased ATP production. Simultaneously, CSE induced the UPR sensors IRE1α, p-PERK, and ATP6, including CHOP, which was cytoprotective because CHOP knockdown decreased cell viability. In mice given intravitreal CSE, the RPE had increased IRE1α and decreased ATP and developed epithelial-mesenchymal transition, as suggested by decreased LRAT abundance, altered ZO-1 immunolabeling, and dysmorphic cell shape. Mildly degenerated RPE from early age-related macular degeneration (AMD) samples had prominent IRE1α, but minimal mitochondrial TOM20 immunolabeling. Although oxidative stress is thought to induce an antioxidant response with cooperation between the mitochondria and the ER, herein we show that mitochondria become impaired sufficiently to induce epithelial-mesenchymal transition despite a protective UPR. With similar responses in early AMD samples, these results suggest that mitochondria are vulnerable to oxidative stress despite a protective UPR during the early phases of aging-related disease.
Keywords: Aging-related disease; ER stress; Epithelial–mesenchymal transition; Free radicals; Mitochondria; Oxidative stress.
Copyright © 2014 Elsevier Inc. All rights reserved.
Conflict of interest statement
Conflict of interest: None.
Figures
Similar articles
-
Morin hydrate attenuates CSE-induced lipid accumulation, ER stress, and oxidative stress in RPE cells: implications for age-related macular degeneration.Free Radic Res. 2019 Aug;53(8):865-874. doi: 10.1080/10715762.2019.1637862. Epub 2019 Jul 15. Free Radic Res. 2019. PMID: 31257945
-
Activation of the UPR protects against cigarette smoke-induced RPE apoptosis through up-regulation of Nrf2.J Biol Chem. 2015 Feb 27;290(9):5367-80. doi: 10.1074/jbc.M114.603738. Epub 2015 Jan 7. J Biol Chem. 2015. PMID: 25568320 Free PMC article.
-
Role of unfolded protein response dysregulation in oxidative injury of retinal pigment epithelial cells.Antioxid Redox Signal. 2014 May 10;20(14):2091-106. doi: 10.1089/ars.2013.5240. Epub 2013 Dec 17. Antioxid Redox Signal. 2014. PMID: 24053669 Free PMC article.
-
PGC-1α Protects RPE Cells of the Aging Retina against Oxidative Stress-Induced Degeneration through the Regulation of Senescence and Mitochondrial Quality Control. The Significance for AMD Pathogenesis.Int J Mol Sci. 2018 Aug 7;19(8):2317. doi: 10.3390/ijms19082317. Int J Mol Sci. 2018. PMID: 30087287 Free PMC article. Review.
-
Protective Mechanisms of the Mitochondrial-Derived Peptide Humanin in Oxidative and Endoplasmic Reticulum Stress in RPE Cells.Oxid Med Cell Longev. 2017;2017:1675230. doi: 10.1155/2017/1675230. Epub 2017 Jul 26. Oxid Med Cell Longev. 2017. PMID: 28814984 Free PMC article. Review.
Cited by
-
Dynamic transcriptomic analysis of Ischemic Injury in a Porcine Pre-Clinical Model mimicking Donors Deceased after Circulatory Death.Sci Rep. 2018 Apr 13;8(1):5986. doi: 10.1038/s41598-018-24282-6. Sci Rep. 2018. PMID: 29654283 Free PMC article.
-
Age-Related Macular Degeneration: Role of Oxidative Stress and Blood Vessels.Int J Mol Sci. 2021 Jan 28;22(3):1296. doi: 10.3390/ijms22031296. Int J Mol Sci. 2021. PMID: 33525498 Free PMC article. Review.
-
Mitophagy in Astrocytes Is Required for the Health of Optic Nerve.Cells. 2023 Oct 20;12(20):2496. doi: 10.3390/cells12202496. Cells. 2023. PMID: 37887340 Free PMC article.
-
Proteostasis in aging-associated ocular disease.Mol Aspects Med. 2022 Dec;88:101157. doi: 10.1016/j.mam.2022.101157. Epub 2022 Nov 29. Mol Aspects Med. 2022. PMID: 36459837 Free PMC article. Review.
-
Recurrent Sleep Fragmentation Induces Insulin and Neuroprotective Mechanisms in Middle-Aged Flies.Front Aging Neurosci. 2016 Aug 2;8:180. doi: 10.3389/fnagi.2016.00180. eCollection 2016. Front Aging Neurosci. 2016. PMID: 27531979 Free PMC article.
References
-
- Tomany SC, Wang JJ, Van Leeuwen R, Klein R, Mitchell P, Vingerling JR, Klein BE, Smith W, De Jong PT. Risk factors for incident age-related macular degeneration: pooled findings from 3 continents. Ophthalmology. 2004;111:1280–1287. - PubMed
-
- Vingerling JR, Hofman A, Grobbee DE, de Jong PT. Age-related macular degeneration and smoking. The Rotterdam Study. Arch Ophthalmol. 1996;114:1193–1196. - PubMed
-
- Smith W, Assink J, Klein R, Mitchell P, Klaver CC, Klein BE, Hofman A, Jensen S, Wang JJ, de Jong PT. Risk factors for age-related macular degeneration: Pooled findings from three continents. Ophthalmology. 2001;108:697–704. - PubMed
-
- Mitchell P, Wang JJ, Smith W, Leeder SR. Smoking and the 5-year incidence of age-related maculopathy: the Blue Mountains Eye Study. Arch Ophthalmol. 2002;120:1357–1363. - PubMed
Publication types
MeSH terms
Substances
Associated data
- Actions
Grants and funding
LinkOut - more resources
Full Text Sources
Other Literature Sources
Medical
Molecular Biology Databases
Research Materials
