

Comparing mRNA levels using in situ hybridization of a target gene and co-stain
- PMID: 24434507
- PMCID: PMC4048779
- DOI: 10.1016/j.ymeth.2014.01.003
Comparing mRNA levels using in situ hybridization of a target gene and co-stain
Abstract
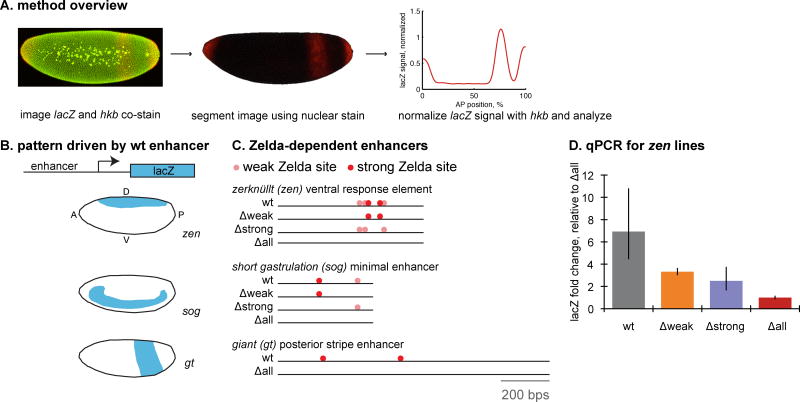
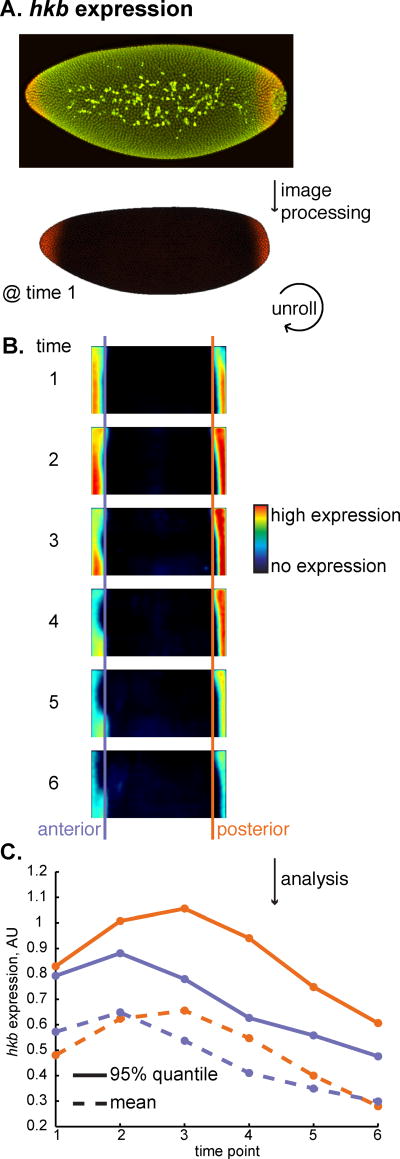
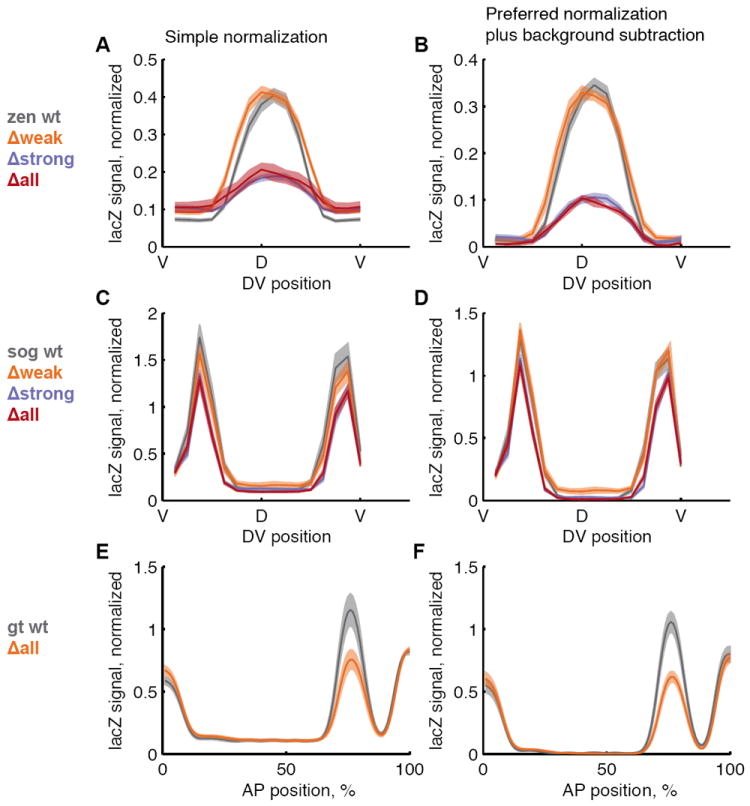
In situ hybridization is an important technique for measuring the spatial expression patterns of mRNA in cells, tissues, and whole animals. However, mRNA levels cannot be compared across experiments using typical protocols. Here we present a semi-quantitative method to compare mRNA levels of a gene across multiple samples. This method yields an estimate of the error in the measurement to allow statistical comparison. Our method uses a typical in situ hybridization protocol to stain for a target gene and an internal standard, which we refer to as a co-stain. As a proof of concept, we apply this method to multiple lines of transgenic Drosophila embryos, harboring constructs that express reporter genes to different levels. We generated this test set by mutating enhancer sequences to contain different numbers of binding sites for Zelda, a transcriptional activator. We demonstrate that using a co-stain with in situ hybridization is an effective method to compare mRNA levels across samples. This method requires only minor modifications to existing in situ hybridization protocols and uses straightforward analysis techniques. This strategy can be broadly applied to detect quantitative, spatially resolved changes in mRNA levels.
Keywords: Drosophila melanogaster; In situ hybridization; Transcriptional activator; Vielfaltig; Zelda; mRNA levels.
Copyright © 2014 The Authors. Published by Elsevier Inc. All rights reserved.
Figures
Similar articles
-
The use of whole-mount in situ hybridization to illustrate gene expression regulation.Biochem Mol Biol Educ. 2014 Jul-Aug;42(4):339-47. doi: 10.1002/bmb.20807. Epub 2014 Jun 30. Biochem Mol Biol Educ. 2014. PMID: 24979316
-
Multi-target Chromogenic Whole-mount In Situ Hybridization for Comparing Gene Expression Domains in Drosophila Embryos.J Vis Exp. 2016 Jan 31;(107):e53830. doi: 10.3791/53830. J Vis Exp. 2016. PMID: 26862978 Free PMC article.
-
Characterization of msim, a murine homologue of the Drosophila sim transcription factor.Genomics. 1996 Jul 1;35(1):144-55. doi: 10.1006/geno.1996.0333. Genomics. 1996. PMID: 8661115
-
Whole mount in situ hybridization techniques for analysis of the spatial distribution of mRNAs in sea urchin embryos and early larvae.Methods Cell Biol. 2019;151:177-196. doi: 10.1016/bs.mcb.2019.01.003. Epub 2019 Mar 20. Methods Cell Biol. 2019. PMID: 30948007 Review.
-
Eye development.Methods. 2014 Jun 15;68(1):252-9. doi: 10.1016/j.ymeth.2014.04.007. Epub 2014 Apr 29. Methods. 2014. PMID: 24784530 Free PMC article. Review.
Cited by
-
A Mutation in the Drosophila melanogaster eve Stripe 2 Minimal Enhancer Is Buffered by Flanking Sequences.G3 (Bethesda). 2020 Dec 3;10(12):4473-4482. doi: 10.1534/g3.120.401777. G3 (Bethesda). 2020. PMID: 33037064 Free PMC article.
-
Mancozeb impairs mitochondrial and bioenergetic activity in Drosophila melanogaster.Heliyon. 2021 Jan 21;7(1):e06007. doi: 10.1016/j.heliyon.2021.e06007. eCollection 2021 Jan. Heliyon. 2021. PMID: 33521363 Free PMC article.
-
Dissecting the sharp response of a canonical developmental enhancer reveals multiple sources of cooperativity.Elife. 2019 Jun 21;8:e41266. doi: 10.7554/eLife.41266. Elife. 2019. PMID: 31223115 Free PMC article.
-
A gene expression atlas of a bicoid-depleted Drosophila embryo reveals early canalization of cell fate.Development. 2015 Feb 1;142(3):587-96. doi: 10.1242/dev.117796. Development. 2015. PMID: 25605785 Free PMC article.
-
Hunchback is counter-repressed to regulate even-skipped stripe 2 expression in Drosophila embryos.PLoS Genet. 2018 Sep 7;14(9):e1007644. doi: 10.1371/journal.pgen.1007644. eCollection 2018 Sep. PLoS Genet. 2018. PMID: 30192762 Free PMC article.
References
-
- Darby IA, Hewitson TD. Situ Hybridization Protocols (Methods in Molecular Biology) Humana Press; 2010.
-
- Levsky JM, Singer RH. Fluorescence in situ hybridization: past, present and future. J Cell Sci. 2003;116:2833–2838. - PubMed
-
- Fowlkes CC, et al. A quantitative spatiotemporal atlas of gene expression in the Drosophila blastoderm. Cell. 2008;133:364–374. - PubMed
Publication types
MeSH terms
Substances
Grants and funding
LinkOut - more resources
Full Text Sources
Other Literature Sources
Molecular Biology Databases
Research Materials
