

Weakened rate-dependent depression of Hoffmann's reflex and increased motoneuron hyperactivity after motor cortical infarction in mice
- PMID: 24434515
- PMCID: PMC4040693
- DOI: 10.1038/cddis.2013.544
Weakened rate-dependent depression of Hoffmann's reflex and increased motoneuron hyperactivity after motor cortical infarction in mice
Abstract
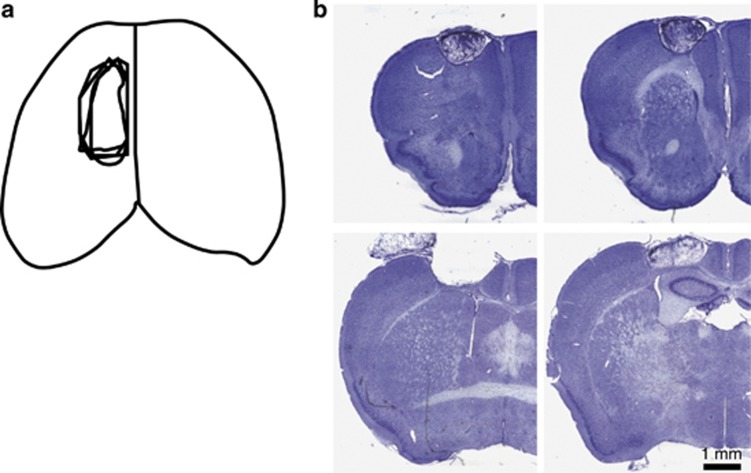
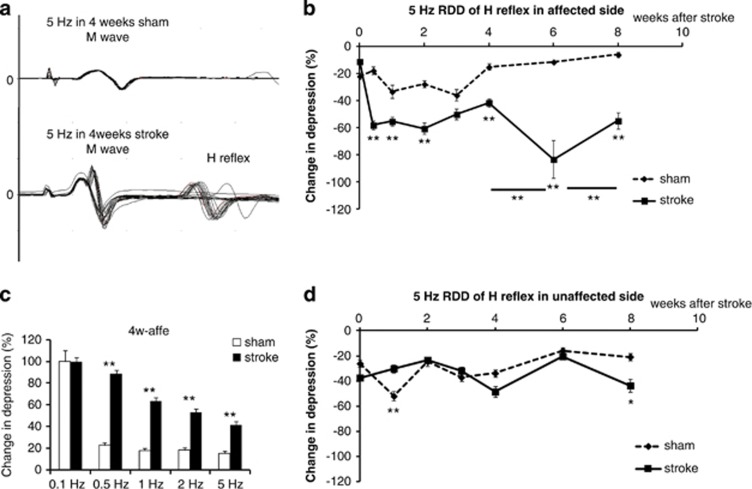
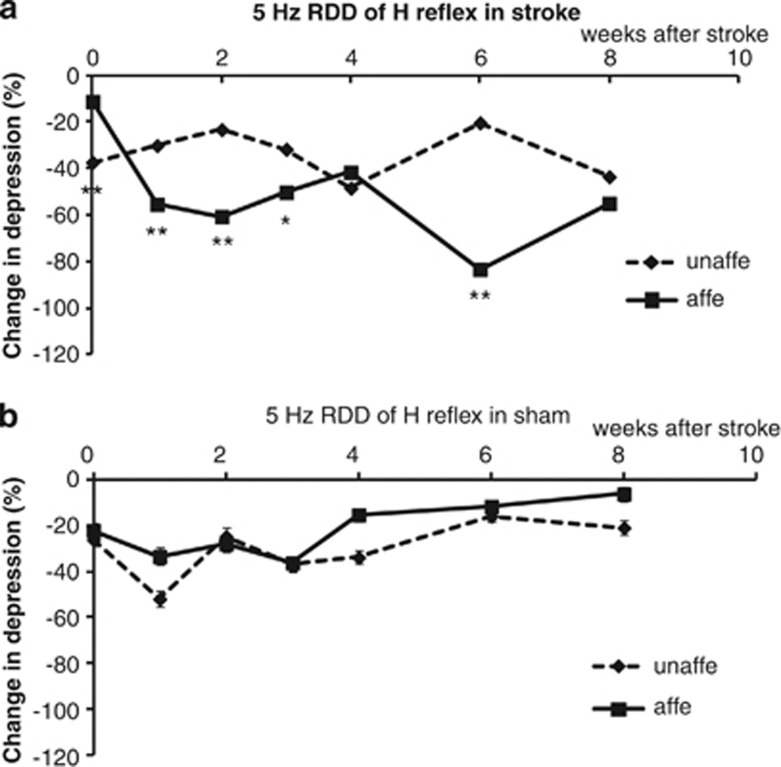
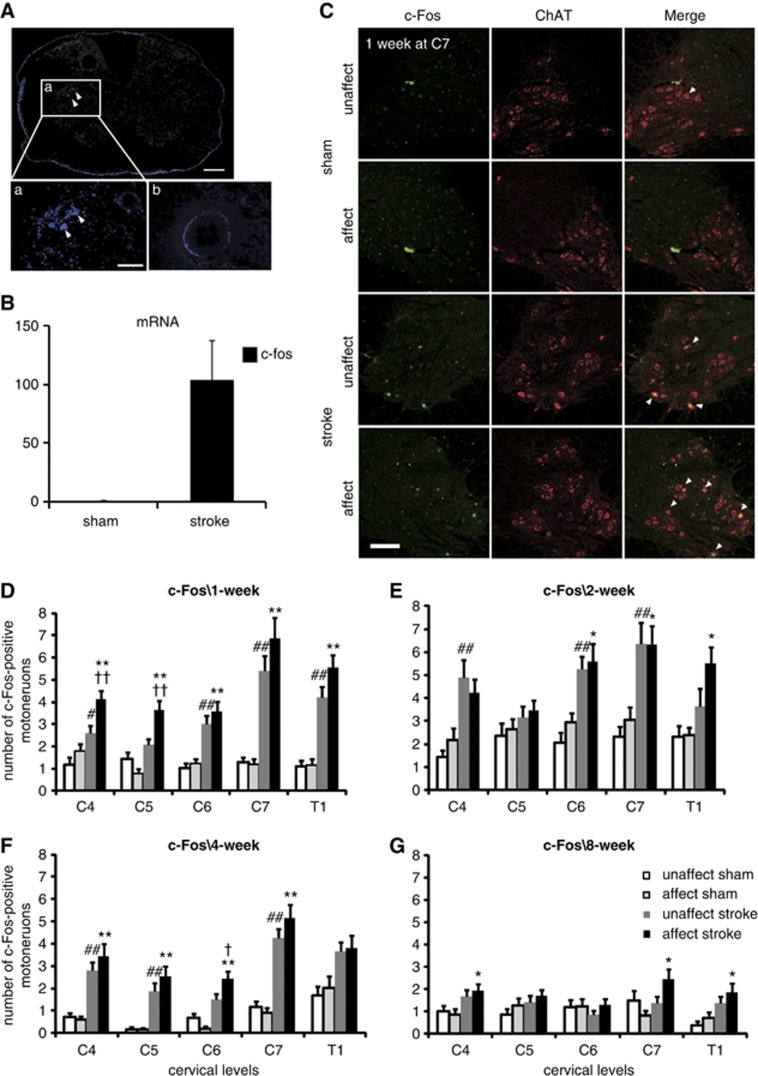
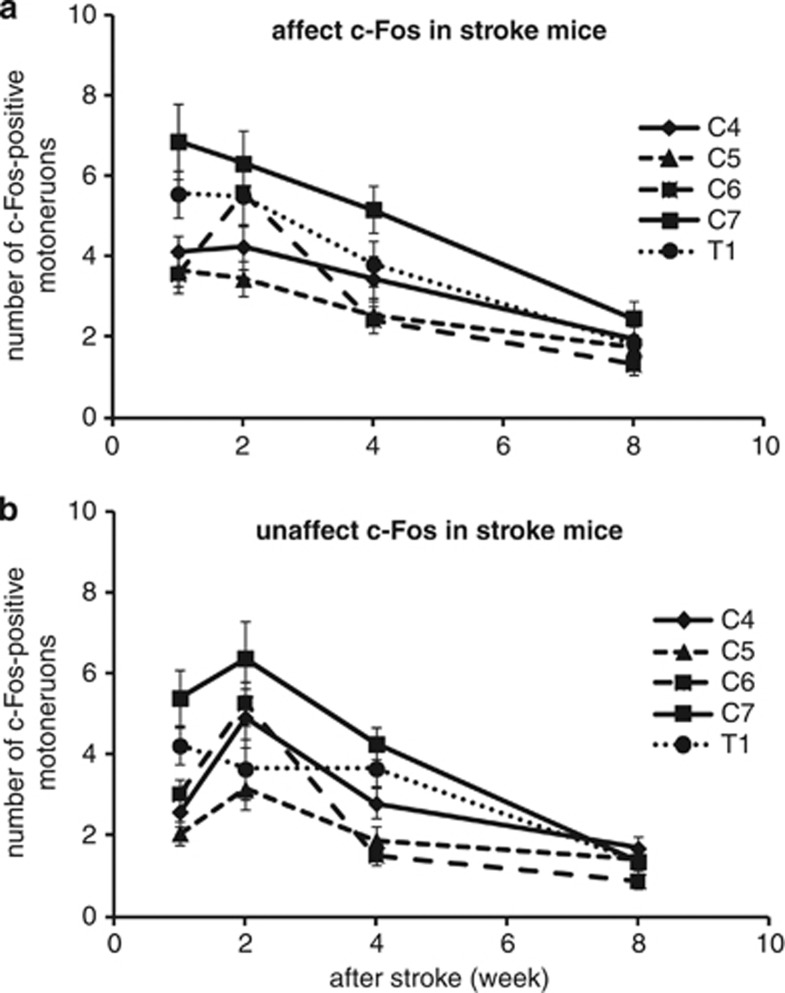
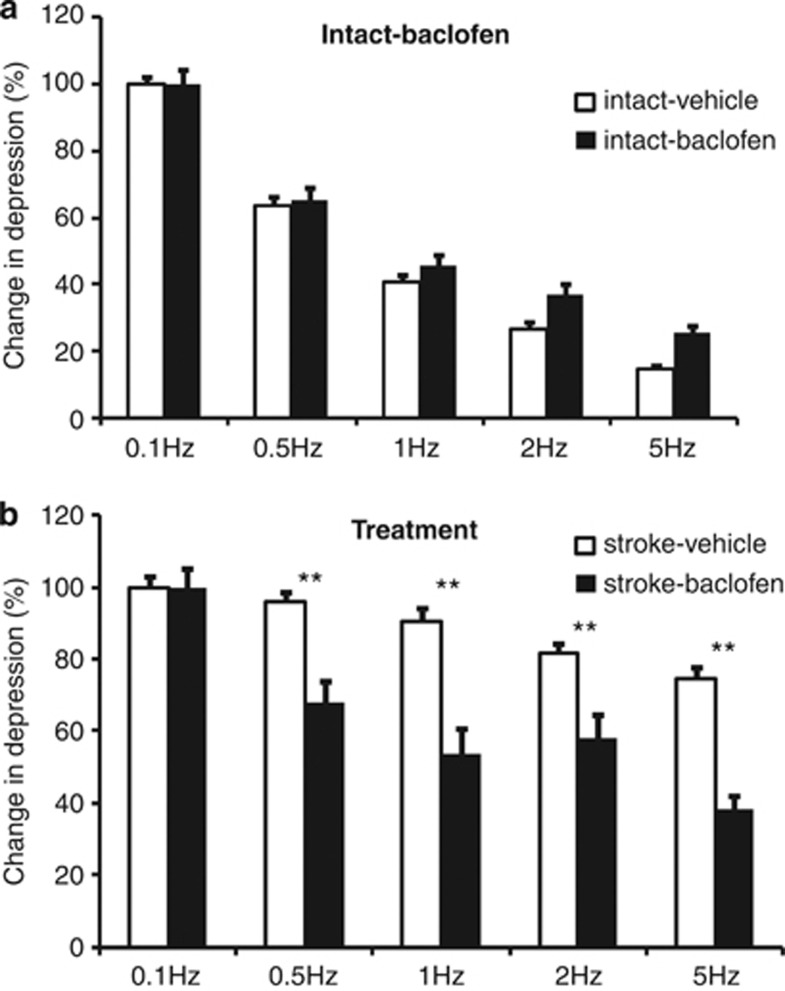
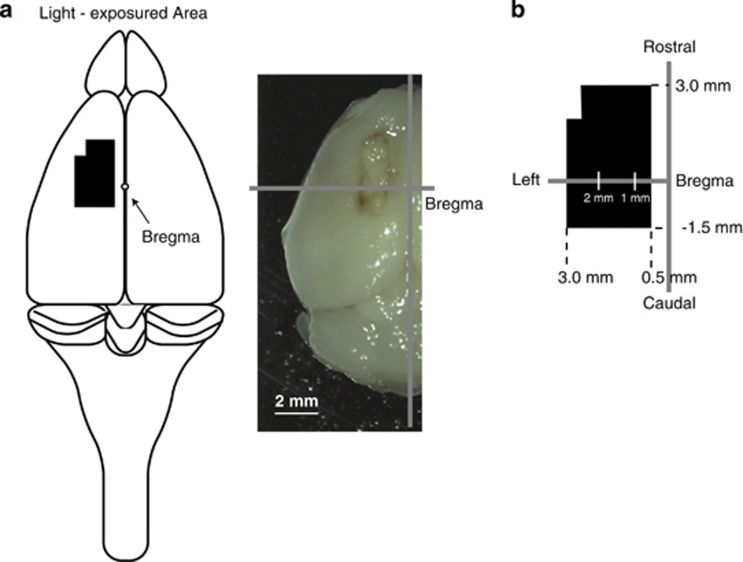
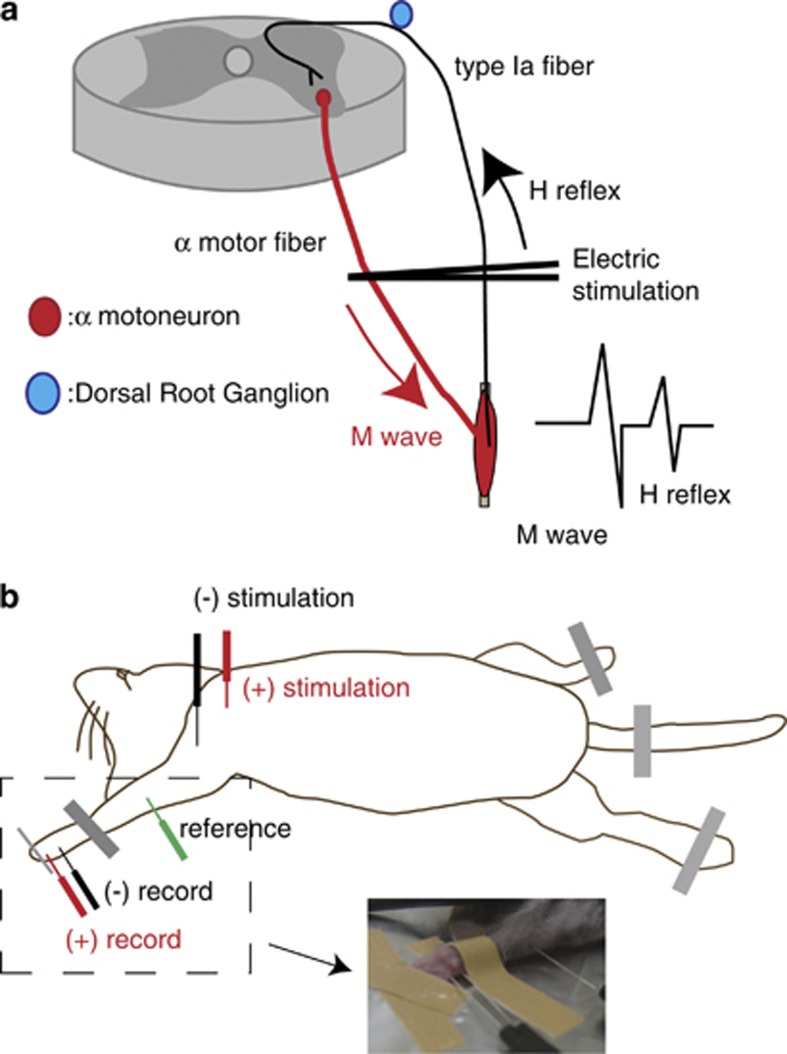
Abnormal reflexes associated with spasticity are considered a major determinant of motor impairments occurring after stroke; however, the mechanisms underlying post-stroke spasticity remain unclear. This may be because of the lack of suitable rodent models for studying spasticity after cortical injuries. Thus, the purpose of the present study was to establish an appropriate post-stroke spasticity mouse model. We induced photothrombotic injury in the rostral and caudal forelimb motor areas of mice and used the rate-dependent depression (RDD) of Hoffmann's reflex (H-reflex) as an indicator of spastic symptoms. To detect motoneuron excitability, we examined c-fos mRNA levels and c-Fos immunoreactivity in affected motoneurons using quantitative real-time reverse transcription PCR and immunohistochemical analysis, respectively. To confirm the validity of our model, we confirmed the effect of the anti-spasticity drug baclofen on H-reflex RDDs 1 week post stroke. We found that 3 days after stroke, the RDD was significantly weakened in the affected muscles of stroke mice compared with sham-operated mice, and this was observed for 8 weeks. The c-fos mRNA levels in affected motoneurons were significantly increased in stroke mice compared with sham-operated mice. Immunohistochemical analysis revealed a significant increase in the number of c-Fos-positive motoneurons in stroke mice compared with sham-operated mice at 1, 2, 4, and 8 weeks after stroke; however, the number of c-Fos-positive motoneurons on both sides of the brain gradually decreased over time. Baclofen treatment resulted in recovery of the weakened RDD at 1 week post stroke. Our findings suggest that this is a viable animal model of post-stroke spasticity.
Figures
Similar articles
-
Down-regulation of KCC2 expression and phosphorylation in motoneurons, and increases the number of in primary afferent projections to motoneurons in mice with post-stroke spasticity.PLoS One. 2014 Dec 29;9(12):e114328. doi: 10.1371/journal.pone.0114328. eCollection 2014. PLoS One. 2014. PMID: 25546454 Free PMC article.
-
Diet-induced obesity decreases rate-dependent depression in the Hoffmann's reflex in adult mice.Physiol Rep. 2019 Oct;7(20):e14271. doi: 10.14814/phy2.14271. Physiol Rep. 2019. PMID: 31660698 Free PMC article.
-
Effects of baclofen on spinal reflexes and persistent inward currents in motoneurons of chronic spinal rats with spasticity.J Neurophysiol. 2004 Nov;92(5):2694-703. doi: 10.1152/jn.00164.2004. J Neurophysiol. 2004. PMID: 15486423
-
Pathophysiology of spasticity in stroke.Neurology. 2013 Jan 15;80(3 Suppl 2):S20-6. doi: 10.1212/WNL.0b013e31827624a7. Neurology. 2013. PMID: 23319482 Review.
-
[Electrophysiological assessment of reflex pathways involved in spasticity].Neurochirurgie. 2003 May;49(2-3 Pt 2):205-14. Neurochirurgie. 2003. PMID: 12746695 Review. French.
Cited by
-
Harnessing cortical plasticity via gabapentinoid administration promotes recovery after stroke.Brain. 2022 Jul 29;145(7):2378-2393. doi: 10.1093/brain/awac103. Brain. 2022. PMID: 35905466 Free PMC article.
-
Early movement restriction leads to enduring disorders in muscle and locomotion.Brain Pathol. 2018 Nov;28(6):889-901. doi: 10.1111/bpa.12594. Epub 2018 Apr 24. Brain Pathol. 2018. PMID: 29437246 Free PMC article.
-
Non-invasive treatment of patients with upper extremity spasticity following stroke using paired trans-spinal and peripheral direct current stimulation.Bioelectron Med. 2019 Jul 23;5:11. doi: 10.1186/s42234-019-0028-9. eCollection 2019. Bioelectron Med. 2019. PMID: 32232101 Free PMC article.
-
Hindlimb spasticity after unilateral motor cortex lesion in rats is reduced by contralateral nerve root transfer.Biosci Rep. 2016 Dec 23;36(6):e00430. doi: 10.1042/BSR20160412. Print 2016 Dec. Biosci Rep. 2016. PMID: 27879456 Free PMC article.
-
Absence of Subcerebral Projection Neurons Is Beneficial in a Mouse Model of Amyotrophic Lateral Sclerosis.Ann Neurol. 2020 Oct;88(4):688-702. doi: 10.1002/ana.25833. Epub 2020 Jul 11. Ann Neurol. 2020. PMID: 32588450 Free PMC article.
References
-
- Nielsen J, Petersen N, Crone C. Changes in transmission across synapses of Ia afferents in spastic patients. Brain. 1995;118 (Pt 4:995–1004. - PubMed
-
- Dietz V, Sinkjaer T. Spastic movement disorder: impaired reflex function and altered muscle mechanics. Lancet Neurol. 2007;6:725–733. - PubMed
-
- Sommerfeld DK, Eek EU, Svensson AK, Holmqvist LW, von Arbin MH. Spasticity after stroke: its occurrence and association with motor impairments and activity limitations. Stroke. 2004;35:134–139. - PubMed
-
- Sommerfeld DK, Gripenstedt U, Welmer AK. Spasticity after stroke: an overview of prevalence, test instruments, and treatments. Am J Phys Med Rehabil. 2012;91:814–820. - PubMed
-
- Koganemaru S, Mima T, Thabit MN, Ikkaku T, Shimada K, Kanematsu M, et al. Recovery of upper-limb function due to enhanced use-dependent plasticity in chronic stroke patients. Brain. 2010;133:3373–3384. - PubMed
Publication types
MeSH terms
Substances
LinkOut - more resources
Full Text Sources
Other Literature Sources
