. 2014 Jan 15;15(1):1040-67.
doi: 10.3390/ijms15011040.

In vitro phosphorylation does not influence the aggregation kinetics of WT α-synuclein in contrast to its phosphorylation mutants

Affiliations

In vitro phosphorylation does not influence the aggregation kinetics of WT α-synuclein in contrast to its phosphorylation mutants

Sarah Schreurs et al. Int J Mol Sci. .

Abstract

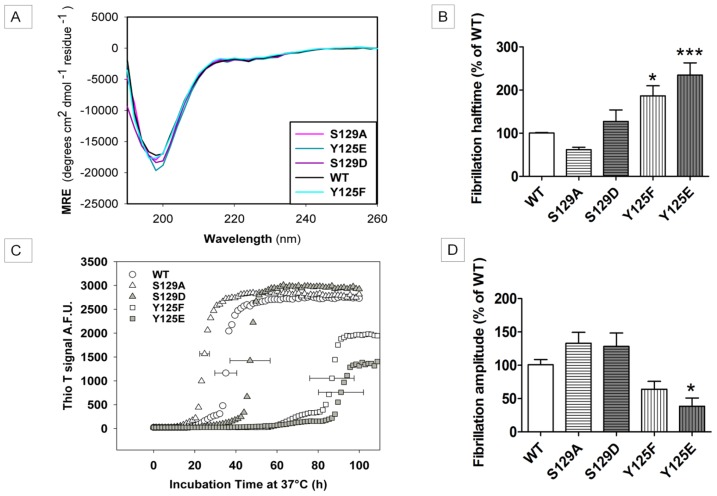
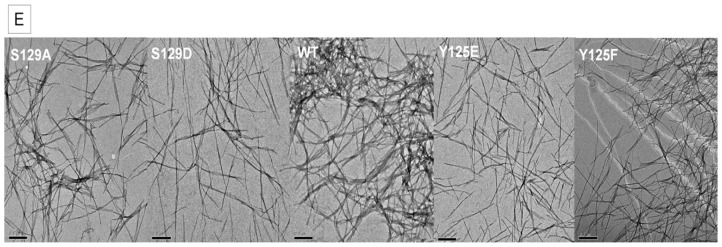
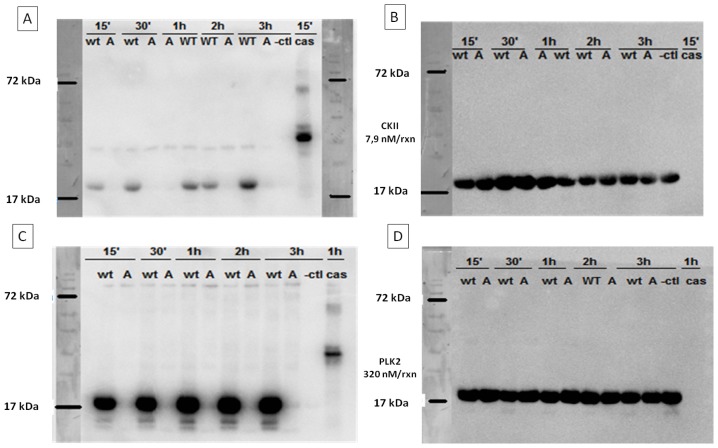
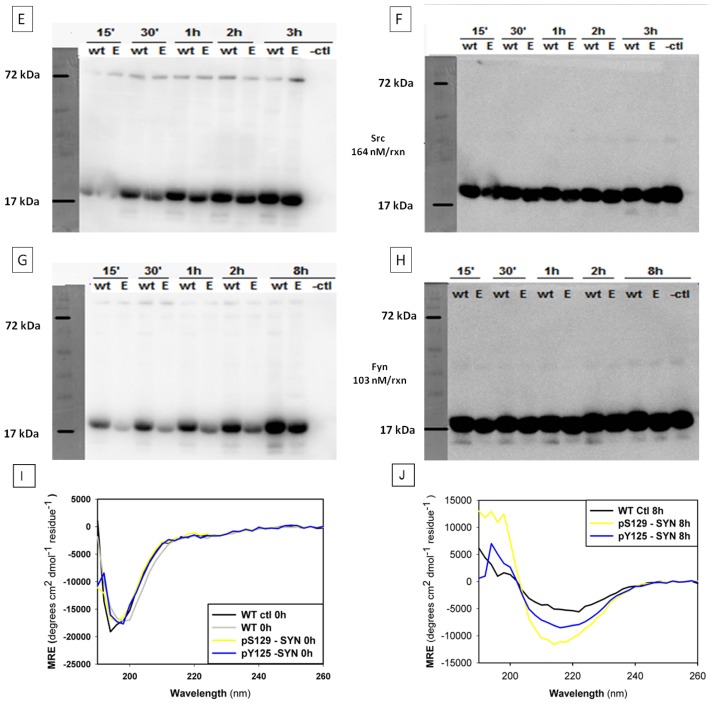
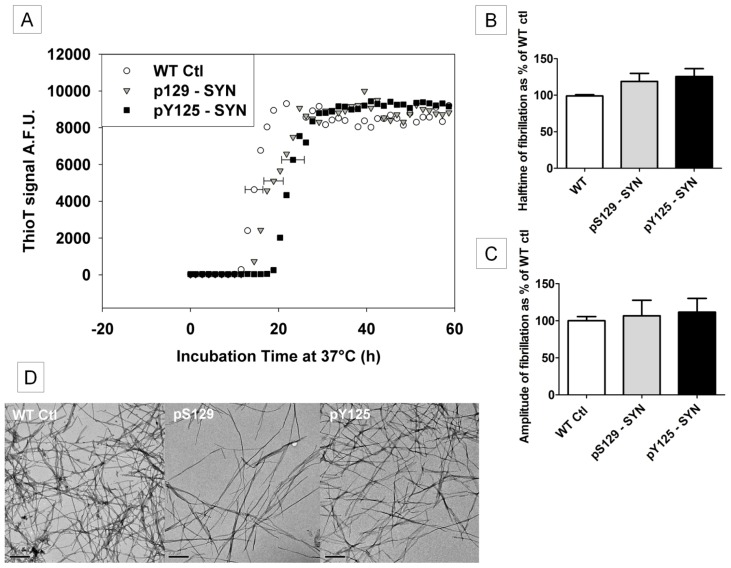
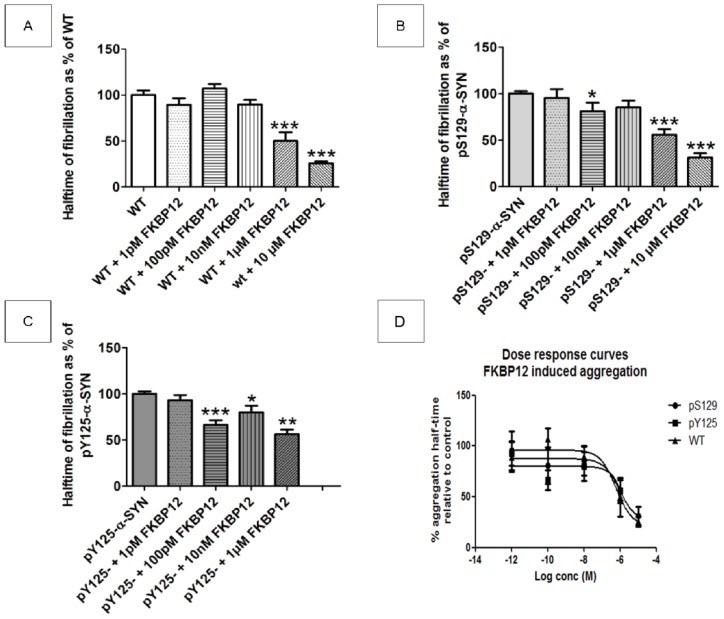
The aggregation of alpha-synuclein (α-SYN) into fibrils is characteristic for several neurodegenerative diseases, including Parkinson's disease (PD). Ninety percent of α-SYN deposited in Lewy Bodies, a pathological hallmark of PD, is phosphorylated on serine129. α-SYN can also be phosphorylated on tyrosine125, which is believed to regulate the membrane binding capacity and thus possibly its normal function. A better understanding of the effect of phosphorylation on the aggregation of α-SYN might shed light on its role in the pathogenesis of PD. In this study we compare the aggregation properties of WT α-SYN with the phospho-dead and phospho-mimic mutants S129A, S129D, Y125F and Y125E and in vitro phosphorylated α-SYN using turbidity, thioflavin T and circular dichroism measurements as well as transmission electron microscopy. We show that the mutants S129A and S129D behave similarly compared to wild type (WT) α-SYN, while the mutants Y125F and Y125E fibrillate significantly slower, although all mutants form fibrillar structures similar to the WT protein. In contrast, in vitro phosphorylation of α-SYN on either S129 or Y125 does not significantly affect the fibrillization kinetics. Moreover, FK506 binding proteins (FKBPs), enzymes with peptidyl-prolyl cis-trans isomerase activity, still accelerate the aggregation of phosphorylated α-SYN in vitro, as was shown previously for WT α-SYN. In conclusion, our results illustrate that phosphorylation mutants can display different aggregation properties compared to the more biologically relevant phosphorylated form of α-SYN.


Figures

Figure 1.
Figure 1.
Far UV-CD spectra of WT α-SYN and its phosphorylation mutants and fibrillization of WT α-SYN compared to the phosphorylation mutants. (A) Far UV-CD spectra of α-SYN and phosphorylation mutants were taken at the start point of further measurements to account for possible secondary structure differences due to the mutations. All spectra have a minimum near 200 nm, typical for a random coil structure. The phosphorylation mutants (Y125F (cyan), Y125E (dark cyan), S129A (pink), S129D (purple)) show spectra similar to that of the WT protein (black), and our obtained values of approximately −20,000 MRE (mean residue ellipticity) correspond well to values of monomeric WT α-SYN found in literature. The kinetics of the fibrillization process of α-SYN WT and phospho-mutants were followed by a Thioflavin T assay under continuous shaking (270 rpm) at 37 °C. A concentration of 50 μM α-SYN was used in each experiment; (B) Mean values of the halftimes; The halftimes of fibrillization are expressed as percentages of WT, which was set to 100%; (C) Representative figure showing an inhibitory effect with both tyrosine mutants (Y125F (white squares) and Y125E (gray squares)). The kinetics of both serine mutants, however, are similar to that of the WT protein (S129A (white triangles), S129D (gray triangles) and WT (white circles)); (D) Mean end phase fluorescence intensities; (B) and (D) are calculated from 5 independent measurements (n = 5) each done in quadruplicate, with the standard error of mean (SEM) shown on each bar. * and *** indicate a statistical significant difference when compared to WT with a p-value < 0.05 and < 0.001 respectively; TEM images were taken and are represented in (E), from left to right: S129A, S129D, WT, Y125E, Y125F. The scale bars are set to 200 nm.
Figure 1.
Figure 1.
Far UV-CD spectra of WT α-SYN and its phosphorylation mutants and fibrillization of WT α-SYN compared to the phosphorylation mutants. (A) Far UV-CD spectra of α-SYN and phosphorylation mutants were taken at the start point of further measurements to account for possible secondary structure differences due to the mutations. All spectra have a minimum near 200 nm, typical for a random coil structure. The phosphorylation mutants (Y125F (cyan), Y125E (dark cyan), S129A (pink), S129D (purple)) show spectra similar to that of the WT protein (black), and our obtained values of approximately −20,000 MRE (mean residue ellipticity) correspond well to values of monomeric WT α-SYN found in literature. The kinetics of the fibrillization process of α-SYN WT and phospho-mutants were followed by a Thioflavin T assay under continuous shaking (270 rpm) at 37 °C. A concentration of 50 μM α-SYN was used in each experiment; (B) Mean values of the halftimes; The halftimes of fibrillization are expressed as percentages of WT, which was set to 100%; (C) Representative figure showing an inhibitory effect with both tyrosine mutants (Y125F (white squares) and Y125E (gray squares)). The kinetics of both serine mutants, however, are similar to that of the WT protein (S129A (white triangles), S129D (gray triangles) and WT (white circles)); (D) Mean end phase fluorescence intensities; (B) and (D) are calculated from 5 independent measurements (n = 5) each done in quadruplicate, with the standard error of mean (SEM) shown on each bar. * and *** indicate a statistical significant difference when compared to WT with a p-value < 0.05 and < 0.001 respectively; TEM images were taken and are represented in (E), from left to right: S129A, S129D, WT, Y125E, Y125F. The scale bars are set to 200 nm.
Figure 2.
Figure 2.
Phosphate incorporation using autoradiography and far UV-CD spectra of (phosphorylated)-α-SYN. Phosphate incorporation was monitored by a radioactivity assay, where ATP-P32 was incubated in the presence of different kinases and WT α-SYN or the S129A/ Y125E mutant. The reaction was stopped at different time points (15 min, 30 min, 1 h, 2 h, 3 h as well as 24 h for PLK2 and Fyn) with SDS-loading dye and boiling for 5 min. Radioactive phosphate incorporation was visualised by autoradiography, after which western blotting was performed to detect relative protein levels. For each time point WT and a respective mutant were used. WT: WT α-SYN, A: S129A α-SYN, E: Y125E α-SYN, -ctl: negative control (kinase boiled for five min prior to test). Cas: casein kinase, used as a positive control for serine phosphorylation. Kinases and the kinase concentrations used in the in vitro phosphorylation assays are given between the blot panels (please refer to the Materials and Methods section for full details on the kinases and phosphorylation procedure) (A) radio-activity blot of CKII phosphorylation; (B) western blot of (A); (C) radioactivity blot of PLK2 phosphorylation; (D) western blot of (C); (E) radioactivity blot of SRC phosphorylation; (F) western blot of (E); (G) radioactivity blot of Fyn phosphorylation; (H) western blot of (G); (I) Far UV-CD spectra of proteins after overnight phosphorylation. All spectra show a minimum near 200 nm comparable to that of WT α-SYN (black line), typical for a random coil structure. The manipulations necessary for phosphorylation and removal of ATP afterwards do not disturb the secondary structure (compare spectrum of WT control (black line) to that of the WT protein (gray line)). pY125-α-SYN: WT α-SYN phosphorylated by Fyn kinase (blue line) and pS129-α-SYN: WT α-SYN phosphorylated by PLK2 kinase (yellow line); and (J) Far UV–CD spectra of pS129-α-SYN (yellow line), pY125-α-SYN (cyan) and their control (WT ctl (black line)), prepared as in (I), after 8 h of continuous agitation. All samples show predominantly a β-sheet structure.
Figure 2.
Figure 2.
Phosphate incorporation using autoradiography and far UV-CD spectra of (phosphorylated)-α-SYN. Phosphate incorporation was monitored by a radioactivity assay, where ATP-P32 was incubated in the presence of different kinases and WT α-SYN or the S129A/ Y125E mutant. The reaction was stopped at different time points (15 min, 30 min, 1 h, 2 h, 3 h as well as 24 h for PLK2 and Fyn) with SDS-loading dye and boiling for 5 min. Radioactive phosphate incorporation was visualised by autoradiography, after which western blotting was performed to detect relative protein levels. For each time point WT and a respective mutant were used. WT: WT α-SYN, A: S129A α-SYN, E: Y125E α-SYN, -ctl: negative control (kinase boiled for five min prior to test). Cas: casein kinase, used as a positive control for serine phosphorylation. Kinases and the kinase concentrations used in the in vitro phosphorylation assays are given between the blot panels (please refer to the Materials and Methods section for full details on the kinases and phosphorylation procedure) (A) radio-activity blot of CKII phosphorylation; (B) western blot of (A); (C) radioactivity blot of PLK2 phosphorylation; (D) western blot of (C); (E) radioactivity blot of SRC phosphorylation; (F) western blot of (E); (G) radioactivity blot of Fyn phosphorylation; (H) western blot of (G); (I) Far UV-CD spectra of proteins after overnight phosphorylation. All spectra show a minimum near 200 nm comparable to that of WT α-SYN (black line), typical for a random coil structure. The manipulations necessary for phosphorylation and removal of ATP afterwards do not disturb the secondary structure (compare spectrum of WT control (black line) to that of the WT protein (gray line)). pY125-α-SYN: WT α-SYN phosphorylated by Fyn kinase (blue line) and pS129-α-SYN: WT α-SYN phosphorylated by PLK2 kinase (yellow line); and (J) Far UV–CD spectra of pS129-α-SYN (yellow line), pY125-α-SYN (cyan) and their control (WT ctl (black line)), prepared as in (I), after 8 h of continuous agitation. All samples show predominantly a β-sheet structure.
Figure 3.
Figure 3.
Fibrillization of (phosphorylated)-α-SYN. The kinetics of fibrillization of phosphorylated α-SYN (30 μM) monitored by ThioT fluorescence. Before the ThioT assay all samples were incubated overnight at 30 °C with ATP and the respective kinases. The next day ATP was removed by buffer exchange as described in Materials and Methods. The control was subjected to the same incubations/buffer exchange without the addition of ATP/kinase. (A) Representative measurement showing comparable kinetics of pY125-α-SYN (black squares), pS129-α-SYN (gray triangles) and WT ctl (white circles); (B) Mean halftimes and (C) mean end phase amplitudes, obtained from five independent measurements (n = 5) each done in quadruplicate, SEM is shown on each bar. The values of pS129-α-SYN and pY125-α-SYN are expressed as percent of their control (WT Ctl); and (D) TEM images were taken at the end of the measurements to confirm fibril formation. From left to right: WT ctl, pS129: pS129-α-SYN, pY125: pY125-α-SYN. Scale bars are set to 200 nm.
Figure 4.
Figure 4.
The influence of FKBP12 on the fibrillization of (phosphorylated)-α-SYN. The influence of FKBP12 on the fibrillization kinetics of WT α-SYN (A); pS129-α-SYN (B) and pY125-α-SYN (C) (all 30 μM). For FKBP12 a concentration range was used: no FKBP12, 1 pM FKBP12, 100 pM FKBP12, 10 nM FKBP12, 1 μM FKBP12 and 10 μM FKBP12. Mean halftimes are shown and were obtained from four independent measurements (n = 4) each done in quadruplicate, SEM is shown on the bars. The conditions with FKBP12 present are expressed as percentages of the respective control: α-SYN (WT, pS129 or pY125) without FKBP12, *, ** and *** indicate a statistical significant difference when compared to WT with a p-value < 0.05, a p-value < 0.01 or a p-value < 0.001 respectively; and (D) Values of aggregation half-times from Figure 4 are plotted in an xy plot and a dose response curve is fitted using GraphPad Prism (least squares method, fit equation is Y = Bottom + (Top − Bottom)/(1 + 10(X – log EC50)). The EC50 values of FKBP12 in reducing the aggregation half-time of the different α-SYN variants are comparable for all experimental groups, ranging from 0.6 to 1 μM. WT, normal α-SYN; pS129, α-SYN phosphorylated at S129 by PLK2; pY125, α-SYN phosphorylated at Y125 by Fyn kinase.

Similar articles

Cited by

References

    1. Spillantini M.G., Schmidt M.L., Lee V.M., Trojanowski J.Q., Jakes R., Goedert M. Alpha-synuclein in Lewy bodies. Nature. 1997;388:839–840. - PubMed
    1. Baba M., Nakajo S., Tu P.H., Tomita T., Nakaya K., Lee V.M., Trojanowski J.Q., Iwatsubo T. Aggregation of alpha-synuclein in Lewy bodies of sporadic Parkinson's disease and dementia with Lewy bodies. Am. J. Pathol. 1998;152:879–884. - PMC - PubMed
    1. Bertoncini C.W., Jung Y.S., Fernandez C.O., Hoyer W., Griesinger C., Jovin T.M., Zweckstetter M. Release of long-range tertiary interactions potentiates aggregation of natively unstructured alpha-synuclein. Proc. Natl. Acad. Sci. USA. 2005;102:1430–1435. - PMC - PubMed
    1. Dedmon M.M., Lindorff-Larsen K., Christodoulou J., Vendruscolo M., Dobson C.M. Mapping long-range interactions in alpha-synuclein using spin-label NMR and ensemble molecular dynamics simulations. J. Am. Chem. Soc. 2005;127:476–477. - PubMed
    1. Abeliovich A., Schmitz Y., Farinas I., Choi-Lundberg D., Ho W.H., Castillo P.E., Shinsky N., Verdugo J.M., Armanini M., Ryan A., et al. Mice lacking alpha-synuclein display functional deficits in the nigrostriatal dopamine system. Neuron. 2000;25:239–252. - PubMed

Publication types

Substances