Oscillatory activity in neocortical networks during tactile discrimination near the limit of spatial acuity
- PMID: 24434679
- PMCID: PMC4307021
- DOI: 10.1016/j.neuroimage.2014.01.007
Oscillatory activity in neocortical networks during tactile discrimination near the limit of spatial acuity
Abstract
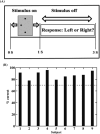
Oscillatory interactions within functionally specialized but distributed brain regions are believed to be central to perceptual and cognitive functions. Here, using human scalp electroencephalography (EEG) recordings combined with source reconstruction techniques, we study how oscillatory activity functionally organizes different neocortical regions during a tactile discrimination task near the limit of spatial acuity. While undergoing EEG recordings, blindfolded participants felt a linear three-dot array presented electromechanically, under computer control, and reported whether the central dot was offset to the left or right. The average brain response differed significantly for trials with correct and incorrect perceptual responses in the timeframe approximately between 130 and 175ms. During trials with correct responses, source-level peak activity appeared in the left primary somatosensory cortex (SI) at around 45ms, in the right lateral occipital complex (LOC) at 130ms, in the right posterior intraparietal sulcus (pIPS) at 160ms, and finally in the left dorsolateral prefrontal cortex (dlPFC) at 175ms. Spectral interdependency analysis of activity in these nodes showed two distinct distributed networks, a dominantly feedforward network in the beta band (12-30Hz) that included all four nodes and a recurrent network in the gamma band (30-100Hz) that linked SI, pIPS and dlPFC. Measures of network activity in both bands were correlated with the accuracy of task performance. These findings suggest that beta and gamma band oscillatory networks coordinate activity between neocortical regions mediating sensory and cognitive processing to arrive at tactile perceptual decisions.
Keywords: Brain rhythms; Connectivity; EEG; ERP; Granger causality; Oscillations; Perceptual decision-making; Somatosensory; Touch.
Copyright © 2014 The Authors. Published by Elsevier Inc. All rights reserved.
Conflict of interest statement
No conflicts of Interest
Disclosure Statement: There is no conflict of interest for any of the authors.
Figures


Similar articles
-
Posteromedial parietal cortical activity and inputs predict tactile spatial acuity.J Neurosci. 2007 Oct 10;27(41):11091-102. doi: 10.1523/JNEUROSCI.1808-07.2007. J Neurosci. 2007. PMID: 17928451 Free PMC article.
-
Oscillatory cortico-cortical connectivity during tactile discrimination between dynamic and static stimulation.Cereb Cortex. 2024 Sep 3;34(9):bhae277. doi: 10.1093/cercor/bhae277. Cereb Cortex. 2024. PMID: 39331031
-
The salience network dynamics in perceptual decision-making.Neuroimage. 2016 Jul 1;134:85-93. doi: 10.1016/j.neuroimage.2016.04.018. Epub 2016 Apr 11. Neuroimage. 2016. PMID: 27079535
-
Neocortical dynamics during whisker-based sensory discrimination in head-restrained mice.Neuroscience. 2018 Jan 1;368:57-69. doi: 10.1016/j.neuroscience.2017.09.003. Epub 2017 Sep 14. Neuroscience. 2018. PMID: 28919043 Free PMC article. Review.
-
Interareal oscillatory synchronization in top-down neocortical processing.Curr Opin Neurobiol. 2015 Apr;31:62-6. doi: 10.1016/j.conb.2014.08.010. Epub 2014 Sep 15. Curr Opin Neurobiol. 2015. PMID: 25217807 Review.
Cited by
-
Top-Down Control of Visual Alpha Oscillations: Sources of Control Signals and Their Mechanisms of Action.Front Hum Neurosci. 2016 Jan 20;10:15. doi: 10.3389/fnhum.2016.00015. eCollection 2016. Front Hum Neurosci. 2016. PMID: 26834601 Free PMC article.
-
Video game players have improved decision-making abilities and enhanced brain activities.Neuroimage Rep. 2022 Jun 22;2(3):100112. doi: 10.1016/j.ynirp.2022.100112. eCollection 2022 Sep. Neuroimage Rep. 2022. PMID: 40567307 Free PMC article.
-
Neuronal Oscillations in Various Frequency Bands Differ between Pain and Touch.Front Hum Neurosci. 2016 Apr 29;10:182. doi: 10.3389/fnhum.2016.00182. eCollection 2016. Front Hum Neurosci. 2016. PMID: 27199705 Free PMC article.
-
Tactile estimation of hedonic and sensory properties during active touch: An electroencephalography study.Eur J Neurosci. 2023 Sep;58(6):3412-3431. doi: 10.1111/ejn.16101. Epub 2023 Jul 30. Eur J Neurosci. 2023. PMID: 37518981 Free PMC article.
-
Visuo-haptic multisensory object recognition, categorization, and representation.Front Psychol. 2014 Jul 17;5:730. doi: 10.3389/fpsyg.2014.00730. eCollection 2014. Front Psychol. 2014. PMID: 25101014 Free PMC article. Review.
References
-
- Allison T, McCarthy G, Wood CC, Darcey TM, Spencer DD, Williamson PD. Human cortical potentials evoked by stimulation of the median nerve. I. Cytoarchitectonic areas generating short-latency activity. J Neurophysiol. 1989;62:694–710. - PubMed
-
- Amedi A, Jacobson G, Hendler T, Malach R, Zohary E. Convergence of visual and tactile shape processing in the human lateral occipital complex. Cereb Cortex. 2002;12:1202–1212. - PubMed
-
- Amedi A, Malach R, Hendler T, Peled S, Zohary E. Visuo-haptic object-related activation in the ventral visual pathway. Nat Neurosci. 2001;4:324–330. - PubMed
Publication types
MeSH terms
Grants and funding
LinkOut - more resources
Full Text Sources
Other Literature Sources

