

Review
doi: 10.1038/nrn3668.
Epub 2014 Jan 17.
Oscillatory multiplexing of population codes for selective communication in the mammalian brain
Affiliations
- PMID: 24434912
- PMCID: PMC4724886
- DOI: 10.1038/nrn3668
Item in Clipboard
Review
Oscillatory multiplexing of population codes for selective communication in the mammalian brain
Nat Rev Neurosci.
2014 Feb.
Abstract
Mammalian brains exhibit population oscillations, the structures of which vary in time and space according to behavioural state. A proposed function of these oscillations is to control the flow of signals among anatomically connected networks. However, the nature of neural coding that may support selective communication that depends on oscillations has received relatively little attention. Here, we consider the role of multiplexing, whereby multiple information streams share a common neural substrate. We suggest that multiplexing implemented through periodic modulation of firing-rate population codes enables flexible reconfiguration of effective connectivity among brain areas.
Figures
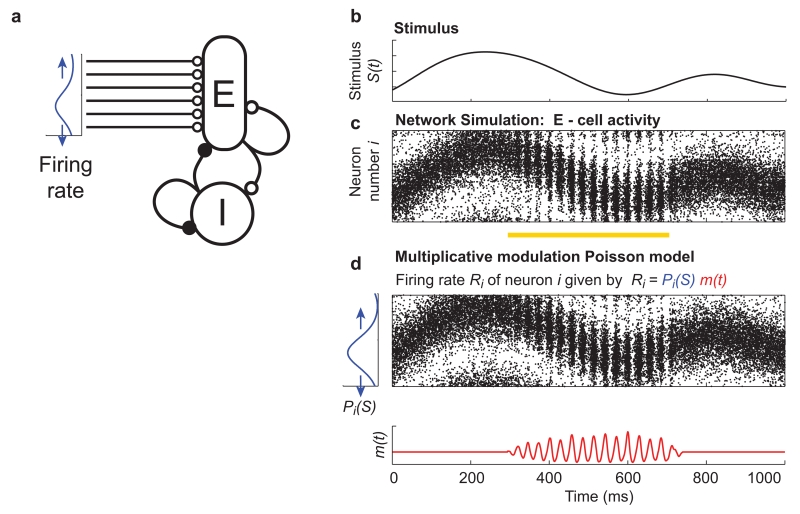
(a) Schematic illustrating a network model consisting of an excitatory (E) and an inhibitory (I) population of integrate and fire neurons, recurrently and reciprocally connected. A time varying stimulus (b) is encoded by the activity of the excitatory population as a firing rate population code with bell shaped tuning curves, such that as the value of the stimulus changes a localised bump of activity moves across the population (c). The stimulus tuning is inherited from spatially patterned external input, i.e. the firing rate of external input received by excitatory cells varies across the population as a bell shaped curve (a – blue trace), the position of which changes with the value of the stimulus (a - blue arrows). The network transitions from an asynchronous to a sparsely synchronised state (Box 1) and back again as a result of a change in recurrent synaptic connection strengths, which could occur for example due to altered neuromodulation (yellow bar indicates period with modified synaptic weights). The network oscillation produces an approximately multiplicative modulation of the firing rate population code. This can be seen from the close similarity of the simulated activity in (c) to that of a population of Poisson neurons (units with uncorrelated inter-spike intervals whose firing probability is determined entirely by a time varying instantaneous firing rate) shown in (d). The firing probability of each unit was generated by a bell-shaped spatial pattern of activity (blue curve), whose position varied with the stimulus, multiplicatively modulated by a rapidly oscillating ‘carrier’ signal during the oscillating state (red curve). Network model is the input network from ref .
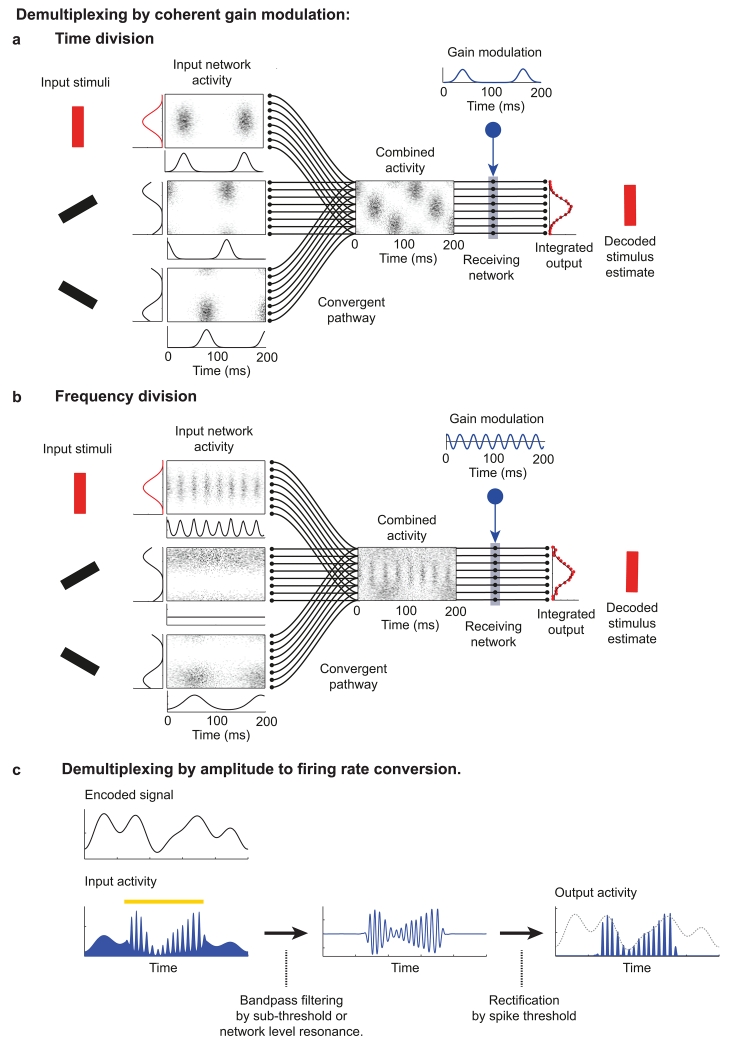
(a, b) Schematic showing how selective communication can be achieved through coherence between oscillations in a sending (input) network and periodic gain modulation in a receiving region. A set of three input networks encode separate stimuli, in this case the orientation of a bar, as a firing rate population code. Each input network consists of a population of Poisson neurons whose firing rate is given by a bell shaped tuning curve with respect to stimulus orientation, multiplied by an oscillatory modulation that is common to all neurons in a given input network (as in figure 1d). For each input network we show the spatio-temporal pattern of activity over 200 ms (box), the average firing rate of each neuron (curve left of box), and the oscillatory modulation (curve below box). These input networks converge to provide a combined input to a receiving network. The information encoded in one input network (the ‘target’ input shown in red), can be selectively routed through the convergent pathway by periodic modulation of the gain of neurons in the receiving network coherent with the oscillation of the target input (gain modulation input is shown in blue, the time course of gain modulation shown by the blue trace). The receiving network was not modelled biophysically but rather consisted of units with a linear input – output function whose slope was determined by the gain modulation input. The output of the receiving network is integrated over time to produce a spatial pattern of activity that reflects only the activity of the target input, from which the target stimulus can be accurately estimated. In panel (a) time division principles are used to segregate the activity of the different input pathways; each input is modulated at a different phase relative to a single oscillation. In panel (b) frequency division is used to segregate the different inputs; one distracting input oscillates in a frequency band that does not overlap with the target input, while the other distracting input is asynchronous and hence only transmits its population code into the average firing rate or 0 Hz channel. Note that the gain modulation in the receiving network takes both positive and negative values. Positive and negative net gain can be implemented by an excitatory pathway balanced by feed-forward inhibition. Adapted from ref . (c) An alternative method to achieve selective readout of frequency-division multiplexed signals. A time varying signal (‘encoded signal’ on figure) is encoded into the firing rate of an input population. Input activity is multiplicatively modulated during a transient burst of oscillatory activity (indicated by yellow bar), reproducing the encoded signal into the amplitude envelope of firing rate fluctuations at the oscillation frequency. By bandpass-filtering and then rectifying the input activity, the encoded signal can be selectively recovered when the input activity is modulated at the appropriate frequency but otherwise ignored, allowing bursts of oscillatory activity to propagate information selectively. A biophysical model implementing selective communication using this principle is detailed in ref .
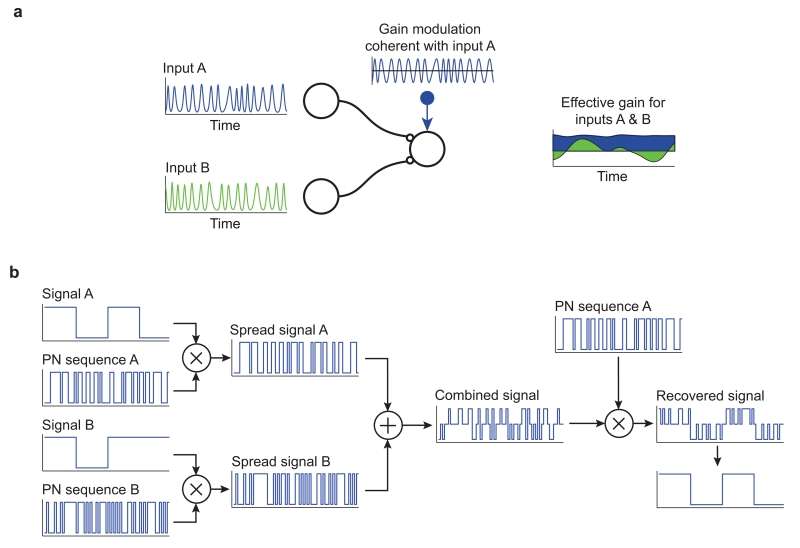
(a) Two networks, A & B, oscillating incoherently in the same broad frequency band provide convergent input to a receiving network. Applying gain modulation to units in the receiving network coherent with input A can increase the average gain for that input relative to input B. However, this is achieved at the cost of fluctuations in effective gain for input B as it drifts in and out of phase with A (effective gain plotted in the right panel is the overlap of each input’s oscillation with the gain modulation waveform, smoothed with a Gaussian of standard deviation one oscillation period). These fluctuations act as a source of noise and degrade the accuracy of selective communication when compared with situations where different inputs are segregated by time- or frequency- division principles. (B) Code division multiple access (CDMA), a spread spectrum multiplexing scheme used in telecommunication, provides a useful analogy with multiplexing in the CTC hypothesis. Two digital signals, A and B, are modulated by different binary pseudorandom noise (PN) sequences known as spreading codes. The rate of the PN sequence is much higher than the rate of the signal; in this example each bit of the signal corresponds to 16 bits of the PN sequence. Modulation can be achieved simply by multiplying the signal with the PN code if true and false binary values are treated as 1 and −1 respectively. The resulting spread signals are combined for transmission through a single physical communication channel. For clarity we show simply the sum of the digital spread signals, though in practical applications the digital signals are typically encoded into modulation of an analogue carrier wave. A receiver can selectively recover one of the component signals by correlating the combined signal with the appropriate PN sequence.
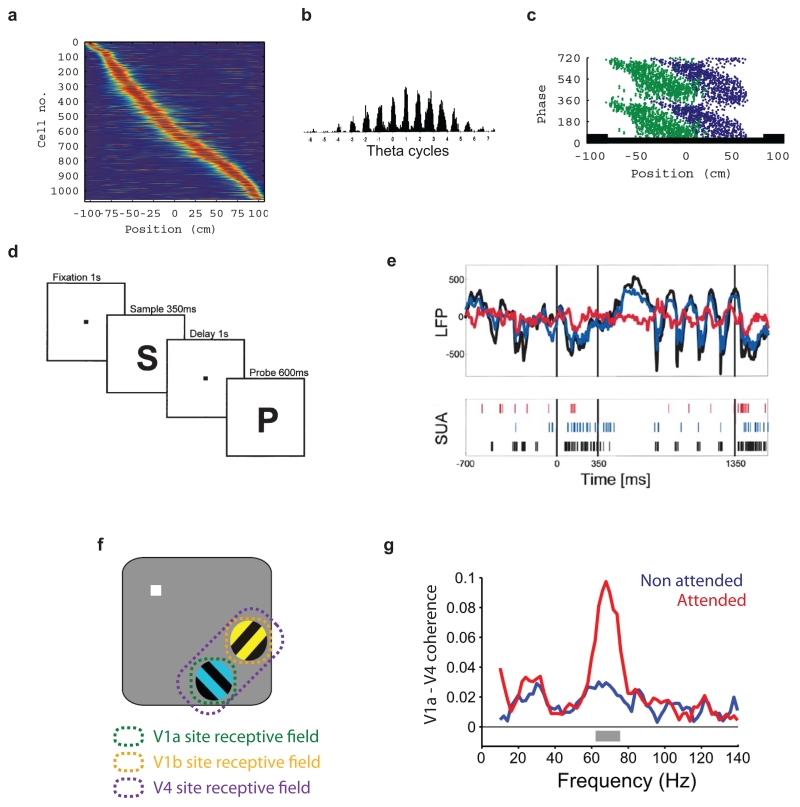
(a – c) Activity during theta oscillations in rodent hippocampus appears consistent with time division multiplexing of firing rate population codes. Data shown is from recordings in the CA1 region during runs in a single direction on a linear track. (a) Normalised firing rates of ~1,000 neurons as a function of the animal’s position, sorted along the Y-axis by the position of peak firing. The firing rate of individual cells is tightly tuned for the animal’s position on the track and the distribution of firing rates across the population of cells forms a population code for position. (b) Spike count for a single cell as a function of theta phase constructed from multiple runs through the cell’s place field. Spikes were aligned by theta phase and number of theta cycle relative to the time at which the rat passed a given position near the centre of the place field. Note the slow change in average firing rate relative to the rapid oscillatory modulation consistent with a separation of timescales between variation of the encoded variable and the oscillatory modulation. Note also the strong correlation across cycles between average firing rate and amplitude of firing rate modulation, consistent with approximately multiplicative modulation of activity by the network oscillation. (c) Activity of two cells as a function of position and theta phase. The two cells are active at largely non-overlapping phases of theta, as required for time division multiplexing, and both precess to earlier phases as the animal traverses the place field. (d - e) Bursts of network oscillation are a possible signature of selective communication using frequency division principles (see main text). One striking example of an oscillation occurring at a specific point during behaviour has been reported in area V4 in a working memory task in macaque. (d) Sequence of events during each trial of the task; after visual fixation on a central target, monkeys were presented with a sample stimulus followed, after a delay period, by a probe stimulus. If the probe stimulus was the same as the sample, the subject could obtain a reward by releasing a lever, while if the probe differed from the sample, reward was obtained by withholding the response. (e) Local field potential recordings in visual area V4 showed theta frequency oscillation selectively during the delay period (top panel). Simultaneously recorded spike activity in V4 showed phase locking to the delay period theta oscillations (bottom panel). (f, g) Striking changes in gamma band coherence have recently been reported between V1 and V4 in visual attention tasks. (f) Two drifting gratings were presented in the peripheral visual field while a monkey fixated on a central spot. The stimuli were spaced such that each was represented by separate V1 regions but both fell within the receptive field of a single V4 region. Activity in all three regions was simultaneously monitored using ECoG. The fixation target changed colour to indicate which grating should be attended on a given trial. The subject had to detect a subtle change in the shape of the attended target while ignoring any change in the distracting stimulus. (g) Though both attended and unattended target induced oscillations of comparable amplitude in a 50 – 80 Hz gamma band in their respective V1 regions (not shown), coherence was dramatically enhanced between the region of V1 representing the attended stimulus and V4. These findings have been interpreted in the CTC framework as a mechanism for selectively routing information from the attended V1 region to V4. The observations appear inconsistent with either time- or frequency- division multiplexing as the oscillations in the two V1 regions overlap substantially in frequency and do not have a consistent phase offset. See main text for further discussion. Adapted from references; a,c
, b
, d,e
, f,g
.
References
Publication types
MeSH terms
Grants and funding
LinkOut - more resources
Full Text Sources
Other Literature Sources
