. 2014:5:3075.
doi: 10.1038/ncomms4075.

Drawing a high-resolution functional map of adeno-associated virus capsid by massively parallel sequencing

Affiliations
Free PMC article

Drawing a high-resolution functional map of adeno-associated virus capsid by massively parallel sequencing

Kei Adachi et al. Nat Commun. 2014.
Free PMC article

Abstract

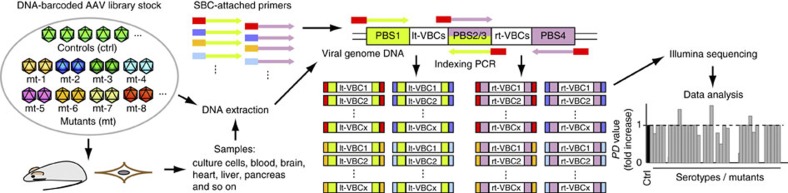
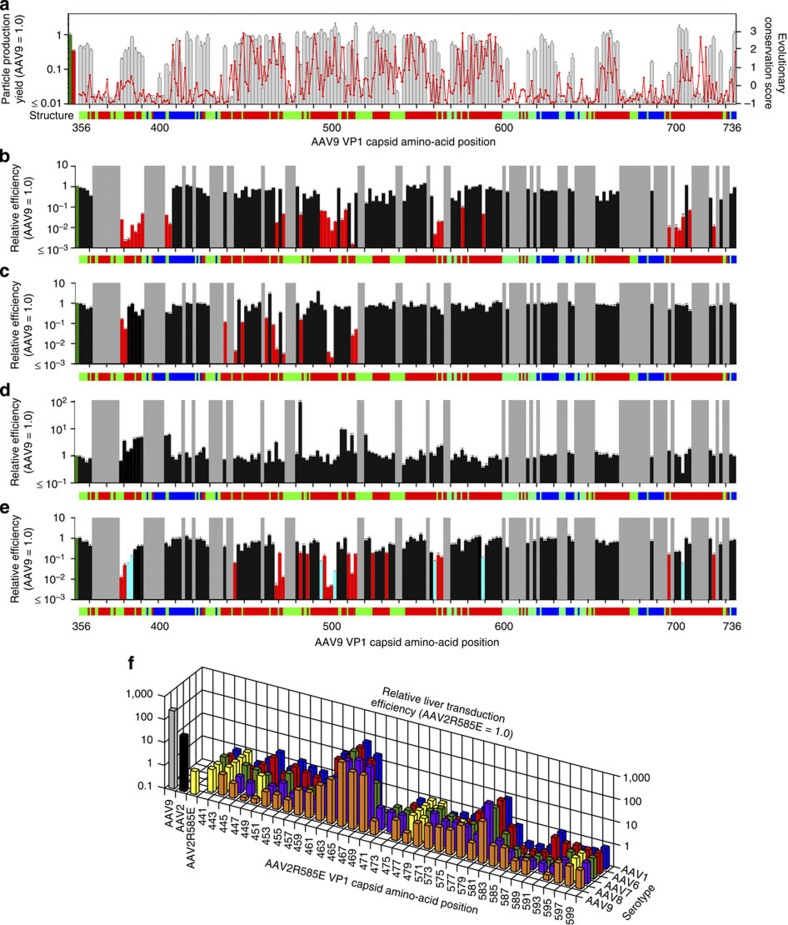
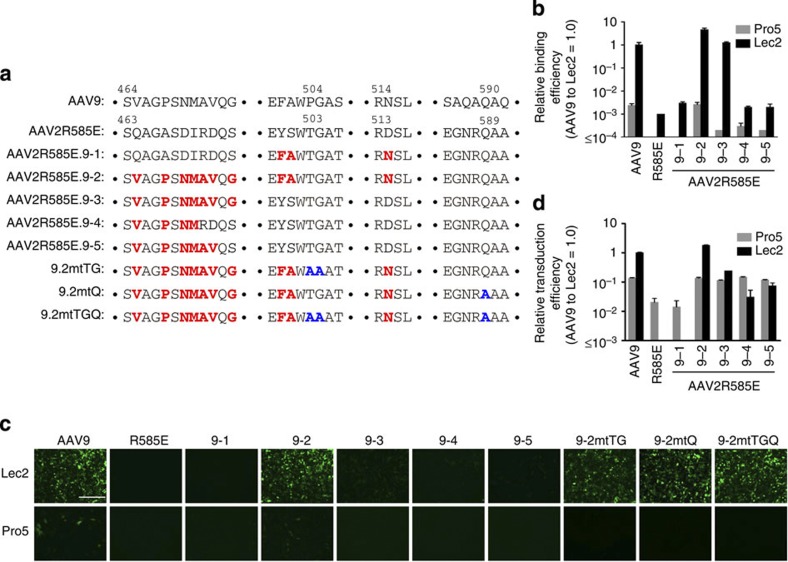
Adeno-associated virus (AAV) capsid engineering is an emerging approach to advance gene therapy. However, a systematic analysis on how each capsid amino acid contributes to multiple functions remains challenging. Here we show proof-of-principle and successful application of a novel approach, termed AAV Barcode-Seq, that allows us to characterize phenotypes of hundreds of different AAV strains in a high-throughput manner and therefore overcomes technical difficulties in the systematic analysis. In this approach, we generate DNA barcode-tagged AAV libraries and determine a spectrum of phenotypes of each AAV strain by Illumina barcode sequencing. By applying this method to AAV capsid mutant libraries tagged with DNA barcodes, we can draw a high-resolution map of AAV capsid amino acids important for the structural integrity and functions including receptor binding, tropism, neutralization and blood clearance. Thus, Barcode-Seq provides a new tool to generate a valuable resource for virus and gene therapy research.


Conflict of interest statement

T.E. and Y.K. are employees who receive salary from Takara Bio Inc. K.A. and H.N. are inventors of the technology arising from this work and licensed by Takara Bio Inc.

Figures

Figure 1
Figure 1. DNA-barcoded AAV libraries.
(a) Viral genome maps of AAV-Serotype-VBCLib, AAV9-AA-VBCLib, and AAV2R585E-HP-VBCLib. Each viral genome contains a pair of 12 nucleotide-long DNA barcodes (lt-VBC and rt-VBC) downstream of the AAV2 polyadenylation signal (pA). PBS1–4, PCR primer-binding sites. Nhe I and Bsr GI indicate the restriction enzyme recognition sites used for DNA barcode cloning. (b) Double alanine (AA) mutagenesis of the C-terminal half of the AAV9 VP1 capsid protein from amino-acid positions 356 to 736. AAxxx’s are the names of AA mutants. (c) HP scanning mutagenesis of the AAV2R585E capsid. We moved HPs derived from AAV1, 6, 7, 8 and 9 on the AAV2R585E capsid at a two amino-acid interval within the regions of interest. (d) Structure of the AAV capsid VP protein indicating the region we investigated in this study. The blue region was examined for AAV9 mutants, and the red region was examined for both AAV9 mutants and AAV2R585E mutants. The same colours are also used to indicate the regions in b and c. The AAV9 capsid structure is presented as a representative of all the serotypes used in this study. (e) A schematic representation of the high-throughput site-directed capsid mutagenesis procedure used. We applied a bridging PCR technique using an artificially created codon-modified DNA as a template, which had at least two Dpn I sites between the P1-For and P4-Rev common PCR primer-binding sites. P2-Rev and P3-For are a mutation-specific set of PCR primers. We pooled up to 50 PCR amplicons at an equimolar ratio, created a mutant library and sent transformed bacteria in a 96-well format to DNA sequencing service for screening.
Figure 2
Figure 2. Procedure for the AAV Barcode-Seq analysis.
We applied DNA-barcoded AAV library stocks to tissue culture cells for receptor binding and in vitro transduction assays. We injected them into mice to investigate blood clearance rate, tissue tropism, reactivity to neutralizing antibodies and anti-AAV neutralizing antibody epitope mapping. We then collected various samples, extracted DNA, PCR-amplified AAV clone-specific Virus Bar Codes (VBCs) using Sample-specific Bar Code (SBC)-attached PCR primers. We mixed all the VBC–PCR amplicons in a pool, and sequenced them on the Illumina platform. We then converted raw sequence read number data to PD values by a computational algorithm.
Figure 3
Figure 3. Results of the AAV Barcode-Seq analysis.
(a) Mapping of the AAV9 capsid amino acids important for viral particle formation. Grey bars indicate viral particle production yield in HEK293 cells determined by AAV Barcode-Seq. Evolutionary conservation scores determined by the ConSurf analysis are shown with a red line. Highly conserved amino acids show low scores. Topological locations of each amino acid are shown as a horizontal colour bar. The red, blue and green regions indicate outer surface-exposed, inner surface-exposed and buried amino acids, respectively. The far left green and red bars represent the wild-type AAV9 and AAV2R585E, respectively. (b) Liver transduction efficiency of each AAV9 AA mutant. The mutants shown with red bars are liver-detargeting mutants (>90% reduction of liver transduction efficiency). (c,d) Results of the cell surface binding assay of the AAV9 mutants using Lec2 (c) and Pro5 (d) cells. The mutants shown with red bars in c are the 14 mutants exhibiting a >80% loss of the binding ability compared with the wild type. These 14 mutants were L380A/T381A, L382A/N383A, I440A/D441A, Y446A/L447A, T450A/I451A, V465A, P468A/S469A, N470A/M471A, Q474A/G475A, Y484A/R485A, E500A/F501A, W503A, R514A/N515A and S516/L517A. (e) Transduction efficiency of the AAV9 mutants in Lec2 cells. The mutants shown with red or cyan bars are those exhibiting a >80% loss of transduction efficiency compared with the wild type. The mutants with cyan bars are the seven mutants that showed impaired postattachment viral processing deduced by a >80% reduction of the transduction-to-binding ratios. These seven mutants were D384A/G385A, S386A/Q387A, N496A/N497A, P504A/G505A, N562A/E563A, Q590A and Y706A/K707A. In be, the grey regions indicate the AAV9 mutants that exhibited a >95% decrease in the viral particle formation compared with the wild type and therefore are devoid of functional phenotype data; the leftmost green bars represent the wild-type AAV9. (f) Liver transduction efficiency of each AAV2R585E HP mutant. Note that yellow bars are all AAV2R585E because HP replacement in them does not change their amino-acid sequence. In all the panels, error bars represent s.e.m. The number of replicates is detailed in Supplementary Data.
Figure 4
Figure 4. Liver and heart transduction with AAV9 and AAV2R585E mutants.
We injected C57BL/6 wild type or Rag−/− mice with AAV-CMV-lacZ vector packaged with various AAV capsids at a dose of 3 × 10¹¹ or 1 × 10¹² vg per mouse intravenously (n=3 per group). We harvested tissues 11 days (wild type) or 6 weeks (Rag1−/−) post injection and performed X-Gal staining to determine transduction efficiency. Tissue sections were counterstained with light hematoxylin. This experiment was performed once. Scale bars, 1 mm for the heart and 200 μm for the liver.
Figure 5
Figure 5. Characterization of the AAV2R585E mutants carrying amino acids responsible for galactose binding.
(a) Capsid amino-acid sequences of a series of the AAV2R585E-derived mutants. (b) Cell surface binding of the AAV2R585E mutants. We produced dsAAV-CMV-GFP vectors packaged in each AAV2R585E mutant capsid. We exposed Pro5 or Lec2 cells to these mutant vectors at an MOI of 105, at 4 °C for 1 h, and determined the quantity of cell surface-bound AAV particles by qPCR of the viral genome (n=3). (c,d) We applied the AAV2R585E mutant GFP vectors to Pro5 or Lec2 cells at an MOI of 106, and determined transduction efficiency 48 h after infection by fluorescent microscopy (c) and flow cytometry (d) (n=3). In the bar graphs, error bars represent s.e.m. This experiment was performed once. Scale bar, 400 μm.
Figure 6
Figure 6. Functional maps of the C-terminal half of the AAV9 capsid amino acids.
(a) A 2D heat map showing correlations between positions of AA mutations and phenotypic changes. Degrees of phenotypic changes caused by AA mutations are categorized into seven groups as indicated to the right. Functionally important amino acids form four clusters (Clusters I–IV) that are partially discontinuous by the presence of the amino acids responsible for the structural integrity shown as grey regions. The following is the orders of the samples in the heatmap (from the top to the bottom): liver (Lv), skeletal muscle, dorsal skin, intestine, brain (B), visceral fat, lung, pancreas, testis, heart (H), kidney and spleen (S) for the tissue samples; Pro5 transduction, Lec2 transduction, Pro5 binding and Lec2 binding for the in vitro samples and 1 min, 10 min, 30 min, 1 h, 4 h, 8 h, 24 h and 72 h time points for the blood samples. No significant phenotypic changes (ns, indicated with yellow) are those showing a greater than fourfold increase or decrease in a PD value with no statistical significance (two-tailed Mann–Whitney U-test, P≥0.05). (b) A 3D map on the full AAV9 capsid atomic model showing topological locations of the functionally important amino acids in Clusters I–IV. A triangle and three pentagons indicate three- and fivefold symmetry axes, respectively. Twofold symmetry axes are in the centre of two adjacent fivefold symmetry axes. The image was generated by PyMOL. (c) A Venn diagram showing correlation between AAV9 capsid amino-acid residues and various AAV9 phenotypes. The AAV9 neutralizing antibody epitope, the amino acids responsible for enhanced liver transduction, and 3 of the 16 amino acids important for postattachment processing, F501, A502 and N515, were identified through the AAV2R585E mutants. All other amino acids and their phenotypes were identified by the AA mutagenesis study of the AAV9 capsid. Owing to the nature of the AA mutagenesis approach, it remains unknown which one of the two amino acids mutated to alanine is responsible for the phenotypes or whether both of the two amino acids are responsible for the phenotypes.

References

    1. Manno C. S. et al. Successful transduction of liver in hemophilia by AAV-Factor IX and limitations imposed by the host immune response. Nat. Med. 12, 342–347 (2006). - PubMed
    1. Nathwani A. C. et al. Adenovirus-associated virus vector-mediated gene transfer in hemophilia B. N. Engl. J. Med. 365, 2357–2365 (2011). - PMC - PubMed
    1. Boutin S. et al. Prevalence of serum IgG and neutralizing factors against adeno-associated virus (AAV) types 1, 2, 5, 6, 8, and 9 in the healthy population: implications for gene therapy using AAV vectors. Hum. Gene Ther. 21, 704–712 (2010). - PubMed
    1. Calcedo R., Vandenberghe L. H., Gao G., Lin J. & Wilson J. M. Worldwide epidemiology of neutralizing antibodies to adeno-associated viruses. J. Infect. Dis. 199, 381–390 (2009). - PMC - PubMed
    1. Asokan A., Schaffer D. V. & Samulski R. J. The AAV vector toolkit: poised at the clinical crossroads. Mol. Ther. 20, 699–708 (2012). - PMC - PubMed

Publication types

MeSH terms

Associated data