. 2014;6(4):456-66.
doi: 10.1159/000356824. Epub 2014 Jan 10.

Type I interferon plays opposing roles in cytotoxicity and interferon-γ production by natural killer and CD8 T cells after influenza A virus infection in mice

Affiliations

Type I interferon plays opposing roles in cytotoxicity and interferon-γ production by natural killer and CD8 T cells after influenza A virus infection in mice

Yojiro Arimori et al. J Innate Immun. 2014.

Abstract

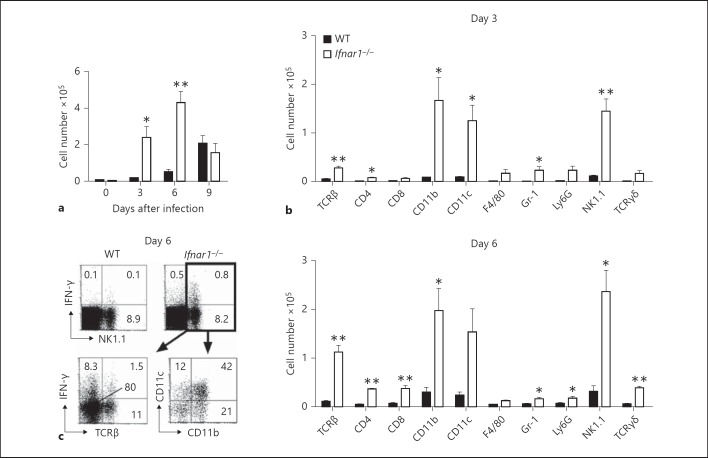
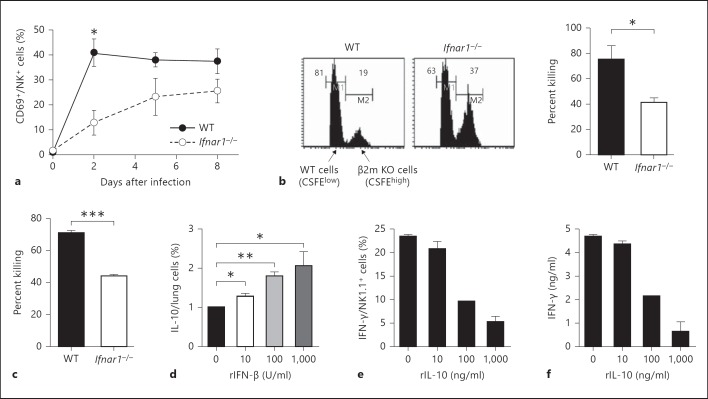
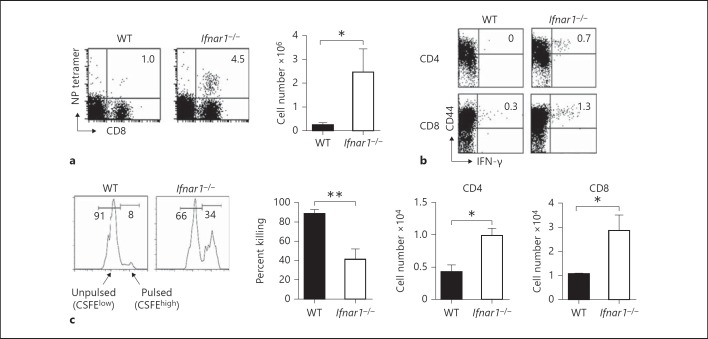
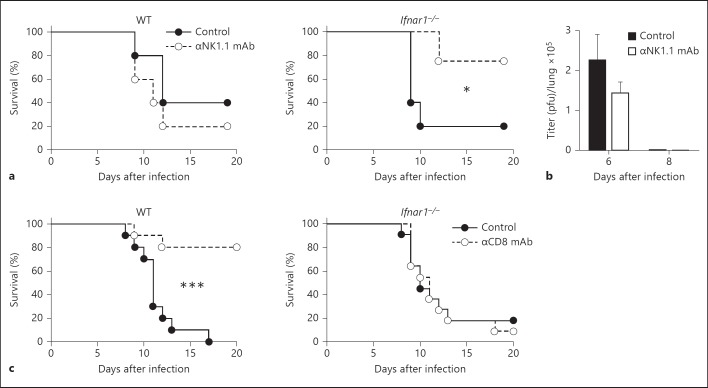
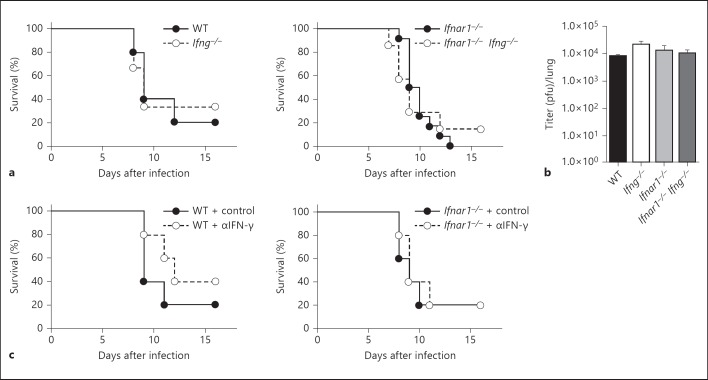
Type I interferons (IFNs) promote natural killer (NK) and CD8(+) T-cell responses, which play a role not only in the resolution of infection but also in the induction of acute lung injury following influenza A virus infection. We show here that IFN-α receptor knock-out (Ifnar1(-/-)) mice exhibited impaired cytotoxic activity as well as an increased ability of NK and CD8(+) T cells to produce IFN-γ after infection with influenza virus A/FM/1/47 (H1N1, a mouse-adapted strain). A deficiency in IFNAR signaling significantly impaired IL-10 production in influenza virus-infected lungs and enhanced IFN-γ production by NK cells, which were suppressed by exogenous IL-10. Depletion of NK cells but not CD8(+) T cells in Ifnar1(-/-) mice improved the survival rate after A/FM/1/47 infection, indicating that NK cells are responsible for acute lung injury in Ifnar1(-/-) mice following influenza A virus infection, although the depletion of IFN-γ did not improve the outcome. Thus, type I IFN signaling plays a role not only in the upregulation of cytotoxicity but also in the downregulation of some effector mechanisms including IFN-γ production by NK and CD8(+) T cells via IL-10 production.


Figures

Fig. 1
Fig. 1
IFN-γ-producing cells in the lungs of Ifnar1−/− mice after infection with influenza virus A/FM/1/47. Lung cells were harvested on days 3, 6 and 9 after infection with 25 pfu of influenza virus A/FM/1/47. The samples were incubated with 10 μg/ml brefeldin A for 4 h at 37°C. Expression of IFN-γ was detected by intracellular staining and analyzed by flow cytometry. Each group consists of 3 mice. The data are representative of at least 3 independent experiments. Error bars represent the mean ± SEM. * p < 0.05; ** p < 0.01. a Total numbers of IFN-γ-producing cells in the lungs of WT and Ifnar1−/− mice after infection. b Numbers of surface marker-positive IFN-γ-producing cells of each surface marker in the lungs of WT and Ifnar1−/− mice on days 3 and 6 after infection. c Percentage of IFN-γ-producing NK1.1+ cells in the lungs of WT and Ifnar1−/− mice (above), and percentage of TCRβ+, CD11b+ and CD11c+ cells in NK1.1+ gated lung cells of Ifnar1−/− mice (below) on day 6 after infection. The numbers indicate the percentage of cells in the corresponding quadrants.
Fig. 2
Fig. 2
Activity of NK cells in Ifnar1−/− mice after infection with influenza virus A/FM/1/47. Each group consists of 3 mice. The data are representative of at least 3 independent experiments. Error bars represent the mean ± SEM. * p < 0.05; ** p < 0.01; *** p < 0.001. a CD69 expression in NK cells (NK1.1+CD3e-) in the lungs of WT and Ifnar1−/− mice was analyzed by flow cytometry after infection with 25 pfu of influenza virus A/FM/1/47. b CFSElow-labeled WT and CFSEhigh-labeled β2m−/− splenocytes were co-injected equally into WT or Ifnar1−/− mice infected with influenza virus A/FM/1/47 6 days earlier. Transferred cells were analyzed in the lungs of recipient mice 24 h after injection (histograms), and percent killing was calculated as shown in Methods (graph). Values in each histogram represent the percentage of CFSElow and CFSEhigh cells. c WT and Ifnar1−/− lung cells were harvested on day 5 after infection with 25 pfu of influenza virus A/FM/1/47. NK1.1+ cells were positively purified to >90% using autoMACS. 1 × 10⁵ NK1.1+ cells were incubated with 1 × 10⁴ CFSE-labeled YAC-1 cells. The number of living (propidium iodide-negative) YAC-1 cells was counted by flow cytometry, and percent killing was calculated as shown in Methods. d 1 × 10⁶ lung cells from WT mice were incubated with the indicated dose of rIFN-β for 24 h and with 10 μg/ml brefeldin A for the last 4 h at 37°C. IL-10-producing cells were detected by intracellular staining and analyzed by flow cytometry. e, f NK1.1+ cells from WT splenocytes were positively purified to >90% using autoMACS. The cells were incubated with 10 ng/ml rIL-12 and the indicated dose of rIL-10 for 24 h and with 10 μg/ml brefeldin A for the last 4 h at 37°C. IFN-γ-producing cells were detected by intracellular staining and analyzed by flow cytometry (d), and IFN-γ in supernatants was detected by ELISA (e).
Fig. 3
Fig. 3
Ag-specific T cells in the lungs of Ifnar1−/− mice after infection with influenza virus A/FM/1/47. Each group consists of 3 mice. The data are representative of at least 3 independent experiments. Error bars represent the mean ± SEM. * p < 0.05; ** p < 0.01. a NP-specific CD8+ T cells on day 6 after infection with 25 pfu of influenza virus A/FM/1/47. The lung cells were stained with αCD8 mAb and NP-major histocompatibility complex class I tetramer. Samples were analyzed by flow cytometry. Dot plots are shown after lymphocyte gating. The numbers indicate the percentage of NP tetramer-positive cells in CD8+ cells. Absolute cell numbers were counted by multiplying the percentage of tetramer-positive cells by the absolute number of lung cells. b IFN-γ-producing T cells on day 6 after infection with 25 pfu of influenza virus A/FM/1/47. The lung cells were incubated with 10 μg/ml NP-derived ASNENMDTM peptide for CD8+ cells or 10 μg/ml NP-derived ARSALILRGSVAHK peptide for CD4+ cells and with 10 μg/ml brefeldin A for 4 h at 37°C, and expression of IFN-γ was detected by intracellular staining. Dot plots are shown after CD4+ (above) and CD8+ (below) cell gating. The numbers indicate the percentage of cells in the corresponding quadrants. The absolute numbers of IFN-γ-producing CD4+ and CD8+ cells were counted by multiplying the percentage by the absolute number of lung cells. c In vivo cytotoxic activity of NP-specific CD8+ T cells on day 6 after infection with 25 pfu of influenza virus A/FM/1/47. Histograms are gated on Ly5.1+ cells in the lung 12 h after co-injection with equal numbers of CFSEhigh-labeled NP peptide-pulsed splenocytes and CFSElow-labeled unpulsed splenocytes into mice infected with influenza virus A/FM/1/47 6 days earlier. The percentage of specific lysis was calculated as shown in Methods.
Fig. 4
Fig. 4
Susceptibility of NK1.1+ and CD8+ cell-depleted Ifnar1−/− mice after infection with influenza virus A/FM/1/47. Each group consists of 10-11 mice. The data are representative of at least two independent experiments. Error bars represent the mean ± SEM. * p < 0.05; *** p < 0.001. a, b 50 μg anti-(α)NK1.1 mAb (clone PK136) or isotype-matched control mAb was intraperitoneally injected into the respective Ifnar1−/− mice on day 5 after infection with 25 pfu of influenza virus A/FM/1/47. a Survival rates of αNK1.1 mAb-treated WT and Ifnar1−/− mice. Each group consists of 5 mice. b Viral titers in the lungs on days 6 and 8 after infection. Each group consists of 3 mice. c Survival rates of αCD8 mAb (clone 2.43)-treated WT and Ifnar1−/− mice after infection with influenza virus A/FM/1/47. 200 μg αCD8 mAb or isotype-matched control mAb was intraperitoneally injected into WT mice infected with 50 pfu influenza virus A/FM/1/47 and into Ifnar1−/− mice infected with 25 pfu influenza virus A/FM/1/47 on days 1, 4 and 7 after infection.
Fig. 5
Fig. 5
Susceptibility of IFN-γ-depleted Ifnar1−/− mice after infection with influenza virus A/FM/1/47. The data are representative of at least two independent experiments. Error bars represent the mean ± SEM. a Survival rates of WT, Ifng−/−, Ifnar1-/- and Ifnar1−/−Ifng−/− mice after infection with 25 pfu of influenza virus A/FM/1/47. Each group consists of 5-12 mice. b Viral titers of WT, Ifng−/−,Ifnar1−/− and Ifnar1−/−Ifng−/− mice on day 6 after infection with 25 pfu of influenza virus A/FM/1/47. Each group consists of 3 mice. c Survival rates of αIFN-γ mAb (R4-6A2)-treated WT and Ifnar1−/− mice after infection with influenza virus A/FM/1/47. 500 μg αIFN-γ mAb or isotype-matched control mAb was intraperitoneally injected into WT and Ifnar1−/− mice infected with 25 pfu influenza virus A/FM/1/47, respectively, on days 5-8 after infection. Each group consists of 5 mice.

Similar articles

Cited by

References

    1. Nakamura R, Maeda N, Shibata K, Yamada H, Kase T, Yoshikai Y. Interleukin-15 is critical in the pathogenesis of influenza A virus-induced acute lung injury. J Virol. 2010;84:5574–5582. - PMC - PubMed
    1. Abdul-Careem MF, Mian MF, Yue G, Gillgrass A, Chenoweth MJ, Barra NG, Chew MV, Chan T, Al-Garawi AA, Jordana M, Ashkar AA. Critical role of natural killer cells in lung immunopathology during influenza infection in mice. J Infect Dis. 2012;206:167–177. - PubMed
    1. Lettau M, Schmidt H, Kabelitz D, Janssen O. Secretory lysosomes and their cargo in T and NK cells. Immunol Lett. 2007;108:10–19. - PubMed
    1. Billiau A, Matthys P. Interferon-gamma: a historical perspective. Cytokine Growth Factor Rev. 2009;20:97–113. - PubMed
    1. Randall RE, Goodbourn S. Interferons and viruses: an interplay between induction, signalling, antiviral responses and virus countermeasures. J Gen Virol. 2008;89:1–47. - PubMed

Publication types

MeSH terms