. 2014 Apr;85(4):586-97.
doi: 10.1124/mol.113.088443. Epub 2014 Jan 16.

Gα12 structural determinants of Hsp90 interaction are necessary for serum response element-mediated transcriptional activation

Affiliations

Gα12 structural determinants of Hsp90 interaction are necessary for serum response element-mediated transcriptional activation

Ellyn R Montgomery et al. Mol Pharmacol. 2014 Apr.

Abstract

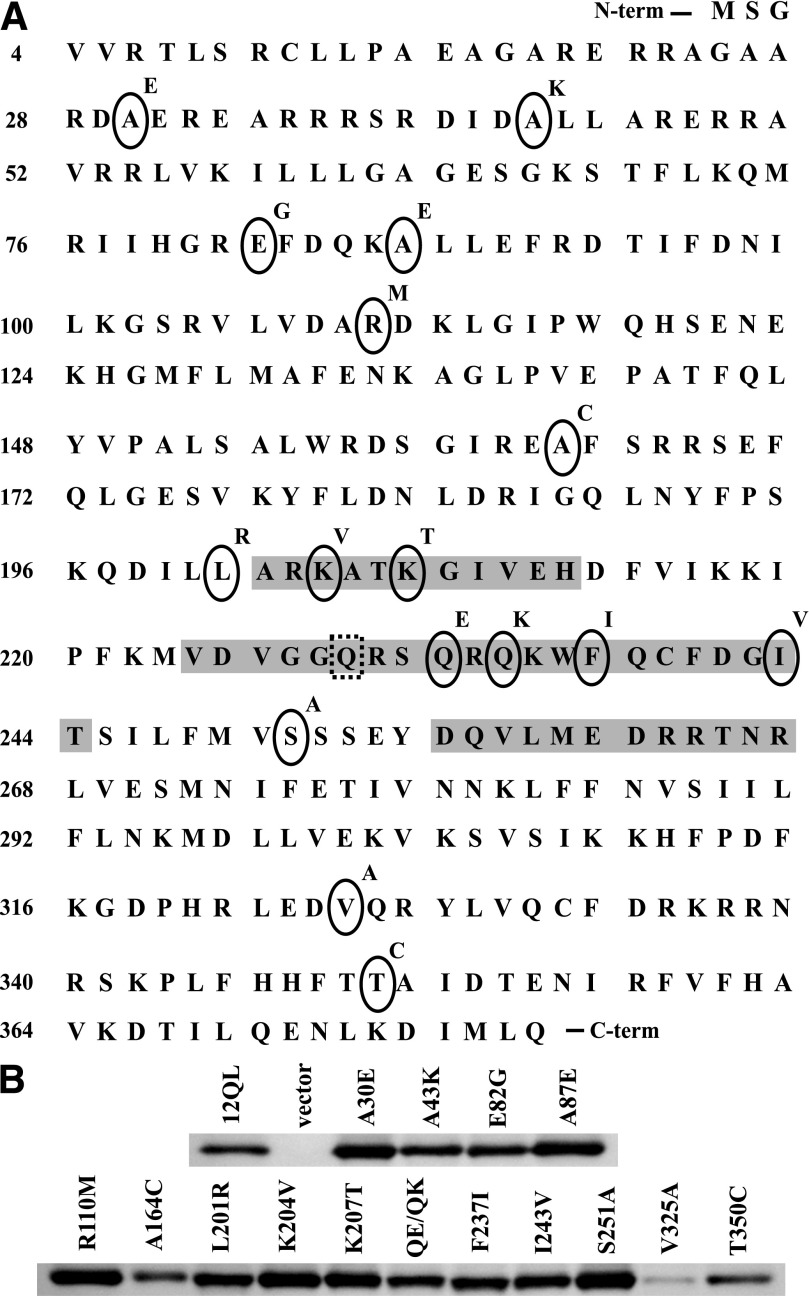
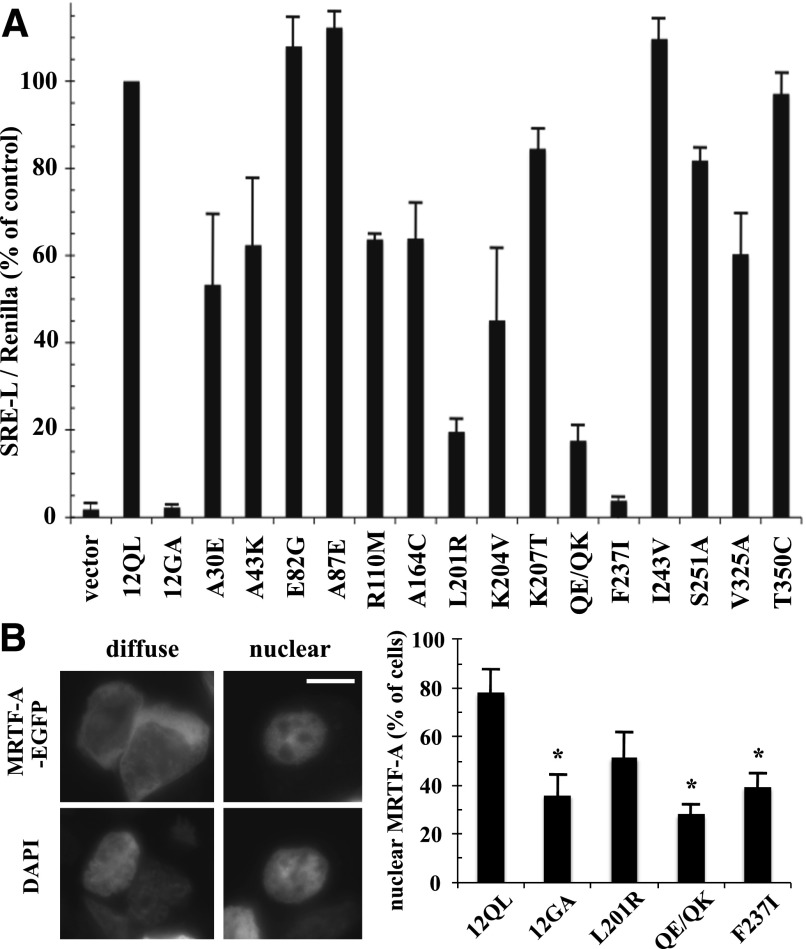
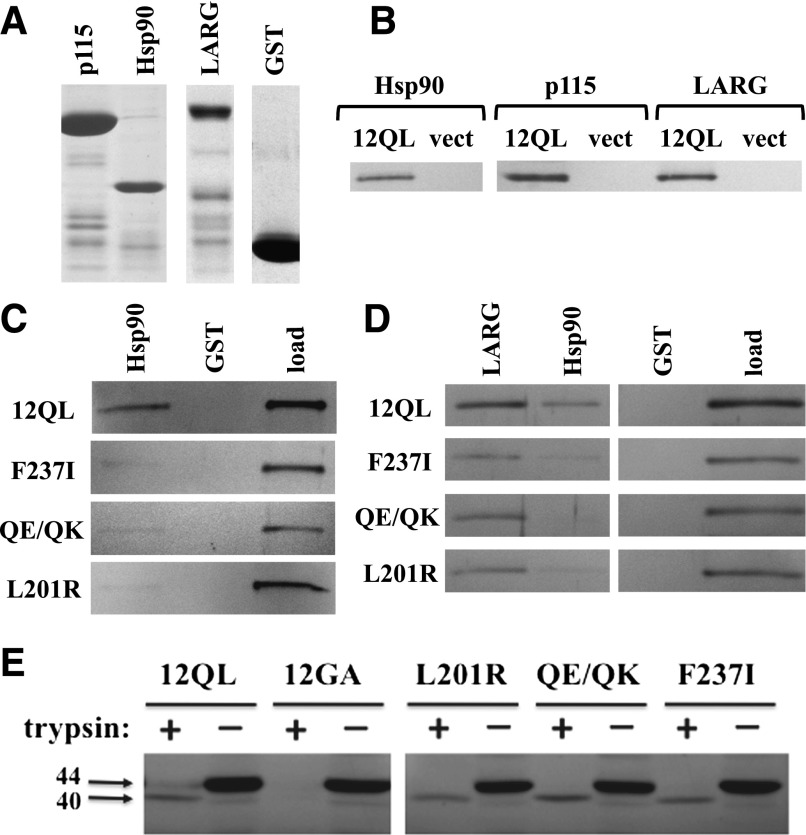
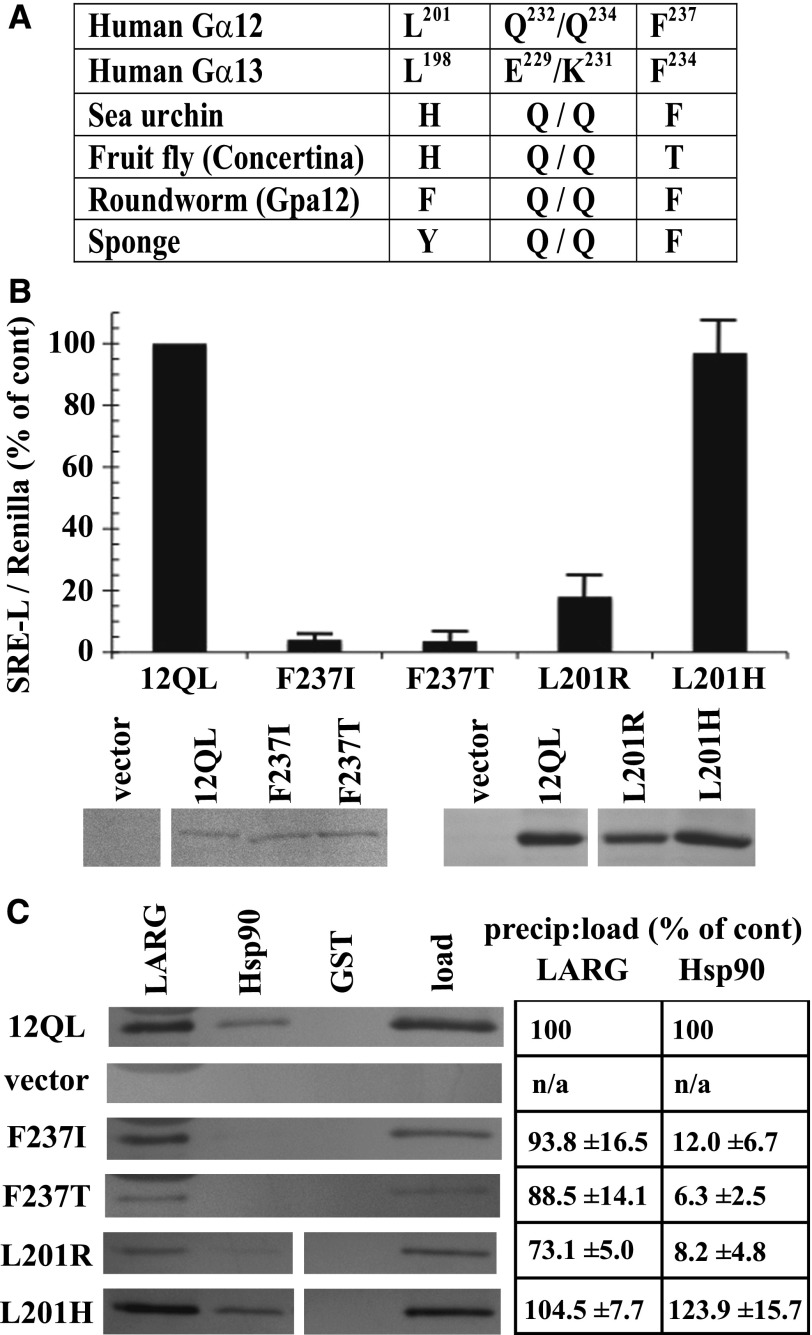
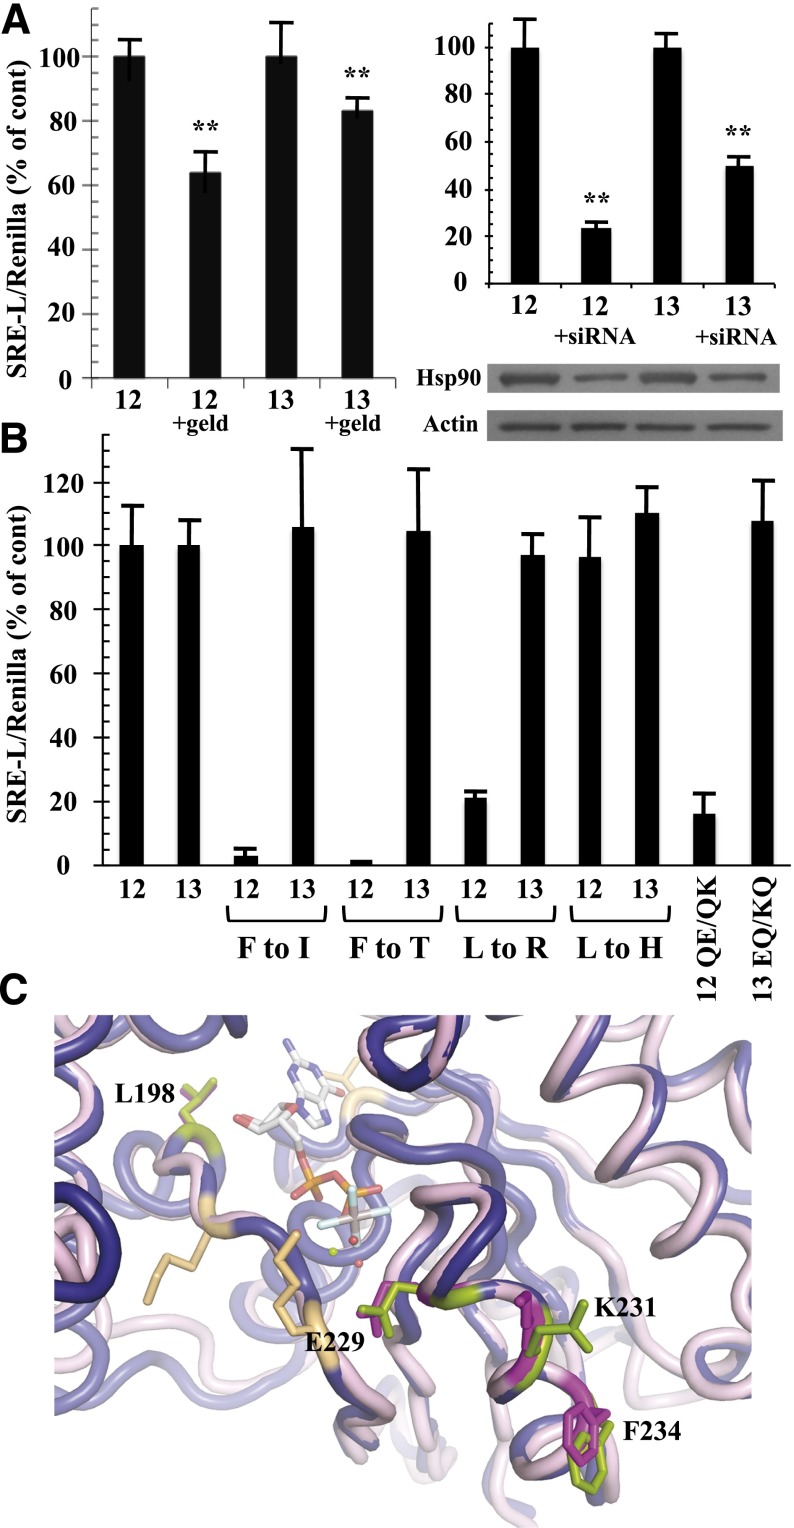
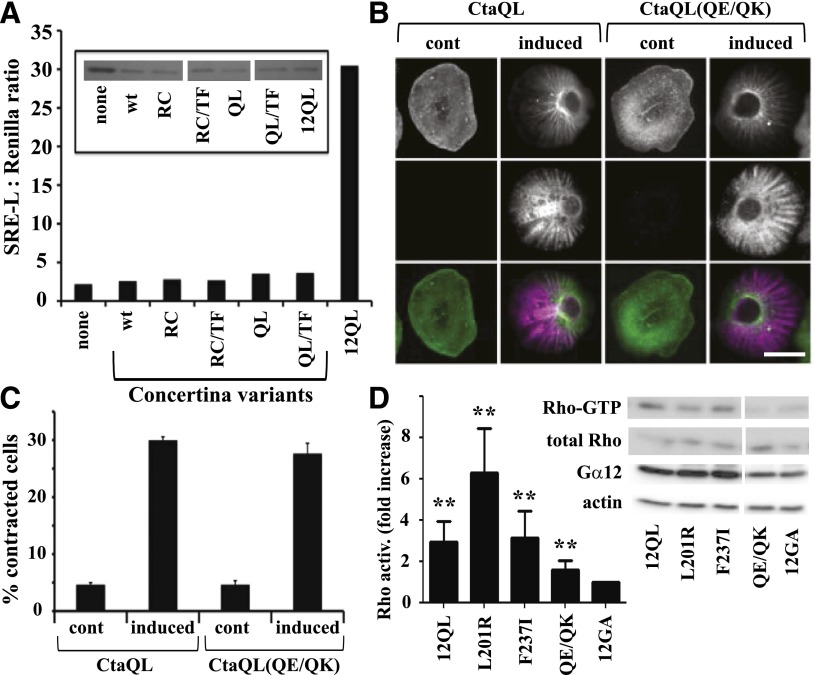
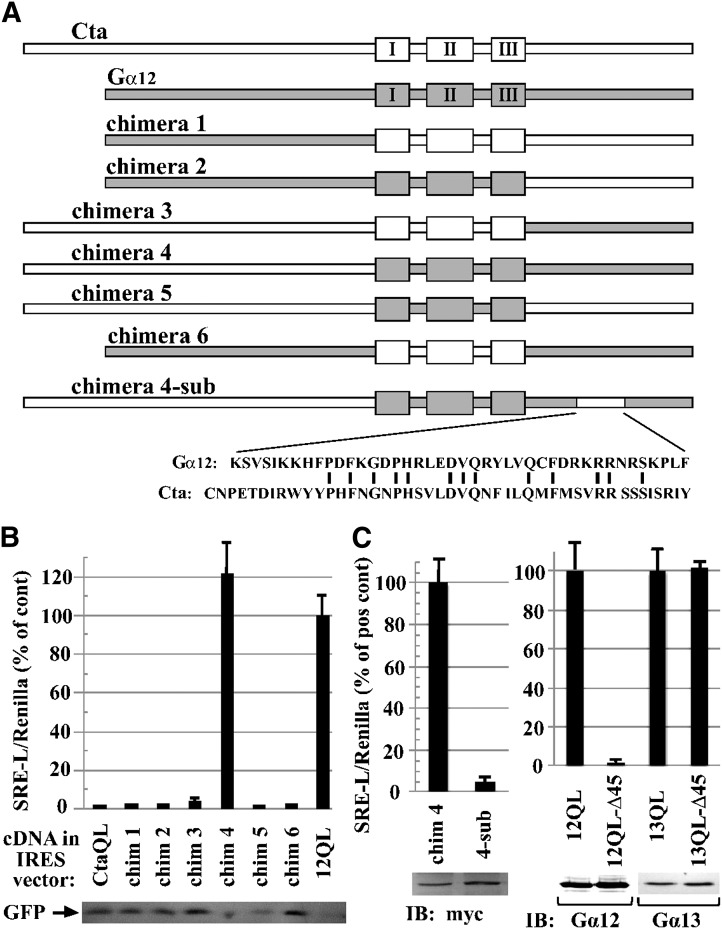
The G12/13 class of heterotrimeric G proteins, comprising the α-subunits Gα12 and Gα13, regulates multiple aspects of cellular behavior, including proliferation and cytoskeletal rearrangements. Although guanine nucleotide exchange factors for the monomeric G protein Rho (RhoGEFs) are well characterized as effectors of this G protein class, a variety of other downstream targets has been reported. To identify Gα12 determinants that mediate specific protein interactions, we used a structural and evolutionary comparison between the G12/13, Gs, Gi, and Gq classes to identify "class-distinctive" residues in Gα12 and Gα13. Mutation of these residues in Gα12 to their deduced ancestral forms revealed a subset necessary for activation of serum response element (SRE)-mediated transcription, a G12/13-stimulated pathway implicated in cell proliferative signaling. Unexpectedly, this subset of Gα12 mutants showed impaired binding to heat-shock protein 90 (Hsp90) while retaining binding to RhoGEFs. Corresponding mutants of Gα13 exhibited robust SRE activation, suggesting a Gα12-specific mechanism, and inhibition of Hsp90 by geldanamycin or small interfering RNA-mediated lowering of Hsp90 levels resulted in greater downregulation of Gα12 than Gα13 signaling in SRE activation experiments. Furthermore, the Drosophila G12/13 homolog Concertina was unable to signal to SRE in mammalian cells, and Gα12:Concertina chimeras revealed Gα12-specific determinants of SRE activation within the switch regions and a C-terminal region. These findings identify Gα12 determinants of SRE activation, implicate Gα12:Hsp90 interaction in this signaling mechanism, and illuminate structural features that arose during evolution of Gα12 and Gα13 to allow bifurcated mechanisms of signaling to a common cell proliferative pathway.


Figures

Fig. 1.
Fig. 1.
Construction, expression, and solubilization of class-distinctive Gα12 mutants. (A) Amino acid sequence of Gα12 is shown. Each class-distinctive residue, indicated by an oval, was mutated to its nonclass-distinctive form (above right of ovals) in myc-tagged, constitutively active Gα12. Shaded areas indicate the switch I, II, and III regions, and the dashed box indicates the site of the activating Q229L mutation. (B) The indicated mutant constructs were expressed in HEK293 cells, from which detergent-soluble extracts were subjected to immunoblot analysis as described in Materials and Methods. All mutants were single amino acid substitutions except the double-mutant Q232E/Q234K (QE/QK). Extracts from cells transfected with the Q229L variant of myc-tagged Gα12 (12QL) and empty pcDNA3.1 (vector) were analyzed in parallel.
Fig. 2.
Fig. 2.
Identification of class-distinctive mutants of Gα12 impaired in SRE-mediated transcriptional activation. (A) HEK293 cells were transfected with the plasmids SRE-luciferase (0.2 µg) and pRL-TK (0.02 µg) plus 1 µg of plasmid encoding each indicated class-distinctive mutant of myc-Gα12QL (x-axis). Firefly luciferase activity values were normalized for Renilla luciferase activity values and presented as a percent of positive control myc-Gα12QL (12QL) within the same experiment. Empty pcDNA3.1 (vector) and Gα12 harboring the inactivating G228A mutation (12GA) were examined as negative controls. Data presented are the mean ± range of two independent experiments per myc-Gα12QL variant, with three or more experiments performed for mutants that showed greater than 50% impairment of SRE stimulation. (B) HEK293 cells grown in six-well plates were cotransfected with 1.0 µg of EGFP-MRTF-A plasmid and 1.0 µg of each indicated Gα12 construct. Cells (50 per transfection) were scored for either diffuse or exclusively nuclear localization of the EGFP signal, using 4′,6-diamidino-2-phenylindole (DAPI) costaining to define the boundaries of the nucleus. Examples are shown in the left panels (two cells exhibiting diffuse EGFP-MRTF-A staining) and right panels (single cell exhibiting nuclear staining of EGFP-MRTF-A). Scale bar is 10 µm. The column graph shows results compiled from three independent trials, presented as mean ± S.E.M. Significance of the difference in mutant values compared with positive control (12QL) was determined by Student’s t test (*P < 0.05).
Fig. 3.
Fig. 3.
Effector binding and conformational activation of SRE-uncoupled class-distinctive Gα12 mutants. (A) GST fusions of the N-terminal 252 amino acids of p115RhoGEF (p115), the C-terminal 107 residues of cytoplasmic Hsp90, and the region spanning Leu320 to Arg606 of LARG were analyzed by SDS-PAGE and Coomassie blue staining. Unmodified GST was analyzed in parallel. (B) Coprecipitation experiments using these GST fusion proteins were performed on detergent extracts from HEK293 cells expressing myc-tagged, constitutively active Gα12 (12QL) or empty pcDNA3.1 (vect). (C) Coprecipitations of indicated Gα12 mutants by immobilized Hsp90 are shown. For each panel, the left and center lanes harbor samples in which Sepharose-bound GST-Hsp90 or GST (indicated at top) were used to precipitate fractions from HEK293 extracts harboring myc-Gα12QL (12QL) or the mutants indicated at left. The right lane of each panel (load) harbors 5% of the HEK293 extract set aside before coprecipitation, and band intensities at ∼44 kDa were quantified and used to normalize the coprecipitated bands for Gα12 variants indicated here, as well as others (Table 1). A representative of three independent experiments is shown. (D) Coprecipitation of myc-Gα12QL and its indicated mutants by multiple effectors are shown. The indicated GST fusions of LARG and Hsp90, plus GST with no adduct (GST) are indicated, along with the load for each sample. Data shown are a representative of three independent experiments. (E) Trypsin protection assays were performed on the indicated class-distinctive mutants, plus constitutively activated (12QL) and inactivated (12GA) myc-Gα12. HEK293 cells grown in 10-cm plates were transfected with 10 µg of plasmid DNA, and after 40 hours, cell lysates were subjected to tryptic proteolysis as described in Materials and Methods. Molecular weights are indicated at left in kilodaltons. Results shown are one representative of three independent experiments.
Fig. 4.
Fig. 4.
Ancestral and Concertina-specific substitutions of Gα12 residues involved in SRE activation and Hsp90 binding. (A) An evolutionary profile of selected class-distinctive G12/13 residues is shown, with position in the primary amino acid sequence shown in superscript for Gα12 and Gα13 (Temple et al., 2010). (B) The indicated substitutions in myc-Gα12QL (x-axis) were examined for SRE-luciferase activation as described in Materials and Methods, and results are presented as a percent of positive control myc-Gα12QL (12QL). Panels beneath this graph show expression levels of the indicated mutants, matched with one of several different samples of myc-Gα12QL, as determined by immunoblot analysis of HEK293 cell lysates using anti-Gα12 antibody. (C) Effects of the indicated substitutions within Gα12 on coprecipitation by immobilized LARG and Hsp90 are shown, with lysates from cells transfected with myc-Gα12QL and empty vector analyzed in parallel. Panel at left shows blot images representative of three independent experiments, and panel at right shows precipitate-to-load ratios as a percent of the same ratio determined for myc-Gα12QL (set at 100%). Quantitative data are presented as mean ± S.E.M.
Fig. 5.
Fig. 5.
Differential effects of Hsp90 inhibition and SRE-uncoupling mutations in Gα12 and Gα13. (A) Effects of geldanamycin (left graph) and Hsp90-specific siRNA (right graph) on Gα12- and Gα13-mediated SRE activation are shown. HEK293 cells grown in 12-well plates were transfected with 0.2 µg of SRE-luciferase and 0.02 µg of pRL-TK, plus 1 µg of a constitutively active variant of either Gα12 (12) or Gα13 (13). For the left graph, cells were serum-starved for 24 hours, and then 1 µg/ml geldanamycin (geld) was added for 6 hours. For the right graph, siRNA specific to cytoplasmic Hsp90-α was cotransfected with the above plasmids as described in Materials and Methods. Luminometry assays were performed as described in Fig. 2, and each G12/13 control sample (geldanamycin absent, or siRNA absent) was set at 100%. For siRNA experiments, cell lysates were subjected to immunoblot analysis, using antibodies specific to Hsp90-α (Santa Cruz Biotechnology) and actin (clone C4; Millipore), and representative blots are shown. Results presented in each graph are the mean of three or more independent experiments, with error bars representing ± S.E.M. Effects of geldanamycin (left graph) and siRNA (right graph) were analyzed by one-way analysis of variance for significant difference in disruption of the Gα12 response compared with disruption of the Gα13 response (**P < 0.001). (B) HEK293 cells were transfected with SRE-luciferase and pRL-TK as described above plus 1 µg of each Gα plasmid. All constructs encoded the constitutively active form of the Gα protein (12 or 13), and substitutions of class-distinctive residues are indicated below the x-axis (e.g., F to I). Additional mutants were tested: QE/QK, Q232E/Q234K substitutions in constitutively active Gα12; EQ/KQ, E229Q/K231Q substitutions in constitutively active Gα13. Data are presented as mean ± range and are the result of three or more independent experiments per construct. (C) Rendering of Gα12 (PDB ID 1ZCA; Kreutz et al., 2006) is shown in blue cartoon and Gα13 (PDB ID 3AB3; Hajicek et al., 2011) in light pink cartoon with the bound nucleotide displayed as sticks and colored by atom type with carbons in white. For Gα13, side chains of Leu198, Glu229, Lys231, and Phe234 are displayed as magenta sticks and numbered. Corresponding Gα12 side chains of Leu201, Gln232, Gln234, and Phe237 are shown as green sticks and are not numbered in this diagram. Figure was rendered in The PyMOL Molecular Graphics System, Version 1.5.0.1 Schrödinger, LLC.
Fig. 6.
Fig. 6.
Differential effects of Gα12 and Concertina on SRE-mediated transcription and cytoskeletal rearrangements. (A) Effect of Concertina variants on SRE-mediated transcriptional activation. HEK293 cells were transfected with a GFP-encoding IRES vector harboring myc-Gα12QL (12QL), no additional coding sequence (none), or Concertina variants with the following designations: wt, wild-type; RC, R277C; QL, Q303L; TF, T311F. For each sample, luciferase assays were performed (graph) and GFP levels were determined by immunoblot analysis (inset) to allow indirect measure of expression of Concertina variants. Data shown are a representative of three independent experiments. (B) Effect of Concertina and its Q306E/Q308K variant on cell contraction. S2 cells expressing inducible myc-tagged, constitutively active Concertina (CtaQL) or the same protein harboring Q306E/Q308K substitutions (QE/QK) were induced with 50 µM copper sulfate and 24 hours later scored for contractility as described in Materials and Methods. Cells were stained with phalloidin (top row) and anti-myc antibody (middle row), and images were merged (bottom row). Scale bar is 10 µm, and images are from a representative of three independent experiments. (C) Compiled quantitative data from experiments described in (B) are shown, with bars indicating S.E.M. (D) HEK293 cells were assayed for basal RhoA activity 36–42 hours after transfection with constitutively active (12QL) or inactive (12GA) myc-tagged Gα12, or the indicated mutants of myc-Gα12QL. Blots were developed with SuperSignal West Pico chemiluminescent substrate (Pierce, Rockford, IL) and Kodak Biomax film, and representative blots of active RhoA (Rho-GTP) precipitated by GST-RBD versus total RhoA in cell lysates are shown, along with blots of Gα12 and actin in the same experiment. RhoA activity is the ratio of active RhoA to total RhoA signal, with densitometry (NIH ImageJ software) used to quantify results from seven independent experiments. Results are graphed as the -fold increase over cells expressing inactive, GDP-bound Gα12 (12GA). Graphical data represent mean ± S.E.M.; **P < 0.001 as calculated through analysis of variance using the Kruskal–Wallis test.
Fig. 7.
Fig. 7.
Identification of additional determinants of SRE activation in Gα12. (A) Schematic of Gα12/Concertina chimeras is shown. Chimeras were engineered as described in Materials and Methods, with the switch regions demarcated by the N-terminal boundary of the switch I region (Cys276 of Concertina, Ala202 of Gα12) and the C-terminal boundary of the switch III region (Arg342 of Concertina, Arg267 of Gα12). An activating Gln-to-Leu mutation was engineered in the switch II region of each construct. For chimera 4-sub, the indicated 45-residue Concertina region was introduced to chimera 4 in place of the indicated 42-residue Gα12 region. (B) Stimulation of SRE-mediated transcription in HEK293 cells (see Materials and Methods) by Gα12/Concertina chimeras 1–6 is shown. SRE activation is displayed as percent of the positive control myc-Gα12QL (12QL) in the same experiment. Values are mean ± range for three or more independent trials per chimera, with only the mean displayed for samples with values ≤3% of positive control. Immunoblot levels of GFP, coexpressed in the IRES vector harboring each chimera, are shown (lower panel). (C) Effects of C-terminal Concertina substitutions within chimera 4 and G12/13 proteins are shown. N-terminally myc-tagged chimera 4 and chimera 4-sub were tested for SRE activation, and mean ± range is shown for three independent experiments. Lysates were examined by immunoblot (IB) analysis using anti-myc antibody; results from a representative experiment are shown. SRE activation assays for mutants harboring the aforementioned 45-residue Concertina region at the C terminus of myc-Gα12QL (12QL-Δ45) and Gα13QL (13QL-Δ45) are presented in comparison with positive controls myc-Gα12QL and Gα13QL, respectively, and results are shown as mean ± range for three independent experiments. Comparative expression levels of the two Gα12 constructs, and the two Gα13 constructs, were determined by immunoblot analysis using anti-Gα12 (Santa Cruz Biotechnology) and anti-Gα13 (EMD Millipore) antibodies, and images from a representative experiment are shown.

Similar articles

Cited by

References

    1. Adarichev VA, Vaiskunaite R, Niu J, Balyasnikova IV, Voyno-Yasenetskaya TA. (2003) Gα13-mediated transformation and apoptosis are permissively dependent on basal ERK activity. Am J Physiol Cell Physiol 285:C922–C934 - PubMed
    1. Barrett K, Leptin M, Settleman J. (1997) The Rho GTPase and a putative RhoGEF mediate a signaling pathway for the cell shape changes in Drosophila gastrulation. Cell 91:905–915 - PubMed
    1. Bhattacharyya R, Banerjee J, Khalili K, Wedegaertner PB. (2009) Differences in Galpha12- and Galpha13-mediated plasma membrane recruitment of p115-RhoGEF. Cell Signal 21:996–1006 - PMC - PubMed
    1. Bhattacharyya R, Wedegaertner PB. (2000) Galpha 13 requires palmitoylation for plasma membrane localization, Rho-dependent signaling, and promotion of p115-RhoGEF membrane binding. J Biol Chem 275:14992–14999 - PubMed
    1. Cabrera-Vera TM, Vanhauwe J, Thomas TO, Medkova M, Preininger A, Mazzoni MR, Hamm HE. (2003) Insights into G protein structure, function, and regulation. Endocr Rev 24:765–781 - PubMed

Publication types

Substances

LinkOut - more resources