. 2014 Feb;4(2):175-185.
doi: 10.1158/2159-8290.CD-13-0285. Epub 2014 Jan 19.

Tolerance of whole-genome doubling propagates chromosomal instability and accelerates cancer genome evolution

Affiliations

Tolerance of whole-genome doubling propagates chromosomal instability and accelerates cancer genome evolution

Sally M Dewhurst et al. Cancer Discov. 2014 Feb.

Abstract

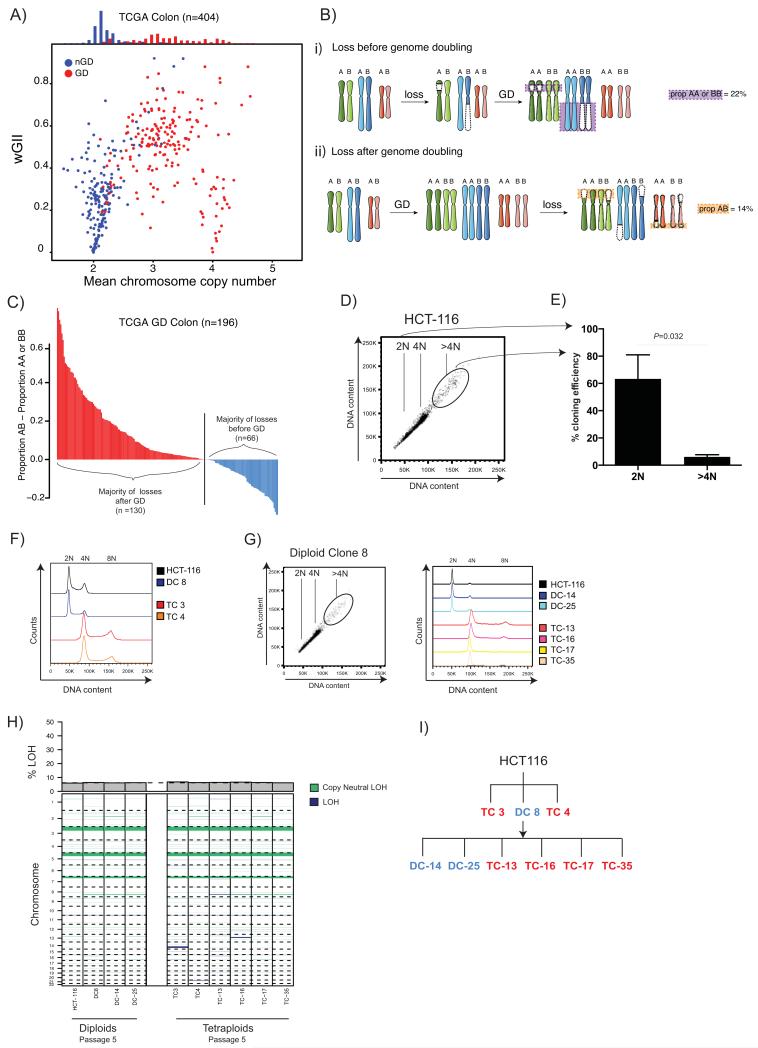
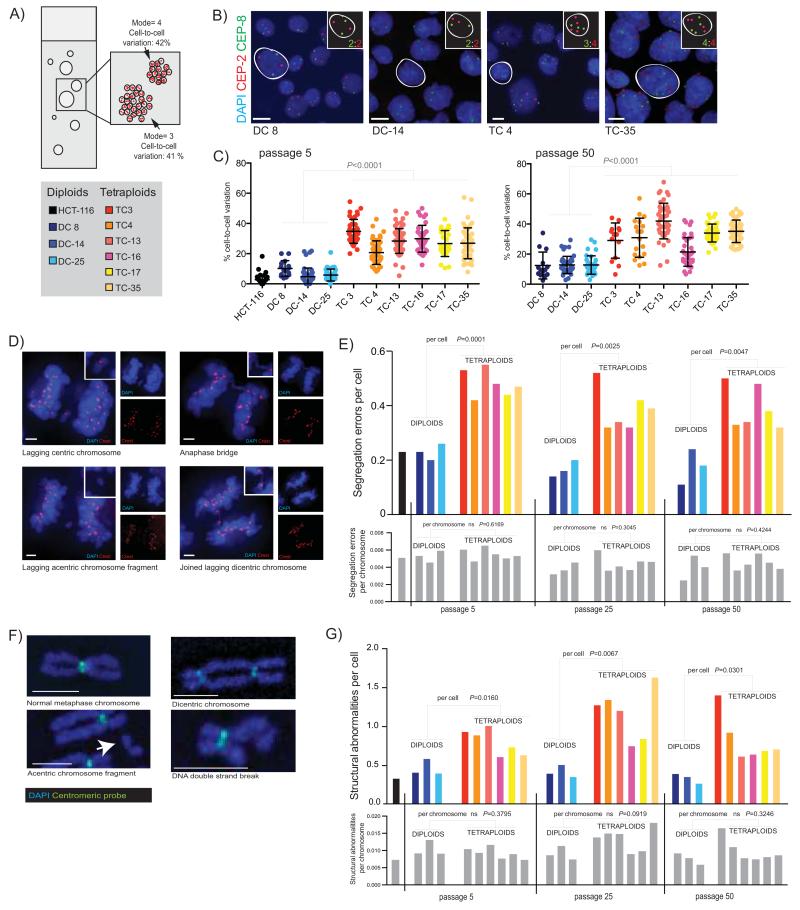
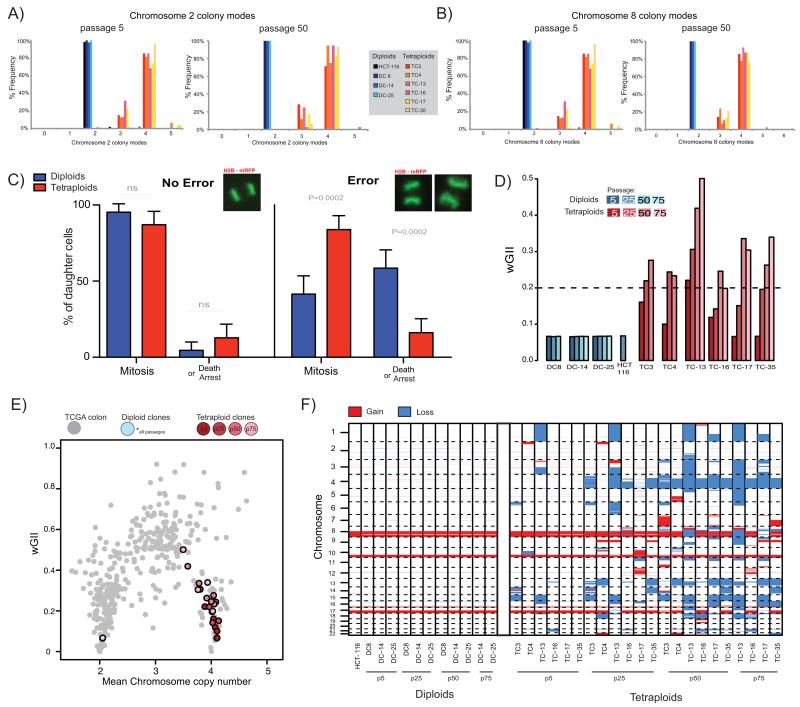
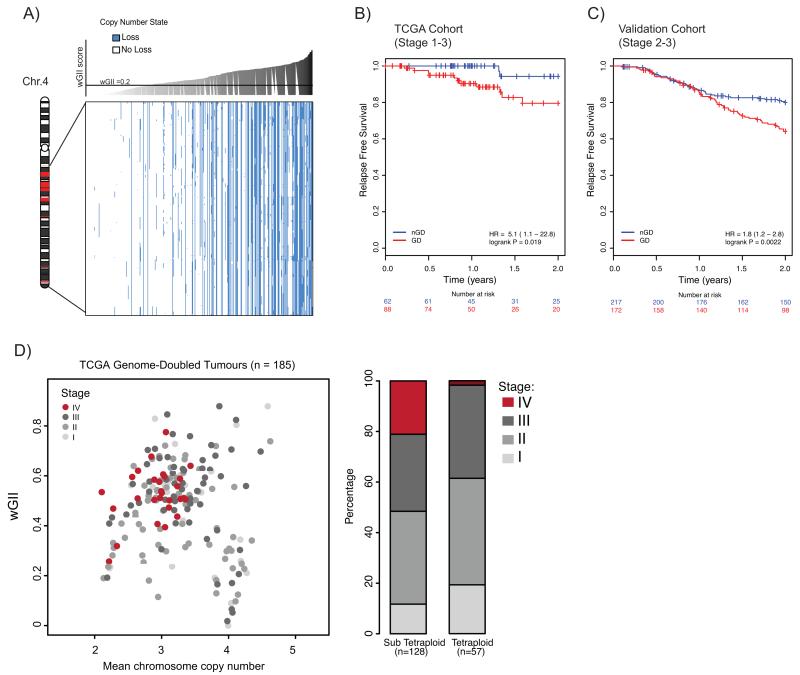
The contribution of whole-genome doubling to chromosomal instability (CIN) and tumor evolution is unclear. We use long-term culture of isogenic tetraploid cells from a stable diploid colon cancer progenitor to investigate how a genome-doubling event affects genome stability over time. Rare cells that survive genome doubling demonstrate increased tolerance to chromosome aberrations. Tetraploid cells do not exhibit increased frequencies of structural or numerical CIN per chromosome. However, the tolerant phenotype in tetraploid cells, coupled with a doubling of chromosome aberrations per cell, allows chromosome abnormalities to evolve specifically in tetraploids, recapitulating chromosomal changes in genomically complex colorectal tumors. Finally, a genome-doubling event is independently predictive of poor relapse-free survival in early-stage disease in two independent cohorts in multivariate analyses [discovery data: hazard ratio (HR), 4.70, 95% confidence interval (CI), 1.04-21.37; validation data: HR, 1.59, 95% CI, 1.05-2.42]. These data highlight an important role for the tolerance of genome doubling in driving cancer genome evolution.

Significance: Our work sheds light on the importance of whole-genome–doubling events in colorectal cancer evolution. We show that tetraploid cells undergo rapid genomic changes and recapitulate the genetic alterations seen in chromosomally unstable tumors. Furthermore, we demonstrate that a genome-doubling event is prognostic of poor relapse-free survival in this disease type.


Figures

Figure 1
Figure 1
A) Relationship between weighted mean chromosome copy number and wGII. Each circle represents one TCGA CRC tumour sample. Red depicts genome-doubled (GD) samples; blue non-genome-doubled (nGD) samples (see Methods). A histogram of weighted mean chromosome copy number for GD (red) and nGD (blue) is shown above. B)i) Copy number losses that occur on the background of a diploid genome prior to genome doubling will result in LOH, whereby one of the parental alleles is lost. In tumours that harboured chromosomal instability prior to genome doubling the majority of losses will be unbalanced, involving LOH. Unbalanced losses to two copies (AA or BB) are depicted with a purple box with purple dotted lines. ii) In tumours where genome doubling was an early event, prior to the onset of chromosomal instability, the majority of losses to two copies will be balanced without LOH. Balanced losses to two copies (AB) are depicted with an orange box with orange dotted lines around them. C) Timing of genome doubling estimated using copy number and LOH profiles. Each bar represents one genome-doubled tumour and its height corresponds to the proportion of AB – proportion AA or BB copy number states. Tumour genomes where the majority of losses to two copies are likely to have occurred after genome doubling are shown in red (n =130; proportion AB > proportion AA or BB), whereas those where the majority of losses are likely to have occurred before doubling are shown in blue (n=66; proportion AB < proportion AA or BB). D) Flow cytometry shows a >4N population in the MIN colon cancer cell line HCT-116. 2N, 4N and <4N populations are indicated on the flow cytometry plot. E) Cloning efficiency of 2N and >4N cells is shown with mean and standard error of mean (3 experiments). Tetraploid cloning efficiency was significantly lower than diploid cloning efficiency (P=0.0322, Student’s t-test). Diploid cloning efficiency was assessed using CellTiter-Blue (CTB) reagent (colonies were identified as wells with CTB value >1.5x mean average of blank wells) and the Poisson-corrected cloning efficiency was calculated (see Methods). Tetraploid cloning efficiency was calculated by verifying the percentage of surviving tetraploid clones using flow cytometry (flow cytometry data not shown). F) After single-cell sorting, DNA content was assessed by flow cytometry with Hoescht staining. Two tetraploid clones (TC 3 and TC 4, at passage 3), one diploid clone (DC 8) and HCT-116 are shown. G) Flow cytometry of the diploid clone DC 8 also shows a small >4N sub-population. Two further diploid clones (DC-14 and DC-25) and four tetraploid clone (TC-13, TC-16, TC-17 and TC-35) were isolated from DC 8, and their DNA content as assessed by flow cytometry with Hoescht staining is shown (passage 3). H) LOH states of early (passage 5) diploid and tetraploid clones analysed by SNP6.0. Dark-blue LOH events in tetraploid clones are likely to have occurred prior to genome doubling. A barplot depicting the proportion of the genome displaying LOH is shown above, the black dotted line depicts the mean proportion LOH in diploids. The majority of LOH events are present in both diploid and tetraploid clones. I) A family tree depicting all diploid and tetraploid clones used in this study. Tetraploid clones are shown in red; diploid clones in blue.
Figure 2
Figure 2
A) Diagram of a clonal FISH slide, showing the two measures of chromosome number deviation that can be scored; cell-to-cell variation in chromosome number is the percentage of cells that deviate from the modal chromosome number of each individual colony. Colony-to-colony variation reflects differences in the modal chromosome copy number between colonies. B) Example images of colonies from four clones with chromosome 2 (CEP2) shown in red, and chromosome 8 (CEP8) in green. Individual cells have been highlighted, and their copy number state for these two chromosomes is shown in the inset. Scale bar (in white) = approx.10μm. C) Cell-to-cell variation in chromosome number. The average percentage deviation of two chromosomes, chromosome 2 and 8, is shown for all clones at both passage 5 and passage 50 (clones all scored using an Ariol automated microscope system, except DC 8, TC 3 and TC 4 at passage 50 which were scored using a DeltaVision microscope). Passage numbers shown throughout are correct to within 4 passages. Colonies with <10 cells were excluded from analysis. Each point represents one colony. Median number of cells: passage 5= 2479, passage 50= 2105. D) Chromosome segregation errors in anaphase were visualized by immunofluorescence. Representative single z-stack images show types of segregation errors that were scored. Blue=DAPI, Red=Crest. Side panels show each channel individually, and inset shows a close-up of the segregation error. Scale bars (in white) = approx. 3μm. E) Chromosome segregation errors on a per cell and per chromosome basis. Fifty anaphases were scored for each cell line; only data from bipolar anaphases is shown. On a per cell basis are shown on top graph (coloured bars represent individual clones, see key above). P values refer to comparisons between diploids and tetraploids at each passage (Student’s T-test). On a per chromosome basis (lower graph, all grey bars, representing the same clones as in immediately above graph) there is no significant difference in segregation errors per chromosome: P values are indicated above bars. F) Representative images of normal and abnormal metaphase chromosomes are shown, stained with DAPI and probed with an all-human centromere probe. Scale bars (in white) = approx. 2.5μm. G) Structural abnormalities on a per cell and per chromosome basis in diploid and tetraploid clones. Number of structural abnormalities per cell is shown on the top colored graph (P values refer to comparisons between diploids and tetraploid clones at each passage), and the number of structural abnormalities per chromosome is shown on the below graph with grey bars representing exactly the same clones as in above graph (P values for comparisons between diploid and tetraploids at each passage are indicated above bars). Median number of spreads scored at each passage: passage 5 = 25, passage 25 = 29, passage 50 = 27, and HCT-116 = 37.
Figure 3
Figure 3
A, B) Colony-to-colony variation in modal chromosome copy number for chromosome 2 (A), and chromosome 8 (B). Frequency of different colony modes from clonal FISH data is shown from all clones at passage 5 and at passage 50. Median number of colonies scored: passage 5 = 44, passage 50 = 39. C) Live-cell imaging of H2B-mRFP expressing cell reveals different daughter cell-fates after segregation errors. The percentage frequency of each cell fate (mitosis or death or arrest [arrest = interphase >48hrs post division, see Methods]) in long-term live-cell imaging studies of all diploid and tetraploid clones either after no error or after a segregation error is shown. Example images of mitoses are shown above each panel. Data shown is an amalgamation of all clones (for individual results and n numbers see Supplementary Fig. 4G, and also see Supplementary Movies A-F). D) wGII at different passages for diploid and tetraploid clones. Dashed line indicates wGII=0.2, a threshold separating MIN and CIN cell lines (23). E) Weighted mean chromosome copy number versus wGII for CRC tumours from TCGA (grey), diploid clones (blue) and tetraploid clones (red) at different passages. Diploid clones at all passages overlay the same point. Lighter colours represent later passages for tetraploid clones. F) Genome-wide copy number losses and gains for all clones at passage 5, 25, 50 (and passage 75 for DC-14, DC-25, TC13, TC-16, TC17 and TC-35). Blue sections represent loss and red sections represent gain (relative to ploidy).
Figure 4
Figure 4
A) Relationship between copy number loss and wGII in TCGA cohort for genes identified as recurrently lost in tetraploid clones (see Supplementary Table 1). Blue represents loss and white represents no loss (relative to ploidy). CRC tumours (columns) are ordered according to increasing wGII score, from left to right. Every gene (rows) shows a significant correlation between copy number loss and wGII, even when taking into account an increased likelihood of loss in high wGII tumours (P<0.001; see Methods). Chromosome schematic shows where genes reside on chromosome 4; genes within regions shown in red are not depicted in the plot as they are not recurrently lost in all tetraploid clones. B) Kaplan Meier relapse free survival curves, censored at 2 years for genome-doubled (GD; red) and non-genome doubled (nGD; blue) TCGA cohort CRC tumours (n=150). P=0.019, log-rank test (for full survival curves see Supplementary Fig. 8A). C) Kaplan Meier relapse-free survival curves, censored at 2 years for genome-doubled (GD; red) and non-genome doubled (nGD; blue) validation cohort CRC tumours (n=389). P=0.0022, log-rank test (for full survival curves see Supplementary Fig.8B). D) Relationship between wGII, ploidy and tumour stage in genome-doubled tumours. Each circle represents one genome-doubled tumour. The barplot shows the proportion of different tumour stages for tetraploid and sub-tetraploid samples. P=0.0062, Cochrane-Armitage test for trend.

References

    1. Janssen A, Medema RH. Genetic instability: tipping the balance. Oncogene. 2012 - PubMed
    1. McGranahan N, Burrell RA, Endesfelder D, Novelli MR, Swanton C. Cancer chromosomal instability: therapeutic and diagnostic challenges. EMBO Rep. 2012;13:528–38. - PMC - PubMed
    1. Lee AJ, Endesfelder D, Rowan AJ, Walther A, Birkbak NJ, Futreal PA, et al. Chromosomal instability confers intrinsic multidrug resistance. Cancer Res. 2011;71:1858–70. - PMC - PubMed
    1. Thompson SL, Compton DA. Examining the link between chromosomal instability and aneuploidy in human cells. J Cell Biol. 2008;180:665–72. - PMC - PubMed
    1. McClelland SE, Burrell RA, Swanton C. Chromosomal instability: a composite phenotype that influences sensitivity to chemotherapy. Cell Cycle. 2009;8:3262–6. - PubMed

Publication types