. 2015 Jul;25(7):1792-805.
doi: 10.1093/cercor/bht418. Epub 2014 Jan 15.

Parametric Coding of the Size and Clutter of Natural Scenes in the Human Brain

Affiliations

Parametric Coding of the Size and Clutter of Natural Scenes in the Human Brain

Soojin Park et al. Cereb Cortex. 2015 Jul.

Abstract

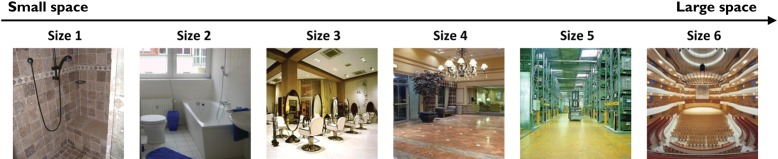
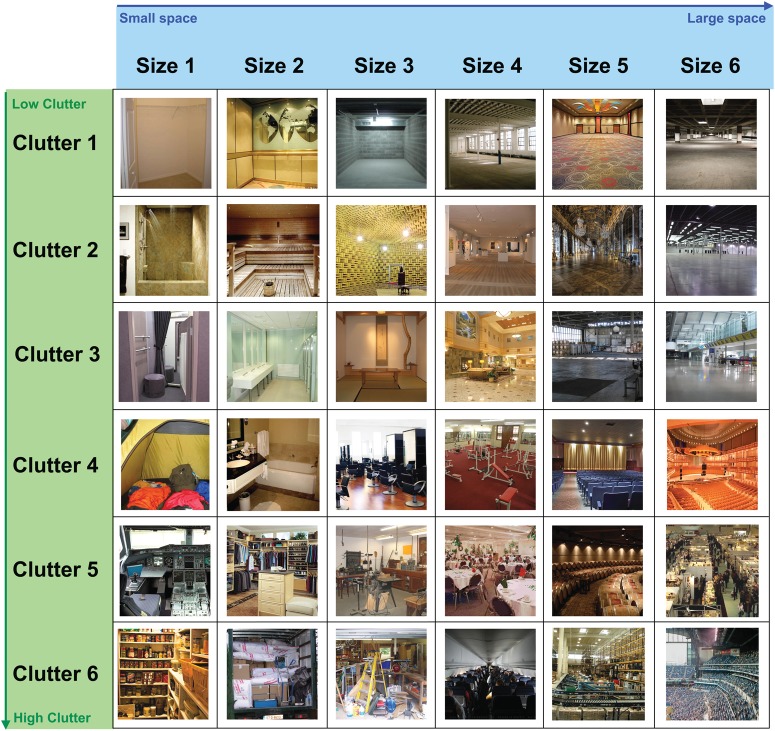
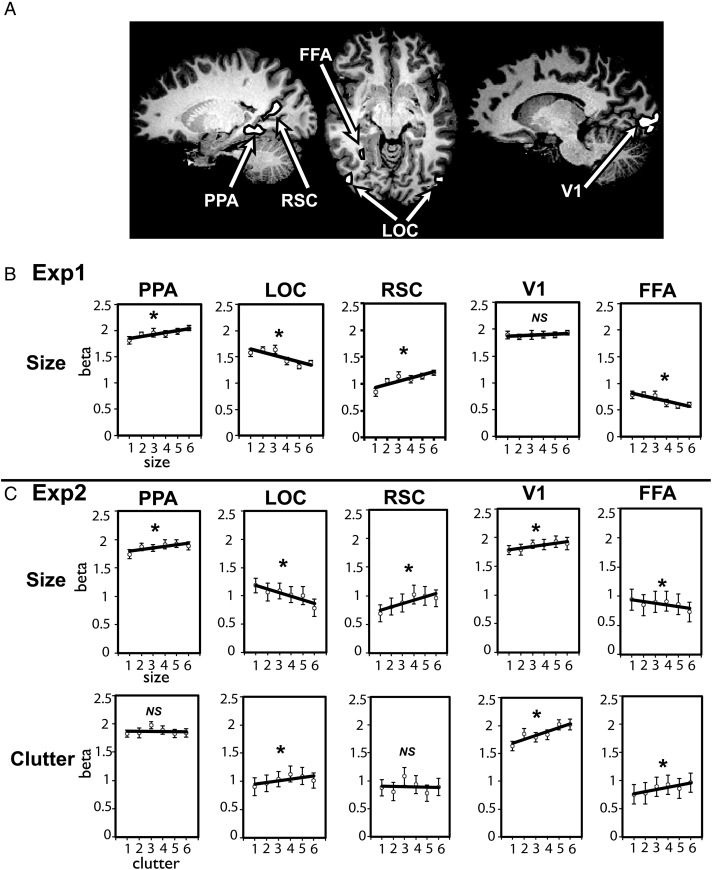
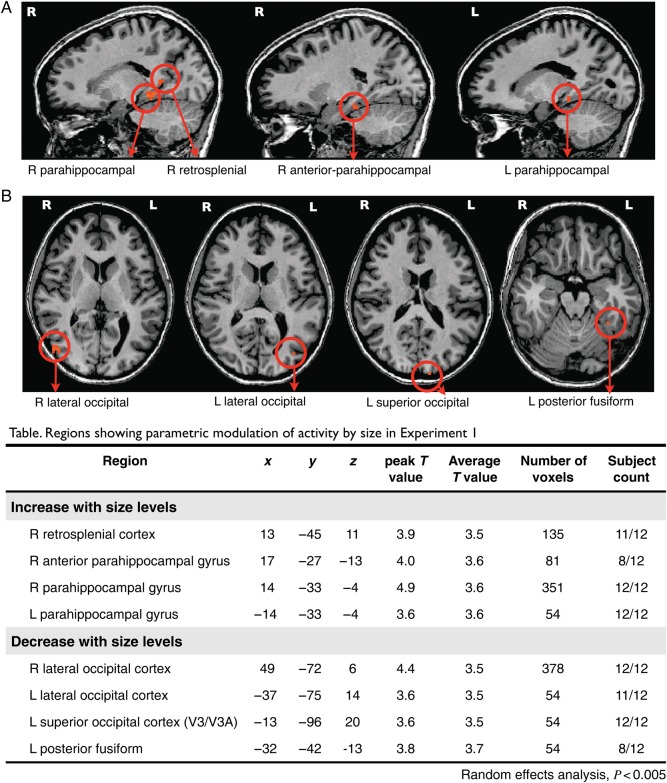
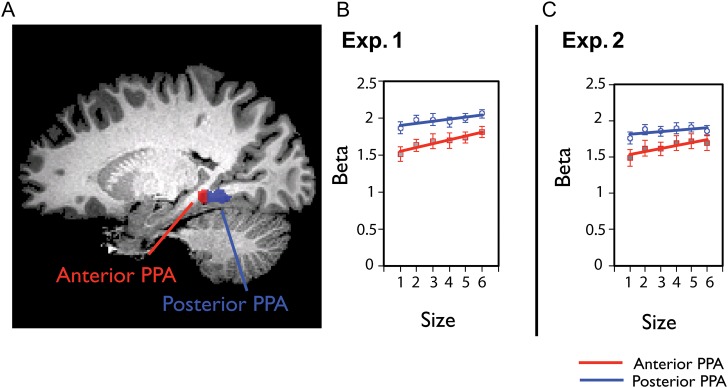
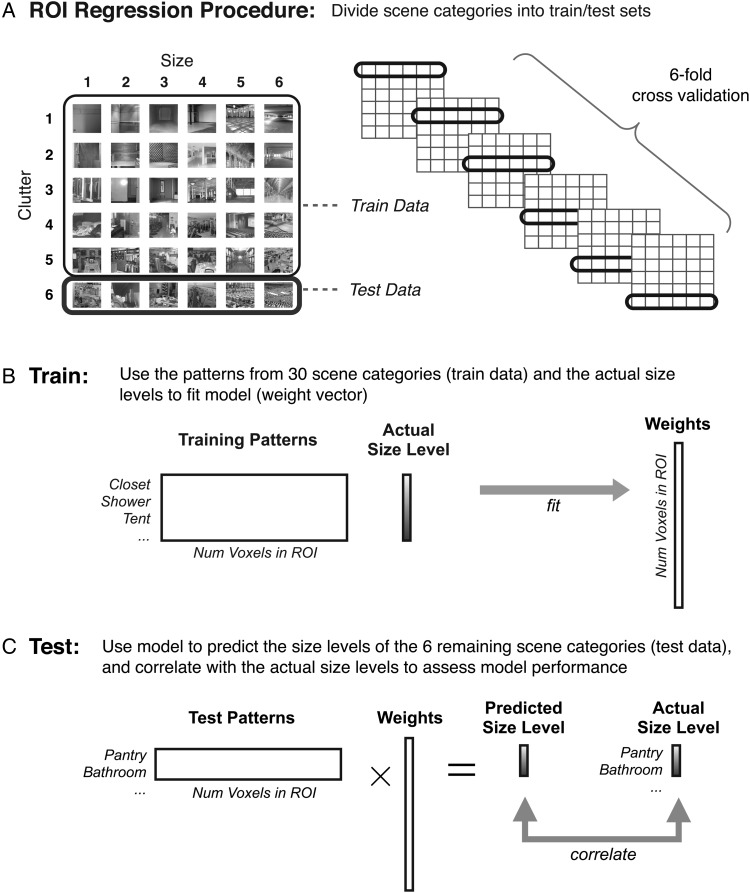
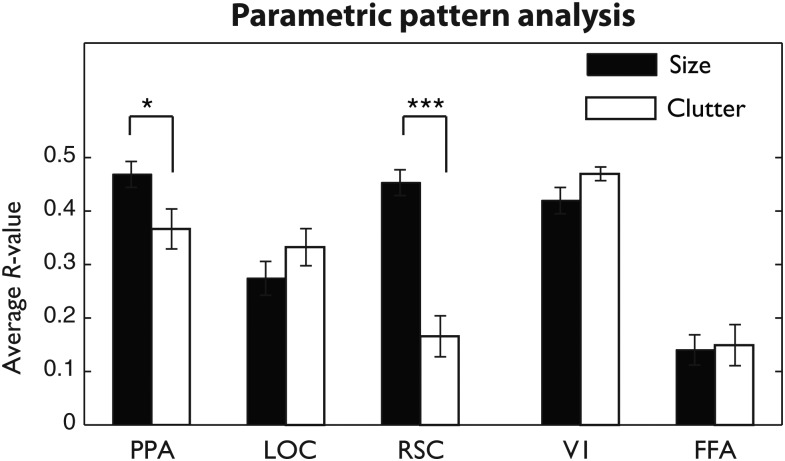
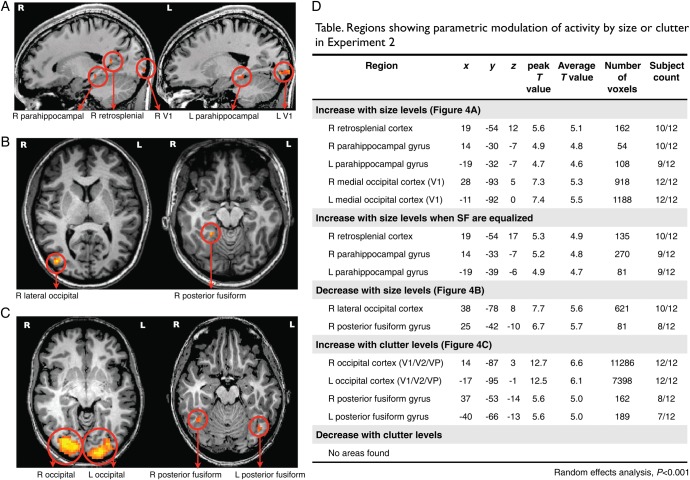
Estimating the size of a space and its degree of clutter are effortless and ubiquitous tasks of moving agents in a natural environment. Here, we examine how regions along the occipital-temporal lobe respond to pictures of indoor real-world scenes that parametrically vary in their physical "size" (the spatial extent of a space bounded by walls) and functional "clutter" (the organization and quantity of objects that fill up the space). Using a linear regression model on multivoxel pattern activity across regions of interest, we find evidence that both properties of size and clutter are represented in the patterns of parahippocampal cortex, while the retrosplenial cortex activity patterns are predominantly sensitive to the size of a space, rather than the degree of clutter. Parametric whole-brain analyses confirmed these results. Importantly, this size and clutter information was represented in a way that generalized across different semantic categories. These data provide support for a property-based representation of spaces, distributed across multiple scene-selective regions of the cerebral cortex.

Keywords: fMRI; multivoxel pattern analysis; scene and space perception; the parahippocampal place area; the retrosplenial cortex.


Figures

Figure 1.
Figure 1.
Examples of scenes used in Experiment 1, varying in the size of the space from small to large, on a 6-point scale (from left to right). Scene categories representing each size levels are level 1 = closet, shower, pantry; level 2 = bathroom, pilothouse, music studio; level 3 = bedroom, hair salon, classroom; level 4 = gym, lobby, church; level 5 = warehouse, hangar, airport terminal; level 6 = shopping mall, concert hall, sports stadium.
Figure 2.
Figure 2.
Examples of 36 scene categories varying in 2 orthogonalized properties used in Experiment 2: The size of the scene varied from small to large size on 6-point scale (size levels 1–6 from left to right); the amount of clutter varied from low clutter to high clutter on 6-point scale (clutter levels 1–6 from top to bottom). Scene categories representing each size and clutter level are (organized by size level – clutter level; column–row): 1–1 = closet, 1–2 = shower, 1–3 = fitting room, 1–4 = tent, 1–5 = cockpit, 1–6 = pantry; 2–1 = elevator, 2–2 = sauna, 2–3 = restroom, 2–4 = bathroom, 2–5 = walk-in closet, 2–6 = moving truck; 3–1 = garage, 3–2 = anechoic chamber, 3–3 = Japanese room, 3–4 = hair salon, 3–5 = workshop, 3–6 = messy garage; 4–1 = loft, 4–2 = art gallery, 4–3 = lobby, 4–4 = gym, 4–5 = banquet hall, 4–6 = inside airplane; 5–1 = ball room, 5–2 = palace hall, 5–3 = hangar, 5–4 = movie theater, 5–5 = barrel storage, 5–6 = warehouse; 6–1 = parking garage, 6–2 = industrial warehouse, 6–3 = airport terminal, 6–4 = concert hall, 6–5 = exhibition hall, 6–6 = arena.
Figure 3.
Figure 3.
(A) Regions of interest shown on a representative participant's brain. (B) Experiment 1: Average beta weights are shown for the size of the space (1–6) in the PPA, RSC, LOC, FFA, and V1. The PPA and RSC showed a significant increase of activity as the size of scenes increased; LOC and FFA showed a significant decrease of activity as scene size increased. (C) Experiment 2: Average beta weights are shown for the size of the space (1–6) and for the levels of clutter (1–6) in the PPA, RSC, LOC, FFA, and V1. The PPA, RSC, and V1 showed a significant increase of activity as the size of scenes increased; LOC and FFA showed a significant decrease of activity as scene size increased. For clutter, there was no significant difference in the PPA and RSC activity as the amount of clutter increased or decreased. The LOC, FFA, and V1 showed a significant increase of activity as the amount clutter in a scene increased. Error bars reflect ±1 standard error of the mean.
Figure 4.
Figure 4.
The figure shows regions from parametric whole-brain analysis (random-effects analysis, P < 0.005, cluster threshold >54 mm3) in Experiment 1. Names of regions are marked with arrows below each figure. (A) Regions showing parametrically higher activity as the size of scenes increase; (B) Regions showing parametrically higher activity as the size of scenes decrease; In the table, names of regions showing parametric modulation of activity with Talairach coordinates for peak voxels within each regions, peak and average T values, number of voxels, and the count of subjects who showed the same regions in individual whole-brain analyses.
Figure 5.
Figure 5.
(A) An example of the anterior and posterior PPA of one representative subject is shown. The anterior and posterior PPA were defined by a split-half analysis within each individual's functionally localized PPA. (B) The average beta weights for the size of space in the anterior and posterior halves of the PPA in Experiment 1. The anterior and posterior halves are indicated by red (anterior) or blue (posterior) lines. The PPA shows greater increase of activity for anterior subdivisions compared with posterior subdivision. (C) The anterior–posterior PPA analysis in Experiment 2 showed the same result. Error bars reflect ±1 standard error of the mean.
Figure 6.
Figure 6.
ROI regression procedure. (A) To test for a parametric pattern representation of a size (and clutter), we first divided the data into a training set with 5 of 6 categories per size level (30 categories total), and a test set with the remaining 6 categories, which all shared the same clutter level. This method of dividing data into train and test sets is necessary to have an unbiased estimate of size prediction independent of clutter (and vice versa). A 6-fold validation procedure was conducted which iteratively left out 6 scene categories that spanned the range of sizes and shared a clutter level. Analogous procedures were used for clutter-regression models. (B) In the training phase, the patterns from 30 training categories and their actual size levels were used to fit a model (set of weights on each voxel). (C) During the testing phase, the test patterns were multiplied by the weight vector to generate predicted size levels (which could take on any real value). Performance was assessed by computing the correlation between the actual and predicted size levels, averaged over all iterations, and was aggregated across subjects for each ROI.
Figure 7.
Figure 7.
Correlation between multivoxel model predictions and actual size or clutter levels, averaged over train–test iterations for each subject and each region of interest. Error bars reflect ±1 within-subject standard error of the mean (*P < 0.05, ***P < 0.001).
Figure 8.
Figure 8.
The figure shows regions from parametric whole-brain analysis (random-effects analysis, P < 0.001, cluster threshold >54 mm3) for Experiment 2. Names of regions are marked with arrows below each figure. (A) Regions showing parametrically increasing activity as the size of scenes increase; (B) Regions showing parametrically increasing activity as the size of scenes decrease; (C) Regions showing parametrically increasing activity as the amount of clutter in scenes increases. (D) The table indicates the names of regions showing parametric modulation of activity with the Talairach coordinates for the peak voxel within each region, the magnitude of the peak T value and average the T values, the number of voxels, and the count of subjects who showed the same regions in individual whole-brain analyses.

References

    1. Alvarez GA, Oliva A. 2008. The representation of simple ensemble visual features outside the focus of attention. Psychol Sci. 19(4):392–398. - PMC - PubMed
    1. Arcaro MJ, McMains S, Singer B, Kastner S. 2009. Retinotopic organization of human ventral visual cortex. J Neurosci. 29:10638–10652. - PMC - PubMed
    1. Auger SD, Mullally SL, Maguire EA. 2012. Retrosplenial cortex codes for permanent landmarks. PLoS One. 7(8):e43620. - PMC - PubMed
    1. Baldassano C, Beck DM, Fei-Fei L. 2013. Differential connectivity within the parahippocampal place area. Neuroimage. 75:228–237. - PMC - PubMed
    1. Bar M, Aminoff E. 2003. Cortical analysis of visual context. Neuron. 38:347–358. - PubMed

Publication types