Clinical Trial
. 2014 Feb 28;289(9):5580-95.
doi: 10.1074/jbc.M113.539486. Epub 2014 Jan 16.

Assessment of myeloperoxidase activity by the conversion of hydroethidine to 2-chloroethidium

Affiliations
Clinical Trial

Assessment of myeloperoxidase activity by the conversion of hydroethidine to 2-chloroethidium

Ghassan J Maghzal et al. J Biol Chem. .

Abstract

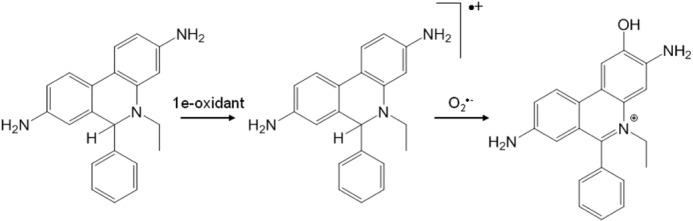
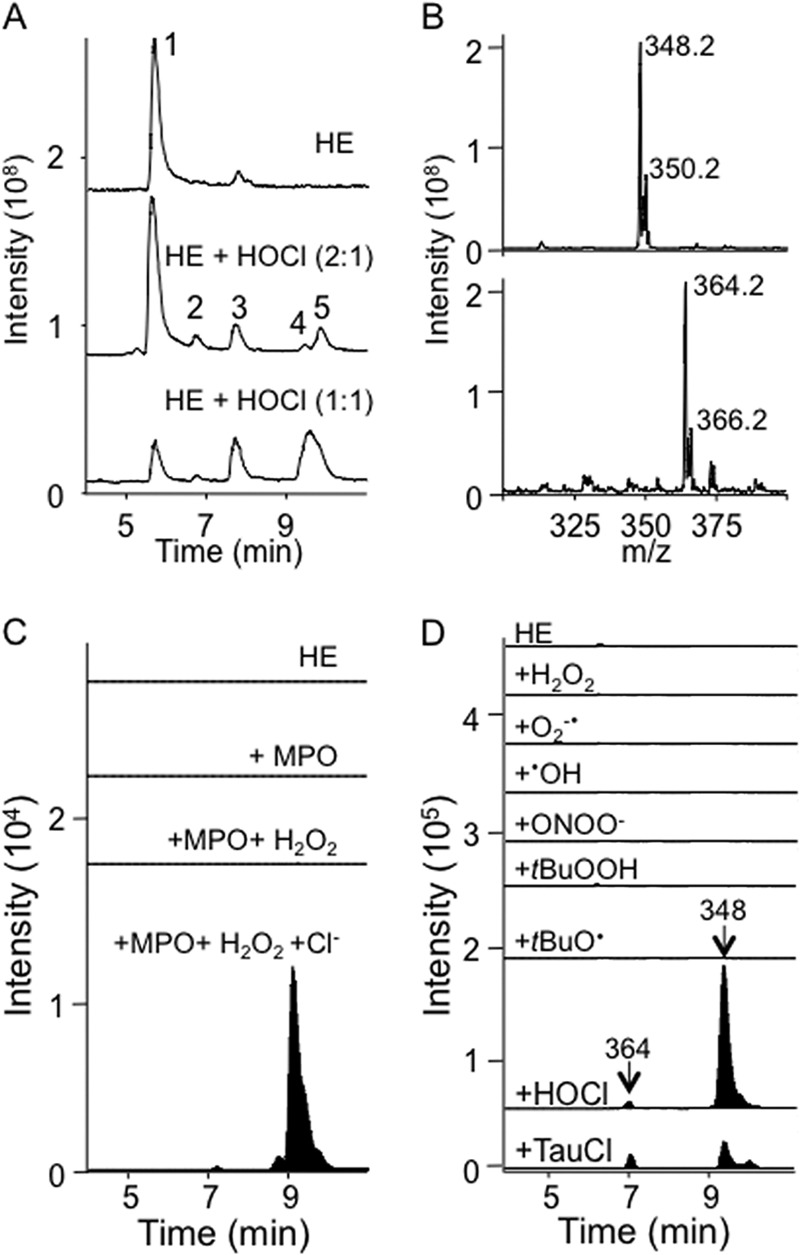
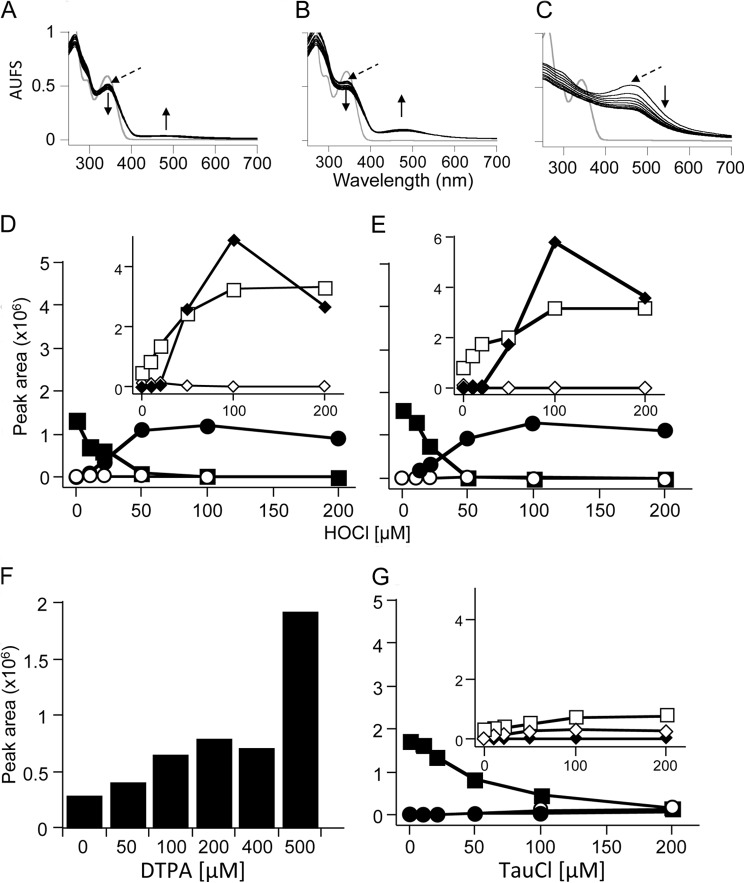
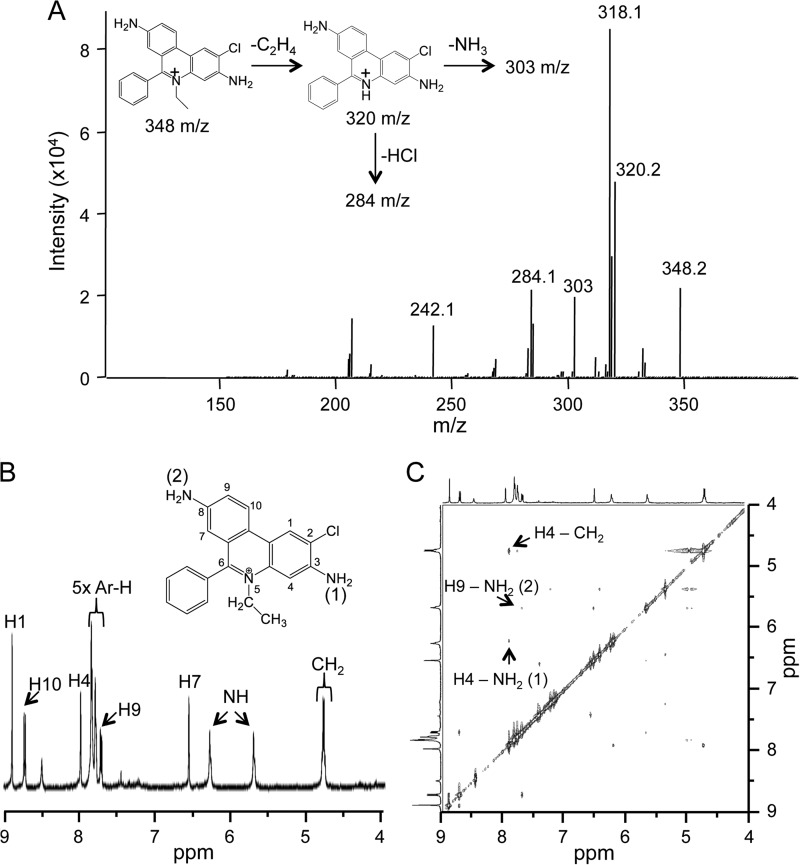
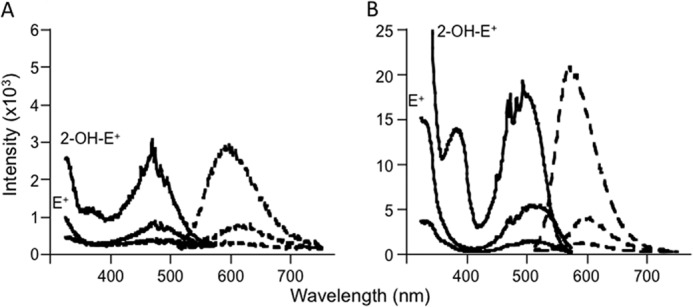
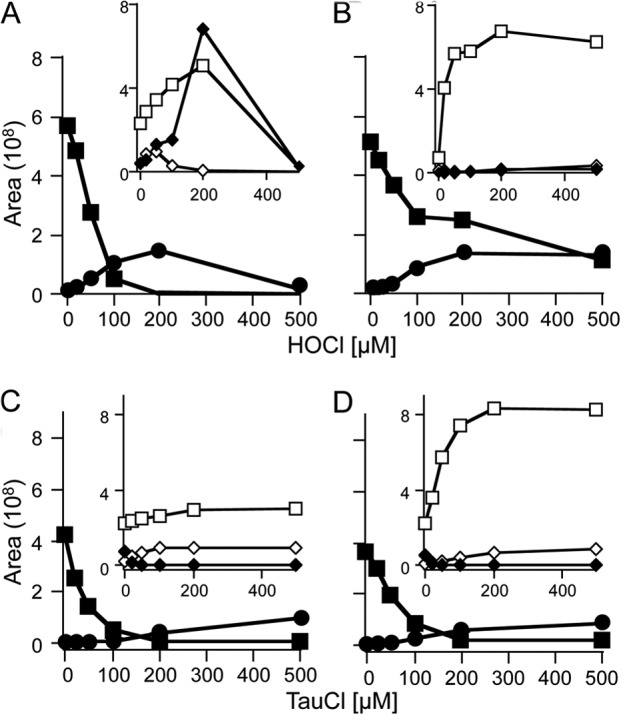
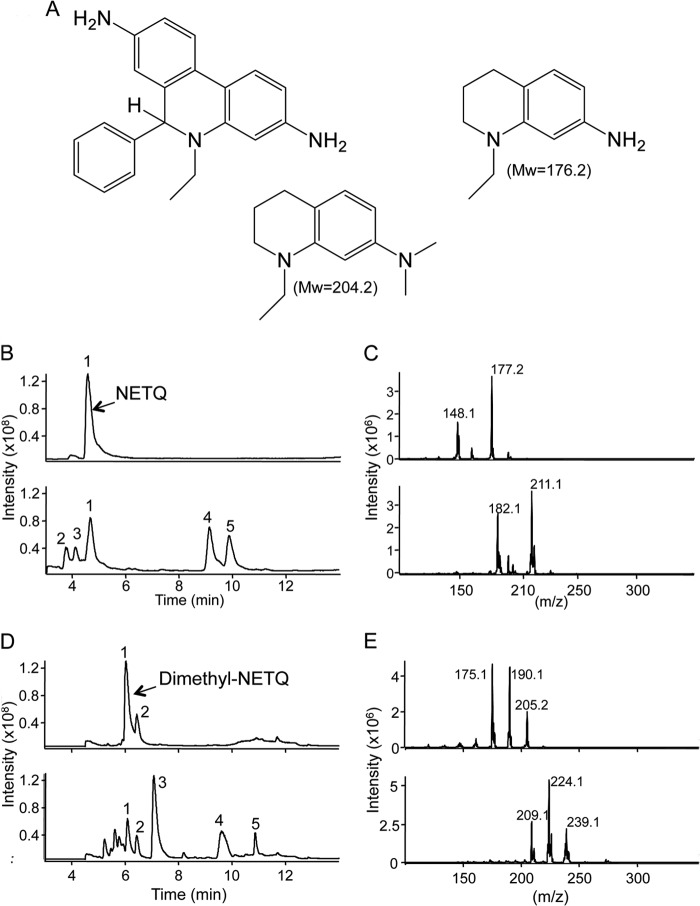
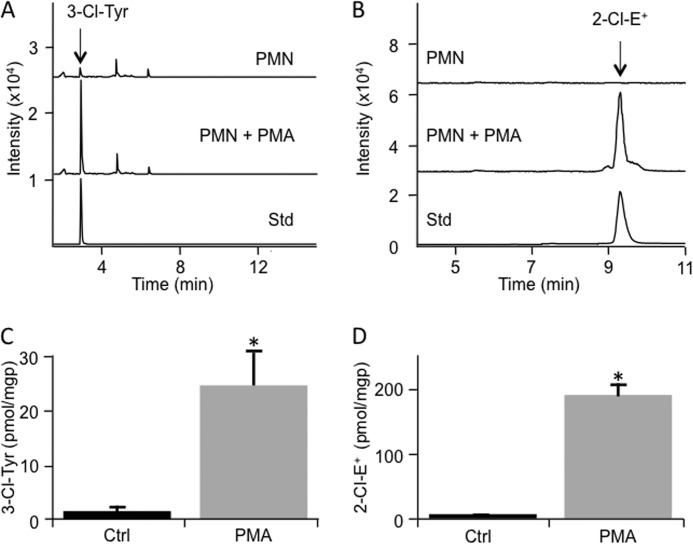
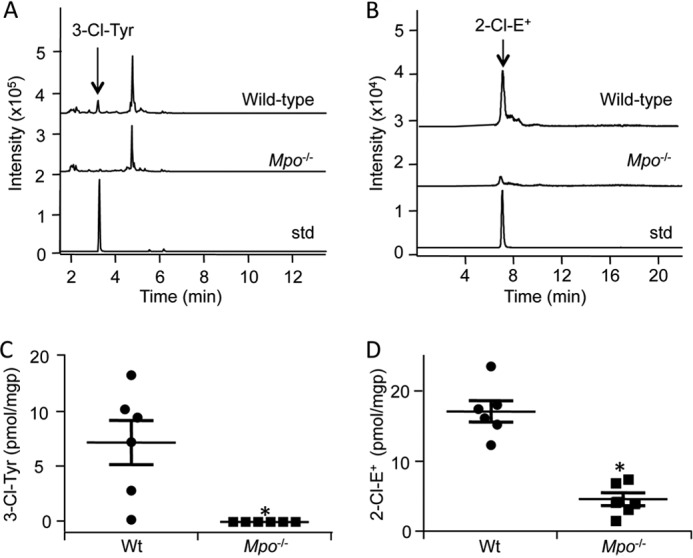
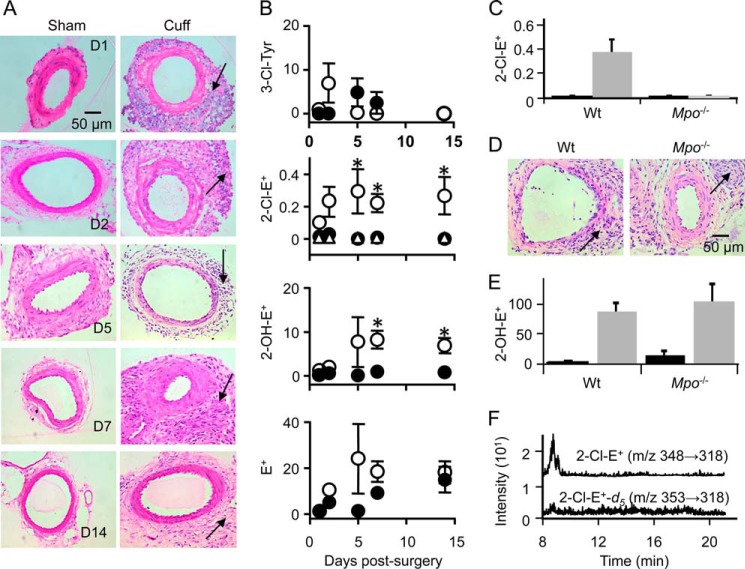
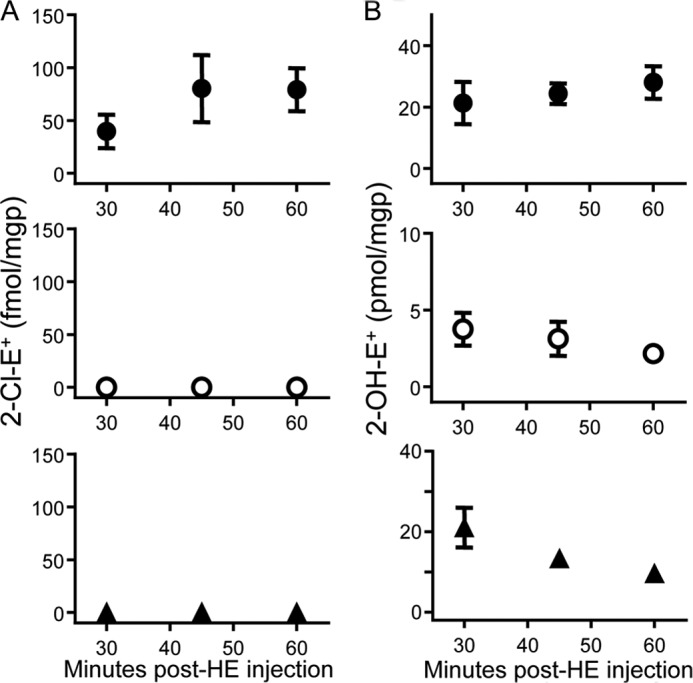
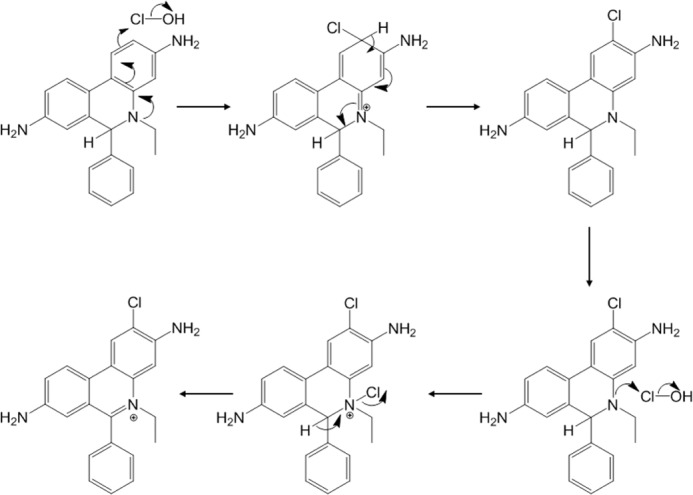
Oxidants derived from myeloperoxidase (MPO) contribute to inflammatory diseases. In vivo MPO activity is commonly assessed by the accumulation of 3-chlorotyrosine (3-Cl-Tyr), although 3-Cl-Tyr is formed at low yield and is subject to metabolism. Here we show that MPO activity can be assessed using hydroethidine (HE), a probe commonly employed for the detection of superoxide. Using LC/MS/MS, (1)H NMR, and two-dimensional NOESY, we identified 2-chloroethidium (2-Cl-E(+)) as a specific product when HE was exposed to hypochlorous acid (HOCl), chloramines, MPO/H2O2/chloride, and activated human neutrophils. The rate constant for HOCl-mediated conversion of HE to 2-Cl-E(+) was estimated to be 1.5 × 10(5) M(-1)s(-1). To investigate the utility of 2-Cl-E(+) to assess MPO activity in vivo, HE was injected into wild-type and MPO-deficient (Mpo(-/-)) mice with established peritonitis or localized arterial inflammation, and tissue levels of 2-Cl-E(+) and 3-Cl-Tyr were then determined by LC/MS/MS. In wild-type mice, 2-Cl-E(+) and 3-Cl-Tyr were detected readily in the peritonitis model, whereas in the arterial inflammation model 2-Cl-E(+) was present at comparatively lower concentrations (17 versus 0.3 pmol/mg of protein), and 3-Cl-Tyr could not be detected. Similar to the situation with 3-Cl-Tyr, tissue levels of 2-Cl-E(+) were decreased substantially in Mpo(-/-) mice, indicative of the specificity of the assay. In the arterial inflammation model, 2-Cl-E(+) was absent from non-inflamed arteries and blood, suggesting that HE oxidation occurred locally in the inflamed artery. Our data suggest that the conversion of exogenous HE to 2-Cl-E(+) may be a useful selective and sensitive marker for MPO activity in addition to 3-Cl-Tyr.

Keywords: 3-Chlorotyrosine; Chloramines; Dihydroethidium; HPLC; Hypochlorous Acid; Inflammation; Mass Spectrometry (MS); Neutrophil; Oxidative Stress.


Figures

SCHEME 1.
SCHEME 1.
Mechanism of the formation of 2-OH-E+ from the reaction of O2 with HE. Adapted from Zielonka and Kalyanaraman (4).
FIGURE 1.
FIGURE 1.
Reaction of HOCl or chloramines with HE yields chlorinated species. A, LC/MS total ion chromatograms of HE (100 μm) in 100 mm phosphate buffer, pH 7.4, containing 100 μm DTPA ± the addition of 50 or 100 μm HOCl. B, MS spectrum of peaks at 7.2 and 9.2 min containing m/z 364 and 348, respectively. C, selected ion LC/MS chromatograms of HE (100 μm) in 100 mm phosphate buffer containing 100 μm DTPA ± the addition of MPO (10 nm) or MPO (10 nm) + H2O2 (50 μm) showing single ion monitoring for m/z 348 and 364. The latter reaction was also performed in PBS instead of phosphate buffer to add chloride ions to the reaction (MPO + H2O2 + Cl), i.e. conditions that resulted in the formation of peaks containing m/z 348 and 364 at 9.2 and 7.2 min. D, selected ion LC/MS chromatograms showing m/z 348 and 364 for the reaction of HE (50 μm) in 75 mm phosphate buffer, pH 7.4, ± various oxidants: H2O2 (250 μm in presence of 100 μm DTPA); O2 (1 mm hypoxanthine, 0.05 units/ml xanthine oxidase in the presence of 100 μm DTPA); OH (250 μm H2O2 plus excess Fe(II) sulfate); ONOO (250 μm); tBuOOH (250 μm in presence of 100 μm DTPA); tBuOO (250 μm tBuOOH plus excess Fe(II) sulfate); 250 μm HOCl or 250 μm taurine chloramines (TauCl). Reaction mixtures were incubated for 30 min in the dark at room temperature, then centrifuged at 16,000 × g for 10 min at 4 °C. 5 μl were then subjected to LC/MS analysis with m/z 348 and 364 shown only.
FIGURE 2.
FIGURE 2.
Characteristics of the reaction of HE with HOCl. HOCl at 10 μm (A), 50 μm (B), or 125 μm (C) was added to 50 μm HE in 100 mm phosphate buffer, pH 7.4. Spectra were recorded at 1-min intervals for 12 min after starting the reaction with the addition of HOCl while mixing vigorously. Gray lines represent HE before the addition of HOCl. Dashed arrows indicate the first spectrum after the addition of HOCl. ↑/↓ indicate a increase/decrease in peak maxima with time. Data are representative of three independent experiments. AUFS, absorbance units at full scale. D, effect of HOCl concentration on LC/MS/MS peak areas of HE and oxidation products from the reaction of HE (50 μm) with HOCl (0–200 μm) in 100 mm phosphate buffer, pH 7.4, containing 100 μm DTPA. E, repeat of experiment in D with inclusion of superoxide dismutase (200 units). F, LC/MS/MS peak area of 2-OH-E+ from the reaction of HE (100 μm) with HOCl (50 μm) in 100 mm phosphate buffer, pH 7.4, containing increasing concentrations of DTPA (0–500 μm). G, effect of taurine chloramine (TauCl) on LC/MS/MS peak areas of selected analytes measured from the reaction of HE (50 μm) with taurine chloramine (0–200 μm) in 100 mm phosphate buffer, pH 7.4, containing 100 μm DTPA. Reaction mixtures were incubated in the dark for 30 min at room temperature before centrifugation at 16,000 × g for 10 min. The supernatants were then analyzed by LC/MS/MS as described under “Experimental Procedures” for the detection of HE (■), m/z 348 (●), m/z 364 (○), 2-OH-E+ (◆), E+ (□) and E+-E+ (♦). Data are representative of three separate experiments, except for F, where they represent two separate experiments.
FIGURE 3.
FIGURE 3.
Structural determination of the chlorinated product formed from the reaction of HOCl with HE. A, MS/MS spectrum of the HPLC purified chlorinated product (m/z 348) from the reaction of HOCl with HE in 100 mm phosphate buffer with 100 μm DTPA (the inset shows theoretical MS/MS fragments of m/z 348). Shown are high resolution 1H NMR (B) and two-dimensional NMR (NOESY) spectra (C) of the HPLC-purified chlorinated product (m/z 348) showing through space correlations.
FIGURE 4.
FIGURE 4.
Fluorescence spectral characterization of 2-Cl-E+. A, fluorescence spectra of 10 μm 2-OH-E+ (top lines), E+ (middle lines), and 2-Cl-E+ (bottom lines) in 10 mm Tris buffer, pH 7.4, containing 1 mm EDTA. B, fluorescence spectra of 1 μm 2-OH-E+, E+, or 2-Cl-E+ in the presence of 1 mg/ml DNA (calf thymus) in 10 mm Tris buffer, pH 7.4, containing 1 mm EDTA. Solid lines represent fluorescence excitation spectra, whereas dashed lines represent emission spectra.
FIGURE 5.
FIGURE 5.
Mechanistic studies related to the formation of 2-Cl-E+ from the reaction of HE with HOCl. HOCl (0–500 μm) was added to HE (100 μm) in 100 mm phosphate buffer, pH 7.4, in the absence (A) or presence (B) of 1 mm Trolox®. Taurine chloramine (TauCl; 0–500 μm) was added to HE (100 μm) in 100 mm phosphate buffer, pH 7.4, in the absence (C) or presence (D) of 1 mm Trolox®. Reaction mixtures were incubated in the dark for 30 min at room temperature before centrifugation at 16,000 × g for 10 min. The resulting supernatants were then analyzed by LC/MS/MS as described under “Experimental Procedures” to determine the areas of HE (■), 2-Cl-E+ (●), 2-OH-E+ (◆), E+ (□), and E+-E+ (♦). Data are representative of three separate experiments.
FIGURE 6.
FIGURE 6.
Reaction of HOCl with HE analog. A, Structures of HE, NETQ, and the dimethyl analog of NETQ. B, LC/MS chromatograms of NETQ (100 μm) in 100 mm phosphate buffer containing 100 μm DTPA before (top) and after the addition of 100 μm HOCl (bottom). C, MS spectra of NETQ (top) and of peak 4 at 9 min from the reaction of NETQ with HOCl (bottom). D, LC/MS chromatograms of dimethyl-NETQ (100 μm) in 100 mm phosphate buffer containing 100 μm DTPA (top) and upon the addition of 100 μm HOCl (bottom). E, MS spectra of dimethyl-NETQ (top) and of peak 3 at 7.2 min from the reaction of dimethyl-NETQ with HOCl (bottom).
FIGURE 7.
FIGURE 7.
Formation of 2-Cl-E+ by stimulated human PMN. A, isolated human PMN (107) were stimulated with PMA or ethanol (vehicle control) for 1 h at 37 °C. Cells were then lysed, and proteins were precipitated and then hydrolyzed. Tyrosine and 3-Cl-Tyr were measured by LC/MS/MS. The top chromatogram represents vehicle-treated PMN, whereas the middle chromatogram is from PMA-stimulated PMN. The bottom chromatogram represents 3-Cl-Tyr standard. B, isolated human PMN (5–10 × 106) were incubated in HBSS containing 200 ng/ml PMA for 1 h at 37 °C before the addition of 10 μm HE for a further 1 h. Cells were then washed twice with PBS and lysed with 200 μl of 80% v/v ice-cold argon-bubbled ethanol. Five μl of supernatant were then analyzed by LC/MS/MS for 2-Cl-E+ (m/z transition 348 to 320) (middle chromatogram). The top chromatogram represents control cells treated with vehicle (8 μl ethanol) for 1 h at 37 °C, whereas the bottom chromatogram represents purified 2-Cl-E+ standard. C, quantification of 3-Cl-Tyr in PMN (107) stimulated with PMA or ethanol (vehicle control) for 1 h at 37 °C as in B, with data representing the mean ± S.E. of three independent experiments done in duplicate. D, quantification of 2-Cl-E+ in control or stimulated PMN as in A with data representing the mean ± S.E. of three independent experiments. *, p < 0.05 (control versus PMA treatment); Mann Whitney rank sum test. Protein levels were based on levels of 0.1 mg of protein/106 cells, measured in a separate set of samples that was not analyzed for 3-Cl-Tyr or 2-Cl-E+.
FIGURE 8.
FIGURE 8.
Decrease in the formation of 2-Cl-E+ in peritoneal phagocytes from Zymosan A-treated Mpo−/− mice. To induce peritonitis, wild-type C57BL/6J or Mpo−/− mice were injected intraperitoneally with 250 μl of 5 mg/ml Zymosan A solution in PBS. A, 5 h after induction of peritonitis, peritoneal phagocytes were collected by lavage as under “Experimental Procedures.” Cells were then lysed, and proteins were precipitated and hydrolyzed for LC/MS/MS detection of Tyr and 3-Cl-Tyr. The top, middle, and bottom chromatograms are representative of wild-type peritoneal cells, Mpo−/− peritoneal cells, and 3-Cl-Tyr standard, respectively. B, 4 h after induction of peritonitis, mice were injected intraperitoneally with 80 μl of 20 mm HE, and peritoneal phagocytes were collected 1 h later by lavage as described under “Experimental Procedures.” Cells were then lysed in 80% ice-cold argon-bubbled ethanol, and the supernatant was analyzed by LC/MS/MS for 2-Cl-E+. The top, middle, and bottom chromatograms are representative of wild-type peritoneal cells, Mpo−/− peritoneal cells, and purified 2-Cl-E+ standard, respectively. C and D, quantification of 3-Cl-Tyr (C) and 2-Cl-E+ (D) in peritoneal phagocytes from wild-type (●) or Mpo−/− (■) mice treated as described in A and B, respectively. Protein levels were calculated based on 0.032 ± 0.005 mg of protein/106 cells, measured in a separate set of samples that was not analyzed for 3-Cl-Tyr or 2-Cl-E+. Data represent the mean ± S.E. of n ≥ 5. *, p < 0.05 (wild-type versus Mpo−/−); Mann Whitney rank sum test.
FIGURE 9.
FIGURE 9.
Detection of 2-Cl-E+ in a mouse model of arterial inflammation. A non-occlusive cuff was placed around the femoral artery of wild-type C57BL/6J mice for 1, 2, 5, 7, or 14 days before HE (80 μl of 20 mm) was administered by intravenous injection. A, hematoxylin and eosin-stained sections of sham (left) and cuff-injured (right) femoral arteries from wild-type mice at days 1, 2, 5, 7, and 14 post-surgery. Inflammatory cell infiltration is seen in the adventitia (arrows). B, levels (pmol/mg of protein) of 3-Cl-Tyr, 2-Cl-E+, 2-OH-E+, and E+ in sham (●) and cuff-injured (○) arteries were analyzed by LC/MS/MS as described under “Experimental Procedures.” ▵ represents levels of 2-Cl-E+ in plasma of wild-type mice after cuff-surgery. Protein levels were based on levels of 0.039 ± 0.005 mg of protein/1-mg arterial tissue wet weight, measured in a separate set of samples. C, levels of 2-Cl-E+ (pmol/mg of protein) in sham (black columns) and cuff-injured (gray columns) femoral artery sections of wild-type and Mpo−/− mice at day 14 post-surgery were analyzed by LC/MS/MS as described under “Experimental Procedures.” D, hematoxylin and eosin-stained sections of cuff-injured femoral arteries from wild-type and Mpo−/− mice at day 14 post-surgery. E, levels of 2-OH-E+ (pmol/mg of protein) in sham (black columns) and cuff-injured (gray columns) femoral artery sections of wild-type and Mpo−/− mice at day 14 post-surgery were analyzed by LC/MS/MS as described under “Experimental Procedures.” F, representative LC/MS/MS chromatograms of cuff-operated femoral artery homogenate (day 14 after surgery) showing a clear peak for 2-Cl-E+ (top chromatogram). No peak was visible for 2-Cl-E+-d5 (m/z 353 → 318) in the same sample (bottom chromatogram). Data represent the mean ± S.E. of n ≥ 5. *, p < 0.05, using two-way analysis of variance with Bonferroni post-hoc analysis.
SCHEME 2.
SCHEME 2.
Synthesis of HE-d5. a, ethyl chloroformate, pyridine, room temperature, 5 h, 99% yield. b, iodoethane-d5, nitromethane, 100 °C, 7 days, 58% yield. c, 48% HBr, reflux, 16 h, 89% yield. d, NaBH4, methanol, room temperature, 10 min, 70% yield.
FIGURE 10.
FIGURE 10.
Time course of formation of 2-Cl-E+ and 2-OH-E+ in a mouse model of arterial inflammation. A non-occlusive cuff was placed around the femoral artery of wild-type C57BL/6J mice for 7 days before HE (80 μl of 20 mm) was administered by intravenous injection. Blood and cuffed (inflamed) and contralateral non-cuffed (sham, non-inflamed) arteries were then collected after the time indicated and analyzed for 2-Cl-E+ (A) and 2-OH-E+ (B) in inflamed arteries (●), sham arteries (○), and plasma (▴) by LC/MS/MS as described under “Experimental Procedures.” Data represent the mean ± S.E. of n ≥ 4.
SCHEME 3.
SCHEME 3.
Proposed mechanism for the formation of 2-Cl-E+ from the reaction of HOCl with HE.

References

    1. Halliwell B., Gutheridge J. M. C. (2007) Free Radicals in Biology and Medicine, 4th Ed., pp. 46–69, Oxford University Press, Oxford, UK
    1. Winterbourn C. C. (2008) Reconciling the chemistry and biology of reactive oxygen species. Nat. Chem. Biol. 4, 278–286 - PubMed
    1. Dikalov S., Griendling K. K., Harrison D. G. (2007) Measurement of reactive oxygen species in cardiovascular studies. Hypertension 49, 717–727 - PMC - PubMed
    1. Zielonka J., Kalyanaraman B. (2010) Hydroethidine- and MitoSOX-derived red fluorescence is not a reliable indicator of intracellular superoxide formation. Another inconvenient truth. Free Radic. Biol. Med. 48, 983–1001 - PMC - PubMed
    1. Zhao H., Joseph J., Fales H. M., Sokoloski E. A., Levine R. L., Vasquez-Vivar J., Kalyanaraman B. (2005) Detection and characterization of the product of hydroethidine and intracellular superoxide by HPLC and limitations of fluorescence. Proc. Natl. Acad. Sci. U.S.A. 102, 5727–5732 - PMC - PubMed

Publication types